

Adipocyte autophagy limits gut inflammation by controlling oxylipin and IL-10
- PMID: 36795015
- PMCID: PMC10015370
- DOI: 10.15252/embj.2022112202
Adipocyte autophagy limits gut inflammation by controlling oxylipin and IL-10
Abstract
Lipids play a major role in inflammatory diseases by altering inflammatory cell functions, either through their function as energy substrates or as lipid mediators such as oxylipins. Autophagy, a lysosomal degradation pathway that limits inflammation, is known to impact on lipid availability, however, whether this controls inflammation remains unexplored. We found that upon intestinal inflammation visceral adipocytes upregulate autophagy and that adipocyte-specific loss of the autophagy gene Atg7 exacerbates inflammation. While autophagy decreased lipolytic release of free fatty acids, loss of the major lipolytic enzyme Pnpla2/Atgl in adipocytes did not alter intestinal inflammation, ruling out free fatty acids as anti-inflammatory energy substrates. Instead, Atg7-deficient adipose tissues exhibited an oxylipin imbalance, driven through an NRF2-mediated upregulation of Ephx1. This shift reduced secretion of IL-10 from adipose tissues, which was dependent on the cytochrome P450-EPHX pathway, and lowered circulating levels of IL-10 to exacerbate intestinal inflammation. These results suggest an underappreciated fat-gut crosstalk through an autophagy-dependent regulation of anti-inflammatory oxylipins via the cytochrome P450-EPHX pathway, indicating a protective effect of adipose tissues for distant inflammation.
Keywords: IL-10; adipocyte; autophagy; inflammation; oxylipin.
© 2023 The Authors. Published under the terms of the CC BY 4.0 license.
Figures
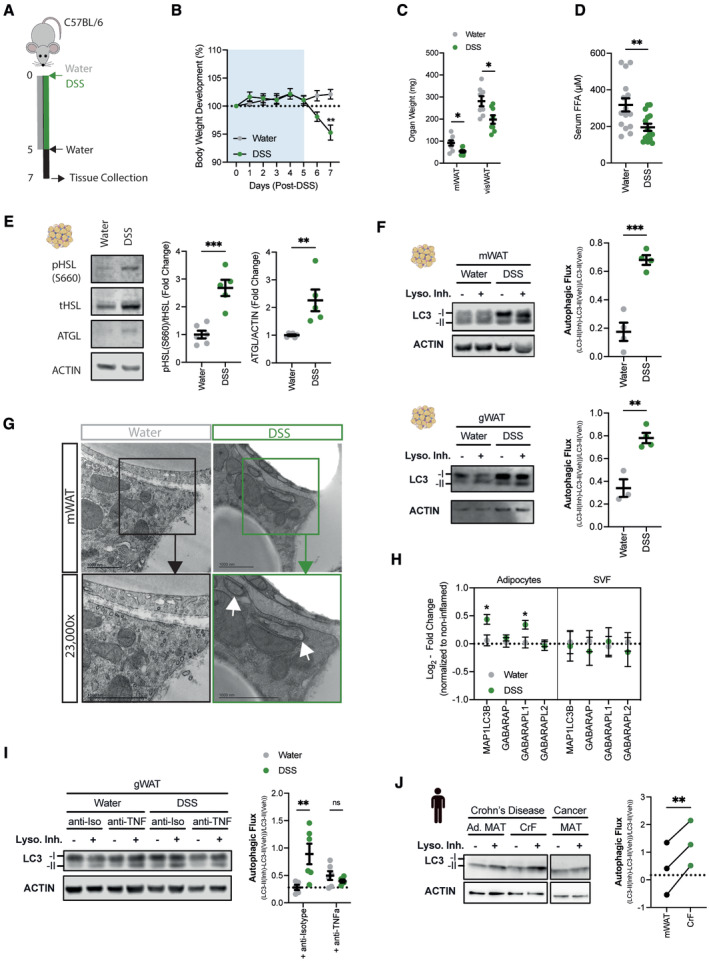
Schematic of experimental design. Sex‐matched and age‐matched wild‐type mice were treated for 5 days with 1.5–2% DSS in drinking water, before switched to water for two more days. Mice were sacrificed on day 7 post‐DSS induction.
Body weight development upon DSS treatment (n = 13/group).
Tissue weights measured in mesenteric (mWAT) and collective visceral white adipose tissue (visWAT), consisting of gonadal (gWAT), retroperitoneal and omental white adipose tissue on day 7 after start of DSS regime (n = 8/group).
Circulating serum levels of FFA during DSS‐induced colitis on day 7 (n = 15/group).
Representative immunoblot for key lipolytic enzymes HSL and ATGL protein expression and quantification (n = 5–6/group).
Immunoblot analysis of autophagic flux in mWAT (upper panel) and gWAT (lower panel) adipose tissue stimulated ex vivo with lysosomal inhibitors 100 nM Bafilomycin A1 and 20 mM NH4Cl for 4 h or DMSO (Vehicle) (n = 3–4/group).
Representative transmission electron microscopy images from mesenteric adipose tissue 7 days post DSS‐induced colitis induction. Lower panel is showing magnification of selected area. White arrows show autophagosomal structures.
Atg8 homologs expression was measured by qPCR in visceral adipocytes fraction (left panel) and stromal vascular fraction (right panel) during DSS‐induced colitis (n = 7–8/group).
Representative immunoblot for LC3‐I/‐II protein expression and quantification of autophagic flux in gWAT via ex vivo lysosomal inhibition using 100 nM Bafilomycin A1 and 20 mM NH4Cl for 4 h or DMSO (Vehicle). Mice were initially treated with 500 μg anti‐TNFα antibody or isotype control, before administrating DSS in drinking water for 5 days. Mice were sacrificed on day 7 post‐DSS induction (n = 5–6/group).
Representative immunoblot for LC3‐I/‐II and ACTIN protein expression and quantification of autophagic flux in creeping fat tissues (CrF) and adjacent mesenteric adipose tissues (Ad. MAT) of Crohn's disease patients (n = 3/group). Additionally, autophagic flux was determined in the mesenteric adipose tissue (MAT) of a colorectal cancer patient as control (dotted line).
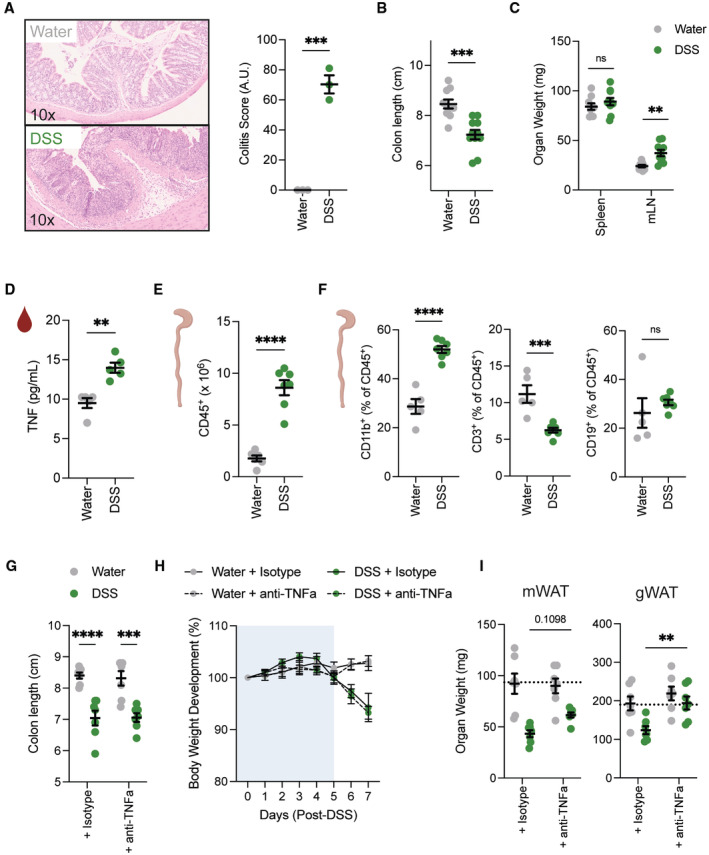
Representative H&E staining of colon histology and quantification on day 7 after DSS colitis induction (n = 3/group) from one independent experiment.
Colon length measured after 1.5–2% DSS colitis regime on day 7 (n = 10–11/group).
Spleen weight and mesenteric lymph node weight after 1.5–2% colitis regime on day 7 (n = 9–10/group).
TNFα levels in serum were measured in wild‐type mice on day 7 after water and DSS treatment (n = 5/group).
Absolute number of colonic CD45+ immune cells on day 7 post‐DSS treatment (n = 6–7/group).
Frequency of CD11b+ myeloid cells, CD3+ T cells and CD19+ B cells in colon on day 7 post‐DSS treatment (n = 5–7/group).
Colon length of mice upon DSS‐induced colitis treated with anti‐isotype or anti‐TNFα neutralizing antibody (n = 7/group).
Body weight development upon DSS‐induced colitis of mice treated either with anti‐isotype or anti‐TNFα neutralizing antibody (n = 7/group).
Tissue weight of mWAT or gWAT upon DSS‐induced colitis of mice treated either with anti‐isotype or anti‐TNFα neutralizing antibody (n = 7/group).
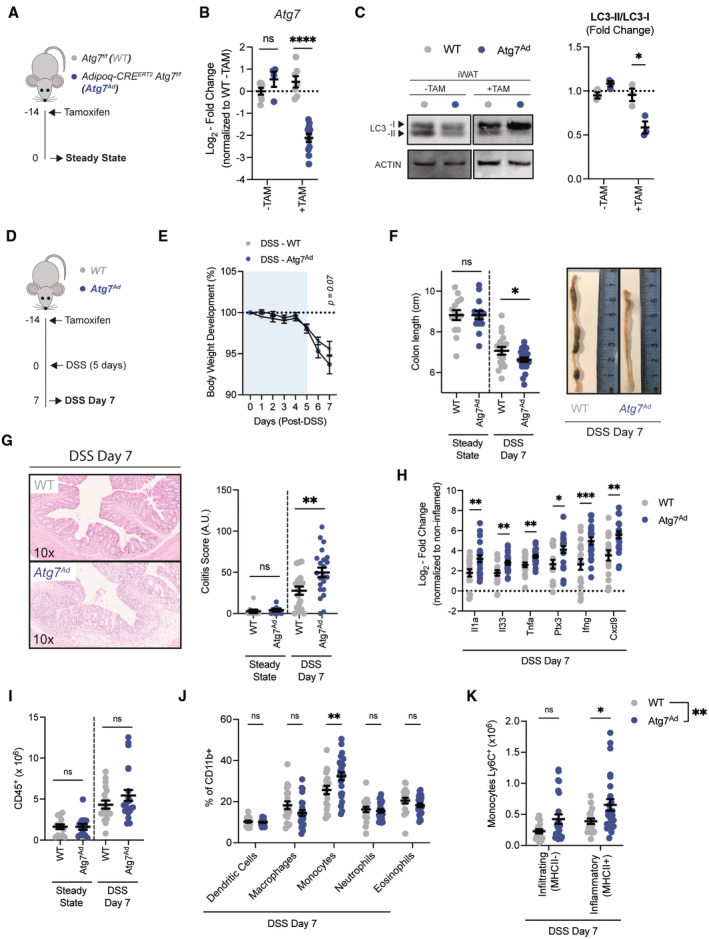
Schematic of experimental design. Sex‐matched and age‐matched littermates were treated at 8–12 weeks of age with tamoxifen for 5 consecutive days before tissues were analyzed 14 days after the last tamoxifen administration (Steady State).
Representative quantification of knock‐out efficiency measured on Atg7 transcript level by qRT‐PCR in purified primary visceral adipocyte at 2 weeks post‐tamoxifen treatment (n = 4–11/group).
Representative immunoblot for LC3‐I and LC3‐II protein expression and quantification of LC3 conversion ratio (LC3‐II/LC3‐I) (n = 3/group).
Schematic of experimental design. Sex‐matched and age‐matched littermates were treated at 8–12 weeks of age with tamoxifen for 5 consecutive days and DSS‐induced colitis was induced after a 2‐week washout phase (DSS Day 7).
Body weight development upon DSS treatment (n = 25/group).
Colon length after 2 weeks postdeletion (steady state; n = 14/group) and after DSS on day 7 (n = 18–22/group).
Representative H&E staining images (10× magnification) of colon sections and quantification of histological score at steady state (n = 9/group) and DSS colitis (n = 18–22/group).
Expression of pro‐inflammatory cytokines in colon tissues at 7 days post‐DSS induction (n = 18–22/group). Dotted line represents uninflamed controls.
Absolute number CD45+ immune cells from colons at steady state (n = 13–14/group) or at 7 days post‐DSS induction (n = 18–22/group).
Frequency of myeloid cell population in colon on day 7 post‐DSS induction (n = 18–25/group).
Absolute number of Ly6C+ monocytes discriminated by the absence or presence of MHCII for infiltrating and inflammatory monocytes, respectively (n = 18–25/group).
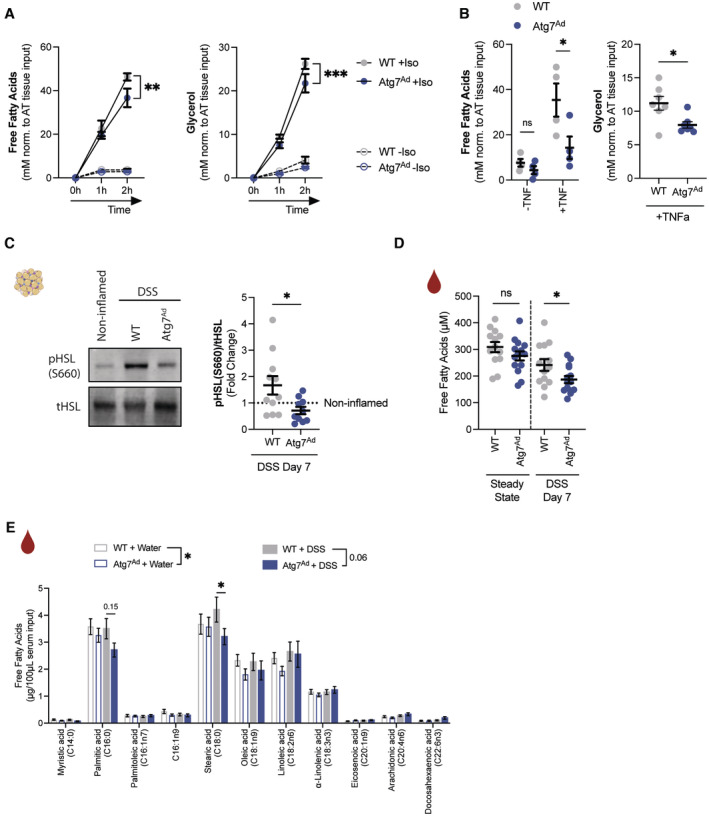
Ex vivo lipolysis measured by released free fatty acid (left, n = 4–5/group) and glycerol (right, n = 7–8/group) in culture supernatant of adipose tissue explants simulated with isoproterenol (10 μM) for 1–2 h.
Ex vivo lipolysis measured by released free fatty acid (left, n = 4/group) and glycerol (right, n = 7/group) adipose tissue explants simulated with TNFα (100 ng/ml) for 24 h before replacing with fresh medium in the absence of TNFα for 3 h.
Representative immunoblot for key lipolytic enzymes HSL, pHSL (Ser660) and quantification (n = 10–11/group).
Serum levels of circulating FFAs measured in wild‐type and Atg7‐deficient mice (n = 13–14/group).
Concentration of individual FFA species in serum in water‐treated and DSS‐treated mice as measured by FID‐GC (n = 12–14/group).
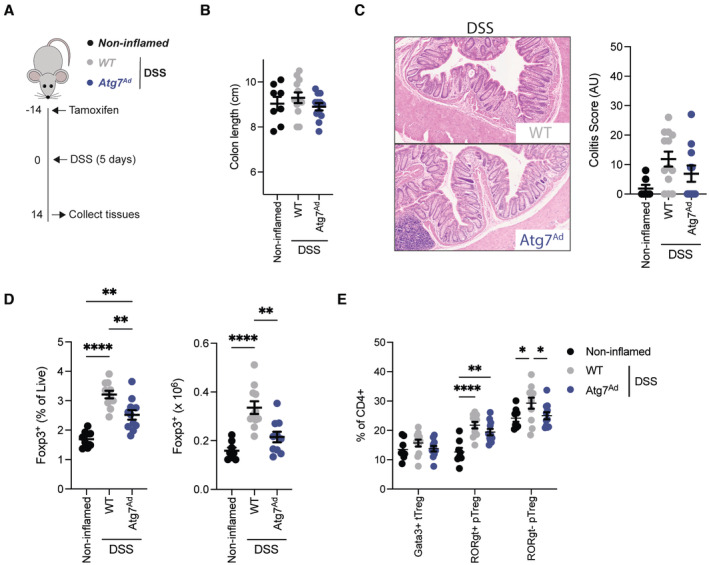
Schematic of experimental design. Sex‐matched and age‐matched littermates were treated with DSS for 5 days and mice were sacrificed 14 days after start of DSS treatment.
Colon length from noninflamed control mice (n = 8/group), adipocyte autophagy‐sufficient WT mice and adipocyte autophagy‐deficient mice (n = 12/group).
Representative H&E staining images (10× magnification) of distal colon sections and quantification of histopathological score (n = 7–13/group).
Frequency (left panel) and absolute number (right panel) of CD4+ FOXP3+ cells in the colon on day 14 post‐DSS treatment (n = 8–11/group).
Frequency of peripheral and thymic Treg (pTreg and tTreg, respectively) cell populations in colon on day 14 post‐DSS treatment (n = 8–11/group).
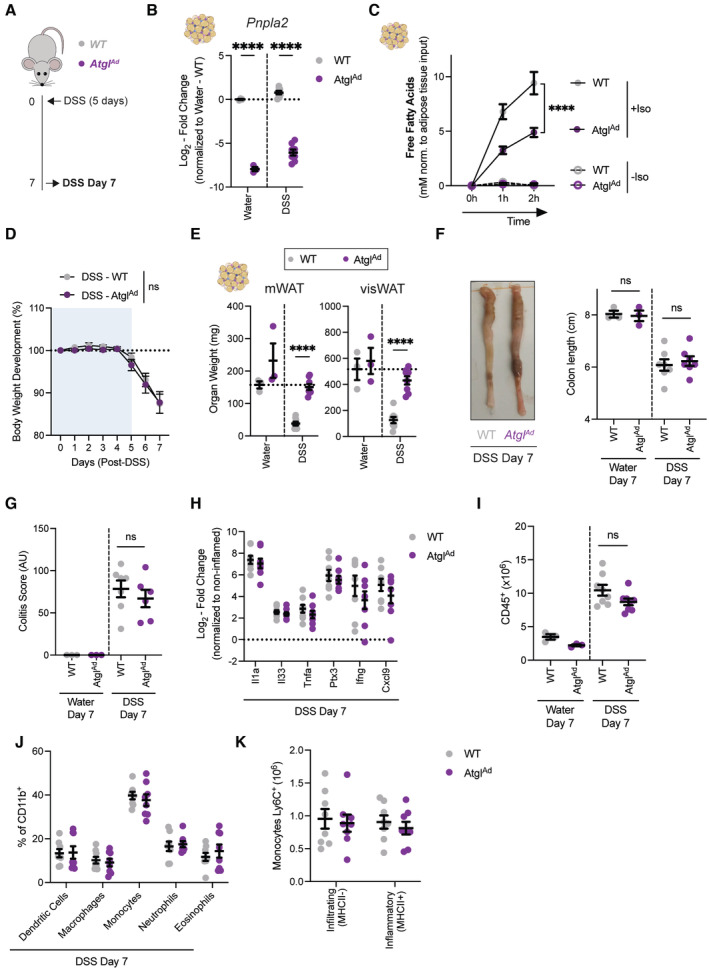
Schematic of experimental design. DSS‐induced colitis was induced in sex‐matched and age‐matched littermates.
Representative quantification of knockout efficiency measured on Atgl transcript level by qRT‐PCR in purified primary visceral adipocyte (n = 3–8/group).
Ex vivo lipolysis assays on Atg7‐deficient adipose tissue explants simulated with isoproterenol (10 μM) for 1–2 h (n = 5–6/group).
Body weight development upon DSS treatment (n = 8/group).
Tissue weights of mWAT and visWAT on day 7 after start of DSS (n = 3–8/group).
Colon length after DSS on day 7 (n = 3–8/group).
Quantification of histological score at steady state (n = 3/group) and DSS colitis (n = 6–7/group).
Expression of pro‐inflammatory cytokines in colon tissues on 7 days post‐DSS induction (n = 8/group). Dotted line represents noninflamed controls.
Absolute number CD45+ immune cells from colons on 7 days post‐DSS induction (n = 3–8/group).
Frequency of myeloid cell population in colon on day 7 post‐DSS induction (n = 8/group).
Absolute number of Ly6C+ monocytes discriminated by the absence or presence of MHCII for infiltrating and inflammatory monocytes, respectively (n = 8/group).
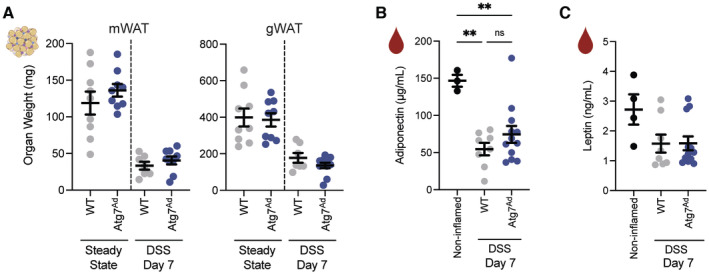
Adipose tissue mass at steady state and on day 7 post‐DSS induction (n = 7–11/group).
Circulating levels of adiponectin (n = 3–12/group).
Circulating levels of leptin (n = 4–12/group).
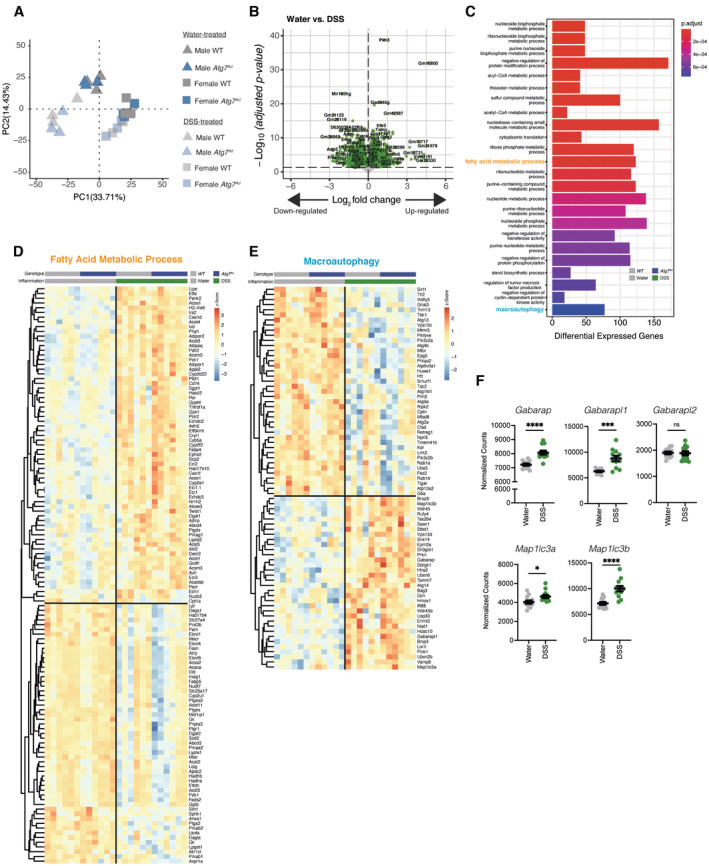
Principal component analysis of all mice revealing a strong sex effect in the overall transcriptome.
Differential gene expression assessing transcriptional changes associated with DSS‐induced inflammation after regressing effect of sex and genotypes in visceral adipocytes.
Pathway enrichment analysis of significantly differentially expressed genes in visceral adipocytes during DSS colitis.
Heatmap representing differentially expressed genes associated in fatty acid metabolism during DSS‐induced colitis in visceral adipocytes.
Heatmap representing differentially expressed genes associated with macroautophagy during DSS‐induced colitis in visceral adipocytes.
Normalized counts of Atg8 homologs in visceral adipocytes (n = 12/group).
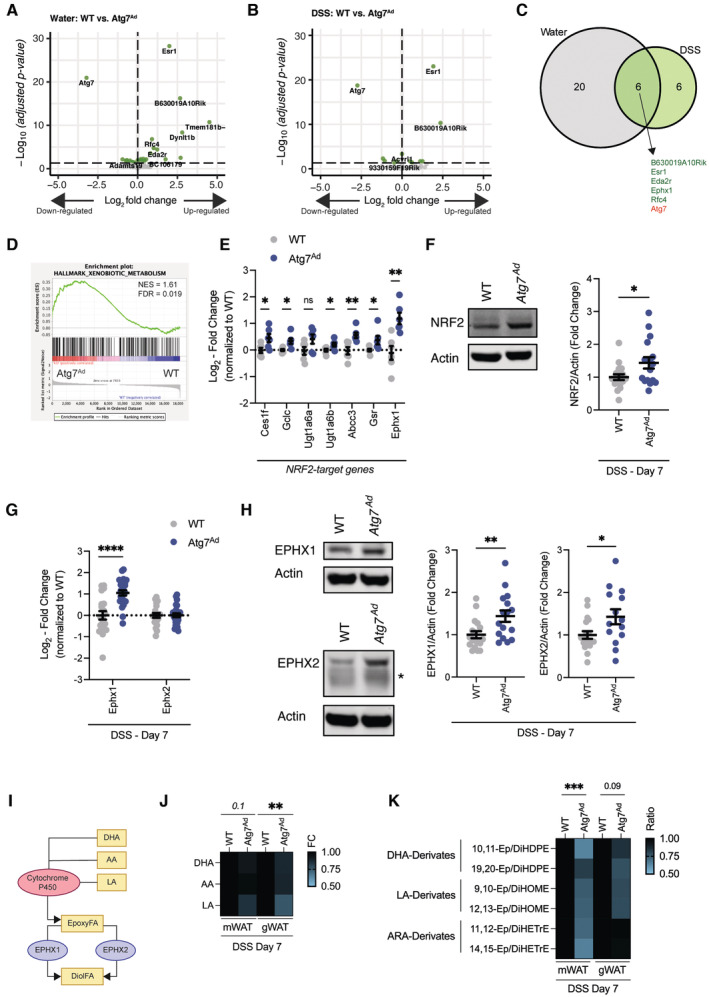
Differential gene expression in visceral adipocytes from water‐treated WT and Atg7 Ad animals 2 weeks after tamoxifen treatment.
Differential gene expression in visceral adipocytes from DSS‐treated WT and Atg7 Ad animals on day 7 post‐DSS treatment.
Venn diagram of commonly regulated genes between Atg7‐deficient and Atg7‐sufficient adipocytes during water or DSS treatment.
GSEA enrichment analysis between Atg7‐deficient and Atg7‐sufficient adipocytes during DSS treatment.
Fold change expression of NRF2‐target genes in primary visceral adipocytes on day 7 after DSS induction from normalized counts of RNAseq dataset (n = 6/group).
Representative immunoblot for NRF2 protein expression and quantification (n = 16–18/group).
Transcriptional expression of Ephx1 and Ephx2 in visceral adipocytes on day 7 after DSS induction (n = 20–25/group).
Representative immunoblot of EPHX1 and EPHX2 in gonadal adipose tissues on day 7 after DSS induction. Asterix indicating nonspecific band (n = 14–18/group).
Schematic overview of cytochrome P450‐EPHX oxylipin pathway.
Normalized fold change differences in epoxy fatty acid precursor fatty acids, docosahexaenoic acid (DHA), arachidonic acid (AA), and linoleic acid (LA) in mWAT and gWAT (n = 13–14/group).
Normalized ratios of epoxy fatty acid to their corresponding diol fatty acid pairs in mWAT and gWAT (n = 6–8/group).
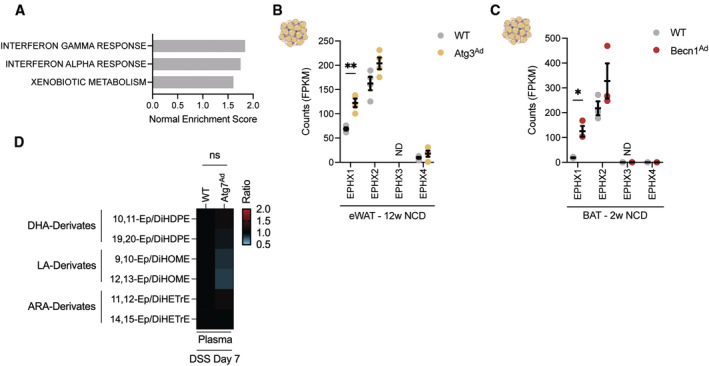
GSEA enrichment analysis between Atg7‐deficient and Atg7‐sufficient adipocytes during DSS treatment.
Fragments per kilobase of exon per million mapped fragments (FPKM) counts from bulk RNAseq dataset of Cai et al (2018) (n = 4/group)
Fragments per kilobase of exon per million mapped fragments (FPKM) counts from bulk RNAseq dataset of Son et al (2020) (n = 3/group).
Normalized ratios of epoxy fatty acid precursors to their corresponding diol fatty acids pairs in plasma (n = 8/group).
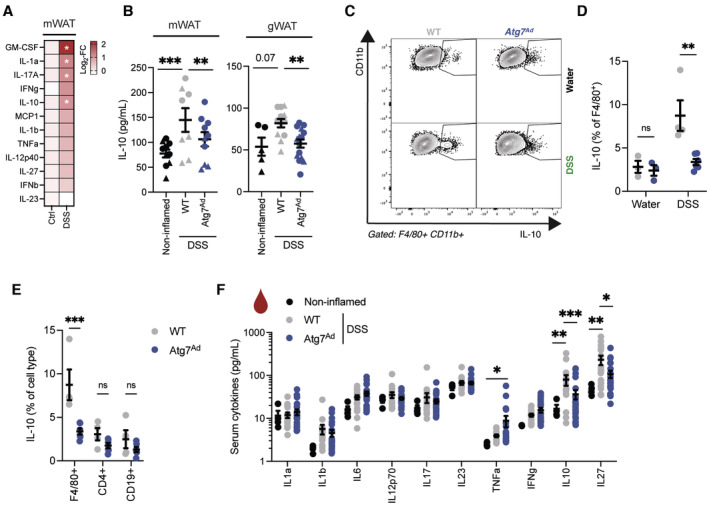
Colitis was induced in mice for 7 days and mesenteric adipose tissue explants were cultured with FBS. Cytokine secretion into the supernatant was measured after 24 h of culture (n = 4–12/group).
Colitis was induced in mice for 7 days and adipose tissues were extracted and cultured for 6 h in serum‐starved medium. Secretion of IL‐10 and from mesenteric (left panel) and gonadal adipose tissues (right panel) was measured by ELISA. Shapes identify individual experiments (n = 5–15/group).
Representative FACS plots of CD11b+ F4/80+ ATMs in visceral adipose tissue from WT and Atg7 Ad mice upon DSS‐induced colitis on day 7.
Quantification of IL‐10‐producing ATMs in visceral adipose tissue from WT and Atg7 Ad upon DSS‐induced colitis on day 7 (n = 3–6/group).
Frequencies of IL‐10‐producing immune cells in visceral adipose tissues from WT and Atg7 Ad upon DSS‐induced colitis by flow cytometry (n = 4–6/group).
Serum cytokines upon DSS‐induced colitis on day 7 postinduction (n = 17–23/group).
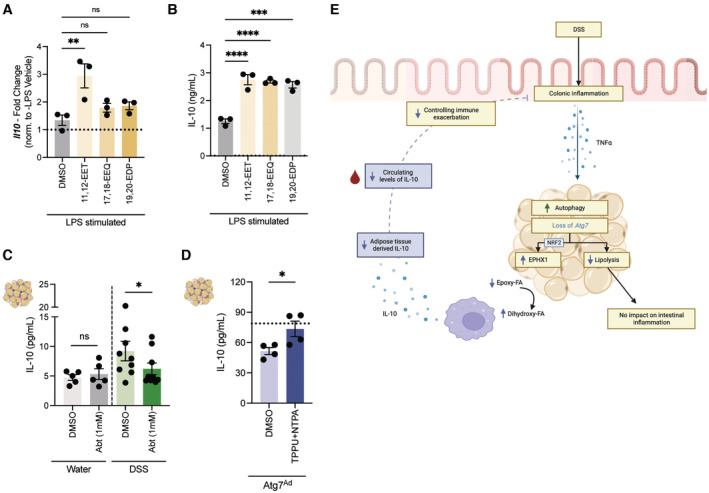
Quantification of Il10 transcript levels in RAW264.7 upon stimulation to epoxy fatty acids (n = 3/group).
Quantification of IL‐10 protein levels in the supernatant of RAW264.7 upon stimulation to epoxy fatty acids (n = 3/group).
Quantification of IL‐10 protein levels in the supernatant of ex vivo cultured adipose tissues from water‐ or DSS‐treated wild‐type mice in the absence or presence of the cytochrome P450 inhibitor 1‐ABT (n = 5–9/group).
Quantification of IL‐10 protein levels in the supernatant of ex vivo cultured adipose tissues from DSS‐induced Atg7 Ad mice in the absence or presence of the EPHX1 inhibitor NTPA and EPHX2 inhibitor TPPU (n = 4/group). Dotted line represents IL‐10 secretion from adipose tissues of DSS‐induced wild‐type mice.
Graphical summary of the anti‐inflammatory fat‐gut crosstalk during intestinal inflammation. Designed using BioRender.
References
-
- Batra A, Heimesaat MM, Bereswill S, Fischer A, Glauben R, Kunkel D, Scheffold A, Erben U, Kuhl A, Loddenkemper C et al (2012) Mesenteric fat ‐ control site for bacterial translocation in colitis? Mucosal Immunol 5: 580–591 - PubMed
-
- Bray NL, Pimentel H, Melsted P, Pachter L (2016) Near‐optimal probabilistic RNA‐seq quantification. Nat Biotechnol 34: 525–527 - PubMed
Publication types
MeSH terms
Substances
Grants and funding
- 22617/VAC_/Versus Arthritis/United Kingdom
- 893676/MCCC_/Marie Curie/United Kingdom
- 203803/Z16/Z/WT_/Wellcome Trust/United Kingdom
- 15026/LLR_/Blood Cancer UK/United Kingdom
- 212240/Z/18/Z/WT_/Wellcome Trust/United Kingdom
- 103830/Z/14/Z/WT_/Wellcome Trust/United Kingdom
- P42 ES004699/ES/NIEHS NIH HHS/United States
- R35 ES030443-01/ES/NIEHS NIH HHS/United States
- 108869/Z/15/Z/WT_/Wellcome Trust/United Kingdom
- AdG 670930/ERC_/European Research Council/International
- 17012/LLR_/Blood Cancer UK/United Kingdom
- R35 ES030443/ES/NIEHS NIH HHS/United States
- 220784/Z/20/Z/WT_/Wellcome Trust/United Kingdom
LinkOut - more resources
Full Text Sources
Molecular Biology Databases
Miscellaneous
