. 2023 Apr 17;133(8):e164596.
doi: 10.1172/JCI164596.

Lysosomal lipid peroxidation regulates tumor immunity

Affiliations

Lysosomal lipid peroxidation regulates tumor immunity

Monika Bhardwaj et al. J Clin Invest. .

Abstract

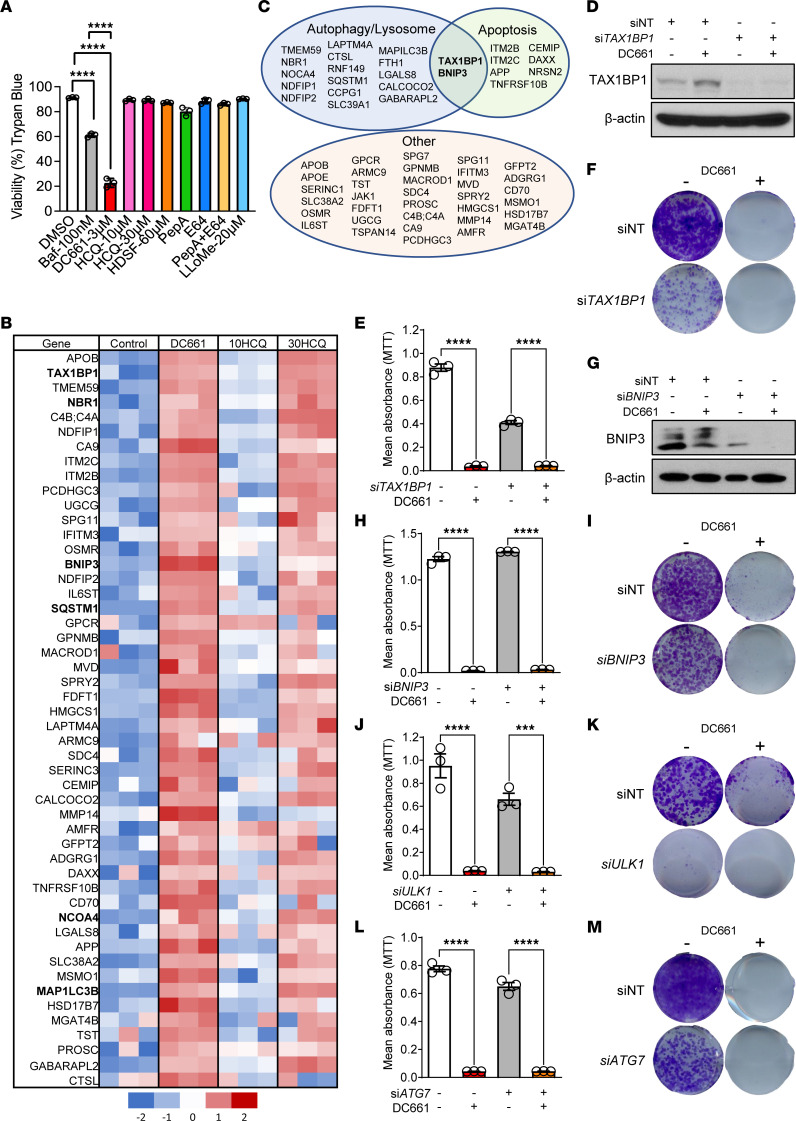
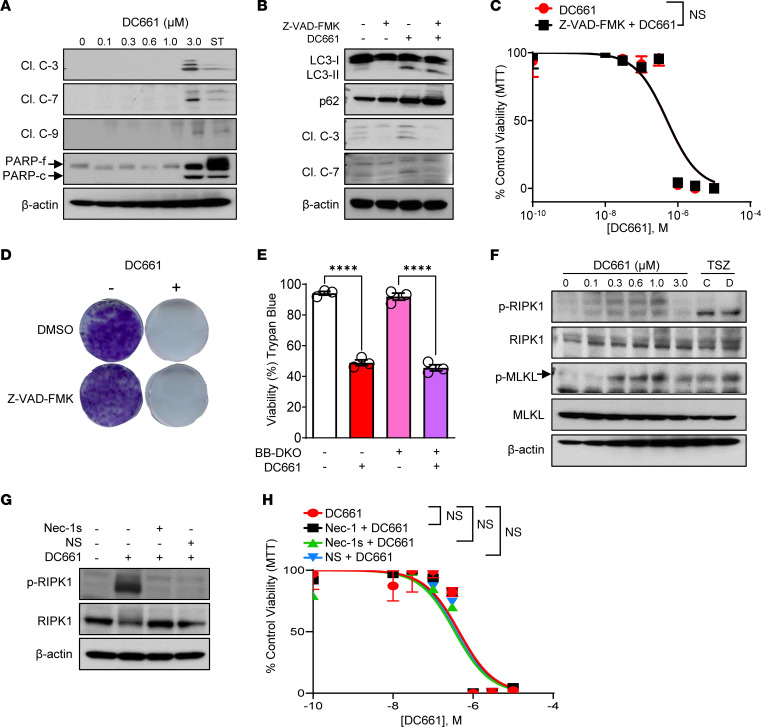
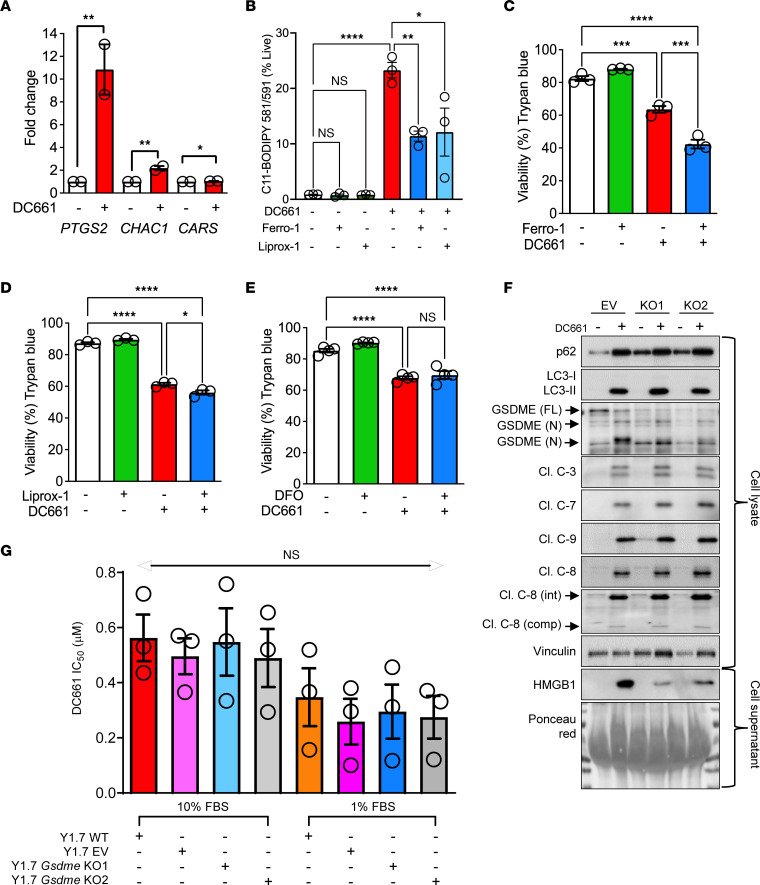
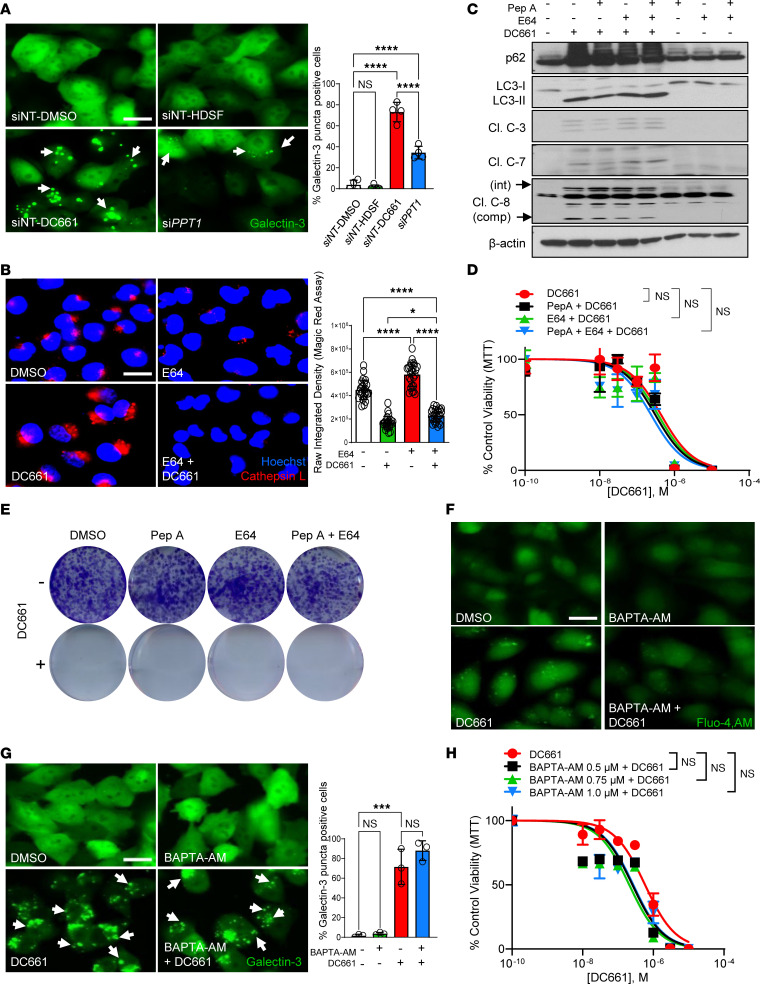
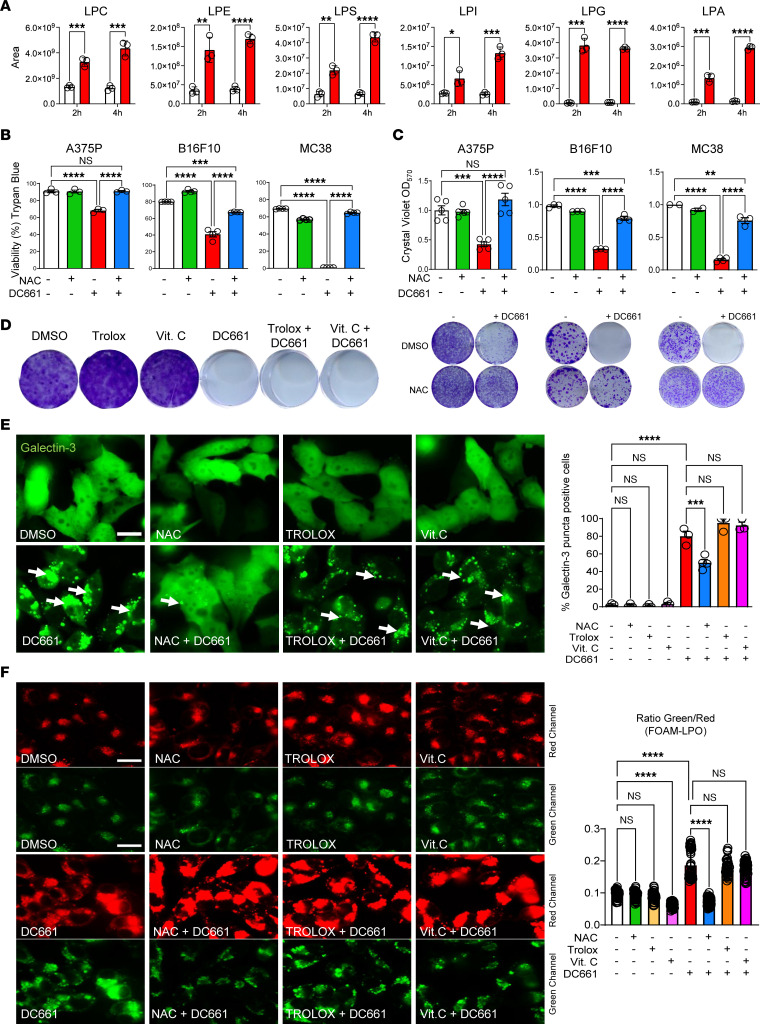
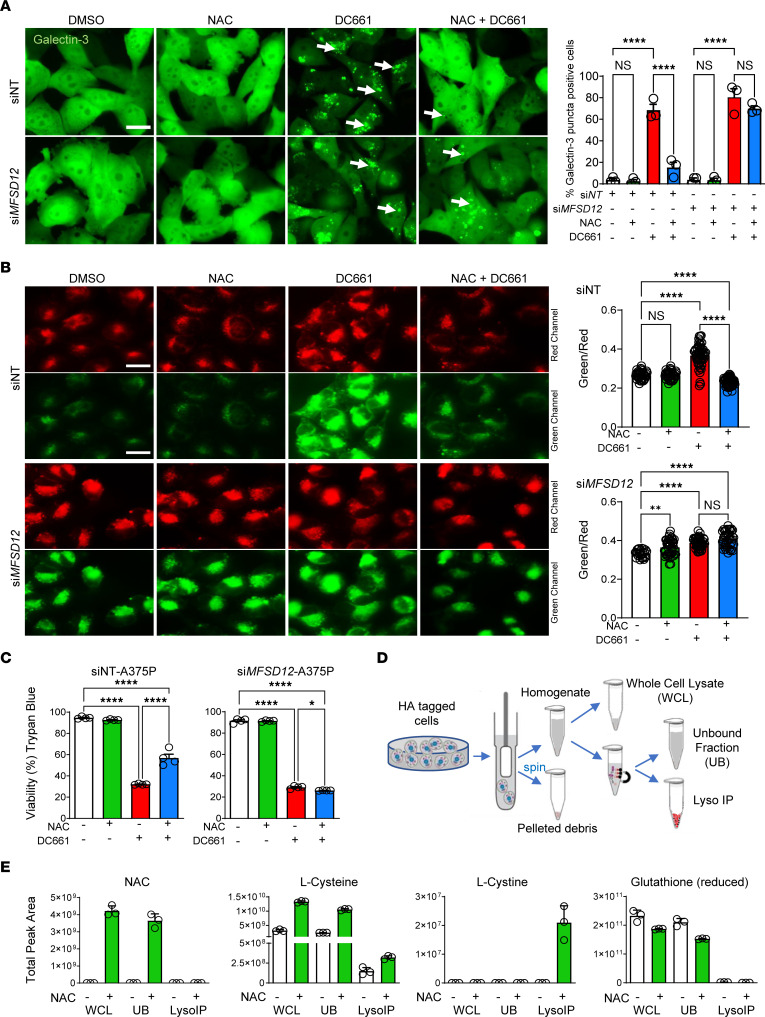
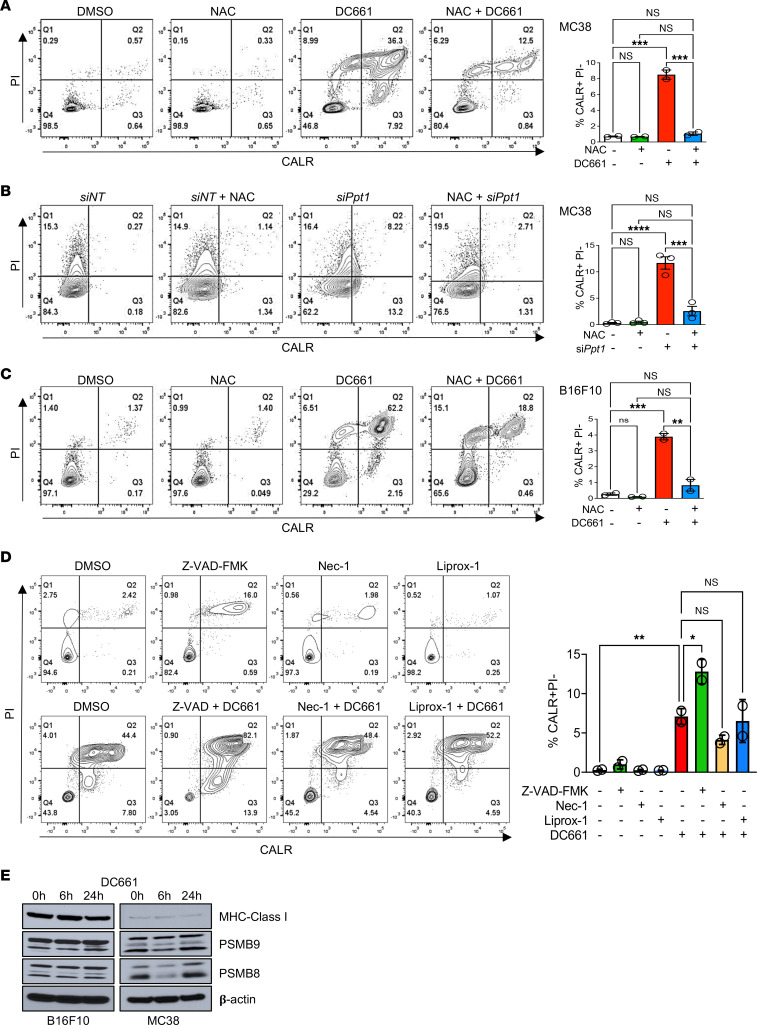
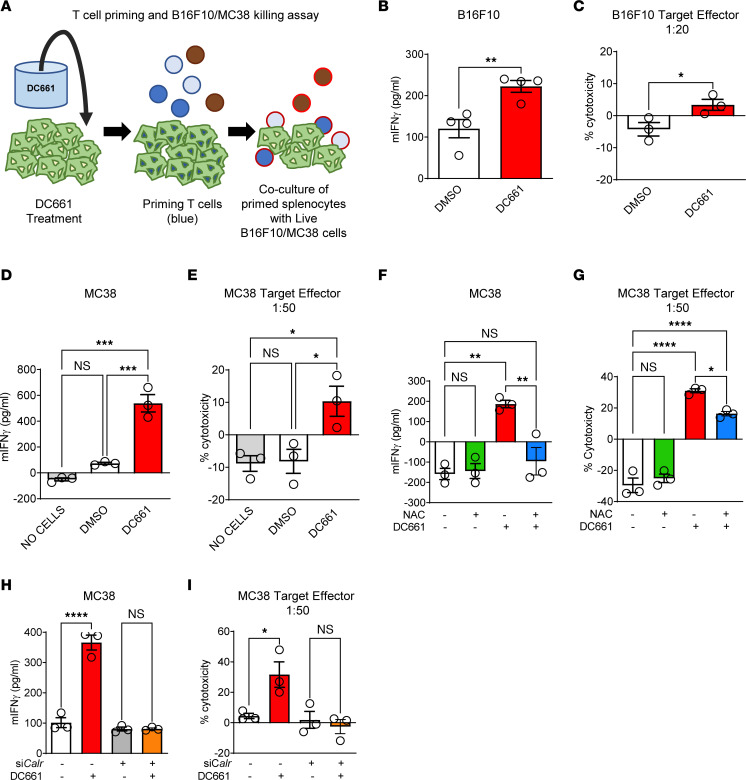
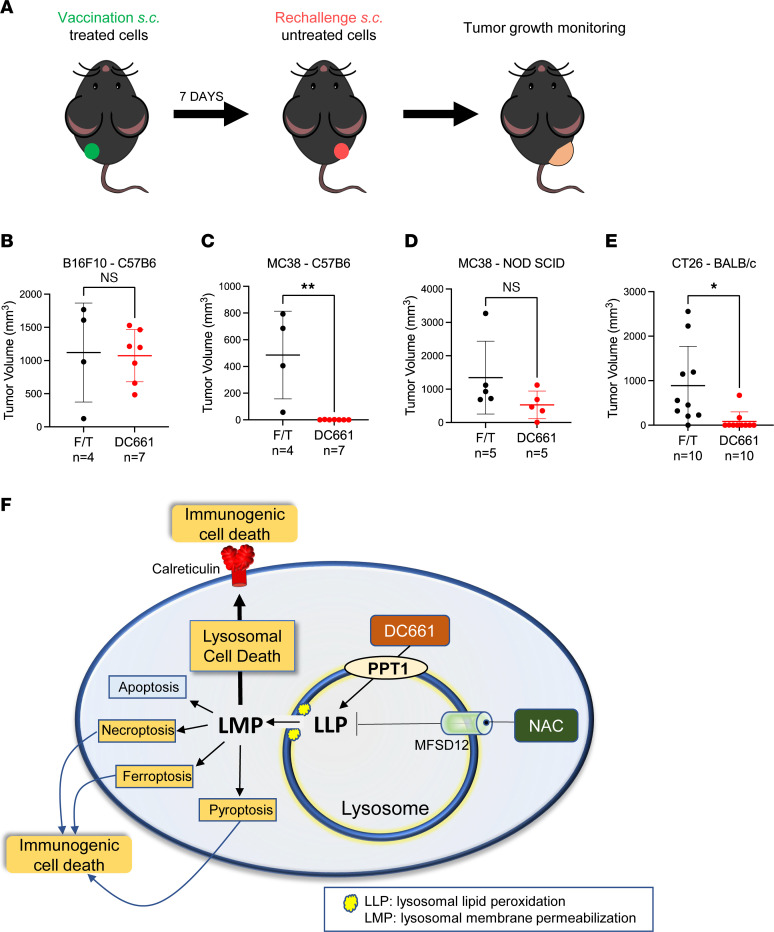
Lysosomal inhibition elicited by palmitoyl-protein thioesterase 1 (PPT1) inhibitors such as DC661 can produce cell death, but the mechanism for this is not completely understood. Programmed cell death pathways (autophagy, apoptosis, necroptosis, ferroptosis, and pyroptosis) were not required to achieve the cytotoxic effect of DC661. Inhibition of cathepsins, or iron or calcium chelation, did not rescue DC661-induced cytotoxicity. PPT1 inhibition induced lysosomal lipid peroxidation (LLP), which led to lysosomal membrane permeabilization and cell death that could be reversed by the antioxidant N-acetylcysteine (NAC) but not by other lipid peroxidation antioxidants. The lysosomal cysteine transporter MFSD12 was required for intralysosomal transport of NAC and rescue of LLP. PPT1 inhibition produced cell-intrinsic immunogenicity with surface expression of calreticulin that could only be reversed with NAC. DC661-treated cells primed naive T cells and enhanced T cell-mediated toxicity. Mice vaccinated with DC661-treated cells engendered adaptive immunity and tumor rejection in "immune hot" tumors but not in "immune cold" tumors. These findings demonstrate that LLP drives lysosomal cell death, a unique immunogenic form of cell death, pointing the way to rational combinations of immunotherapy and lysosomal inhibition that can be tested in clinical trials.

Keywords: Cancer; Cellular immune response; Lysosomes; Oncology.


Figures

Figure 1
Figure 1. Lysosomal autophagy inhibition induces significant changes in apoptosis and autophagy proteins.
(A) Trypan blue viability assay of A375P melanoma cells treated with Bafilomycin-A1 (100 nM), DC661 (3 μM), HCQ (10 or 30 μM), hexadecylsulfonyl fluoride (HDSF, 60 μM), pepstatin A (10 μg/mL), E64 (10 μg/mL), or Leu-Leu methyl ester hydrobromide (LLoMe, 20 μM) for 48 hours. (B) LC-MS/MS–based proteome analysis of A375P cells treated with DMSO, DC661 (3 μM), or HCQ (10 or 30 μM) for 24 hours. Heatmap of the top 50 elevated proteins in DC661 verses control. Autophagy, apoptosis (names shown in bold), or other signaling pathway proteins significantly elevated (FDR, <5% and fold change, ≥2) in cells treated with 3 μM DC661, 10 μM HCQ, or 30 μM HCQ compared with those treated with vehicle control. (C) The autophagy cargo receptor proteins that have proapoptotic effects in cancer cells are shown in a Venn diagram. (DM) A375P cells were treated with nontarget siRNA (siNT) or siRNA against TAX1BP1, BNIP3, ULK1, or ATG7 for 48 hours, followed by treatment with either DMSO or DC661 (3 μM) for 24 hours. (D and G) Immunoblotting of TAX1BP1 or BNIP3 and β-actin in the whole-cell lysates of A375P cells. (E and H) Seventy-two-hour MTT assay with 3 μM DC661 or (F and I) 7-day colony formation assay with 0.3 μM DC661 in A375P cells treated with the indicated siRNA. (J and L) Seventy-two-hour MTT assay with 3 μM DC661 and (K and M) 7-day colony formation assay with 0.3 μM DC661 in A375P cells treated with the indicated siRNA. All viability assays were performed in triplicate. ****P ≤ 0.0001. ANOVA test was used when more than 2 groups were compared. See also Supplemental Figure 1 and Supplemental Figure 2, A–C.
Figure 2
Figure 2. DC661-induced apoptosis and necroptosis.
(A) Immunoblots of cleaved caspase-3 (Cl. C-3), caspase-7 (Cl. C-7), caspase-9 (Cl. C-9), PARP and β-actin from A375P cell lysates treated with indicated concentrations of DC661 for 24 hours. Staurosporine (ST; 20 ng/mL) was used as a positive control for apoptosis. (B) Immunoblots of lysates from A375P cells treated with 3 μM DC661, 80 μM pan-caspase inhibitor Z-VAD-FMK, or both for 24 hours. (C) Seventy-two-hour MTT assay plot with increasing concentrations of DC661 (0.01 to 10 μM), with and without Z-VAD-FMK 80 μM. (D) Seven-day colony formation assay in A375P cells treated with 0.3 μM DC661, 8 μM Z-VAD-FMK, or their combinations. (E) Trypan blue viability assay with and without 3 μM DC661 for 24 hours in FL5.12 and IL-3–dependent Bax−/−Bak−/− (BB-DKO) primary bone marrow cells. (F) Immunoblots of RIP1, MLKL, their phosphorylated forms, and β-actin in the lysates of A375P cells treated with DC661 for 24 hours. Necroptosis conventional TSZ (TNF-α, Smac mimetic [SM-164], and Z-VAD-FMK) treatment conditions used included the following: C, pretreatment with Z-VAD-FMK (25 μM, 1 hour), followed by SM-164 (2 μM, 1 hour) and TNF-α (20 ng/mL, 22 hours); D, pretreatment with Z-VAD-FMK (80 μM, 1 hour), followed by SM-164 (100 nM, 1 hour) and TNF-α (20 ng/mL, 22 hours). (G) Immunoblots of necroptosis proteins in lysates of A375P cells treated with necroptosis inhibitors necrostatin-1s (Nec-1s, 50 μM) and necrosulfonamide (NS, 2.5 μM) with DC661 1 μM for 24 hours. (H) Seventy-two-hour MTT assay plot with DC661 (0.01 to 10 μM), with and without necrostatin-1 (Nec-1, 50 μM), 50 μM Nec-1s, and 2.5 μM NS in A375P cells. All viability assays were performed in triplicate. ****P ≤ 0.0001; ns, nonsignificant. Two-tailed unpaired t test between 2 groups (C). ANOVA test was used when more than 2 groups were compared (E and H). See also Supplemental Figure 2, D–G.
Figure 3
Figure 3. DC661-induced ferroptosis and pyroptosis.
(A) qRT-PCR showed the fold change increase in the transcriptional expression of PTGS2, CHAC, and CARS in A375P cells treated with 3 μM DC661 for 24 hours. (B) A375P cells treated for 24 hours with DC661 (3 μM), liproxstatin-1 (Liprox-1, 2 μM), or ferrostatin-1 (Ferro-1, 10 μM). Lipid peroxidation measured by C-11 BODIPY using flow cytometry. Erastin was used as positive control (see Supplemental Figure 3A). (CE) Trypan blue cell viability assay in A375P cells treated with 3 μM DC661, with and without ferroptosis inhibitors (C) ferrostatin-1 (Ferro-1, 10 μM), (D) liproxstatin-1 (Liprox-1, 2 μM), and (E) iron chelator deferoxamine (DFO, 5 μM). (F) Western blots were probed for pyroptosis and autophagy proteins in the whole-cell lysates and HMGB1 release in cell supernatant of human WM35 empty vector (EV) and gasdermin-E–KO (KO1 and KO2) cells treated with DC661 1 μM for 48 hours. (G) Bar graph showing average DC661 IC50 values ± SEM of MTT assays in both 10% and 1% FBS conditions in mouse YUMM1.7 WT, EV, and gasdermin-E–KO (Gsdme-KO) cells from 3 independent experiments. Statistical analysis for I was applied on ΔCT values. *P ≤ 0.05; **P ≤ 0.01; ***P ≤ 0.001; ****P ≤ 0.0001. Two-tailed unpaired t test between 2 groups (A). ANOVA test was used when more than 2 groups were compared (BE and G). See also Supplemental Figures 3–5. All viability assays were performed in triplicate.
Figure 4
Figure 4. Cathepsin inhibition or calcium chelation does not prevent DC661-induced cell death.
(A) A375P-galectin-3-EGFP cells were given nontarget siRNA (siNT) or PPT1 siRNA (siPPT1) for 48 hours, followed by treatment with DMSO, 60 μM HDSF, or 3 μM DC661 for 6 hours. (B) Cathepsin-L enzyme activity (red) and quantification in A375P cells treated with 3 μM DC661, 10 μg/mL cysteine protease inhibitor E64, or the combination of both for 6 hours. (C) Immunoblots for indicated proteins in A375P cell lysates treated with pepstatin A (PepA, 10 μg/mL), 10 μg/mL E64, and PepA+E64 with or without 3 μM DC661 for 24 hours. (D) Seventy-two-hour MTT assay plot with increasing concentrations of DC661 (0.01 to 10 μM), with and without PepA, E64, and PepA+E64 in A375P cells. (E) Seven-day colony formation assay in A375P cells treated with 10 μg/mL PepA, 10 μg/mL E64, and PepA+E64 with or without 0.3 μM DC661. (F and G) A375P or A375P-galectin-3-EGFP cells were treated with 3 μM DC661, 1 μM calcium chelator BAPTA-AM, or both for 24 hours. (F) Fluorescence images of A375P cells stained with Fluo-4, AM, to detect calcium release. (G) A375P-galectin-3-EGFP cells showing galectin-3 puncta (white arrows) and quantification after treatment with DC661, BAPTA-AM, or both. (H) Seventy-two-hour MTT assay plot with increasing concentrations of DC661 (0.01 to 10 μM), with and without indicated concentrations of BAPTA-AM in A375P cells. Scale bar: 20 μm. *P ≤ 0.05; ***P ≤ 0.001; ****P ≤ 0.0001. ANOVA test was used when more than 2 groups were compared. All viability experiments were done in triplicate.
Figure 5
Figure 5. N-acetyl cysteine prevents DC661-induced cell death.
(A) LC-MS/MS lipidome analysis of A375P cells treated with DMSO (white) or 3 μM DC661 (red) for 2 or 4 hours. Mean ± SD of significantly elevated lysophospholipid classes by unpaired t test. LPC, lysophosphatidyl choline; LPE, lysophosphatidyl ethanolamine; LPS, lysophosphatidyl serine; LPI, lysophosphatidyl inositol; LPG, lysophosphatidyl glycerol; LPA, lysophosphatidyl acid. (B and C) A375P, B16F10, and MC38 cells were treated with 10 mM N-acetyl cysteine (NAC), 3 μM DC661, or both for 72 hours. (B) Trypan blue viability assay after 72 hours of treatment. (C and D) Seven-day colony formation assay in A375P cells treated with 0.1 μM DC661, 1 mM NAC, 100 μM Trolox, and 100 μM vitamin C. (E and F) A375P-galectin-3-GFP cells or A375P cells were treated with 3 μM DC661, 10 mM NAC, 100 μM Trolox, and 100 μM vitamin C for 24 hours or 6 hours. (E) A375P-galectin-3-GFP cells showing galectin-3 (Gal3) puncta (white arrows) and quantification. (F) Fluorescence images of A375P cells stained with FOAM-LPO (1 μM, 5 min) to detect LLP. Scale bar: 20 μm. *P ≤ 0.05; **P ≤ 0.01; ***P ≤ 0.001; ****P ≤ 0.0001. ANOVA test was used when more than 2 groups were compared. All viability experiments were done in triplicate.
Figure 6
Figure 6. NAC reverses LLP in an MFSD12-dependent manner.
(AC) A375P-galectin-3-GFP cells or A375P cells were treated with MFSD12 siRNA or nontarget siRNA (siNT) for 48 hours, followed by treatment with DMSO, 3 μM DC661, or 10 mM NAC for 24 hours, 6 hours, or 72 hours. (A) Quantification of galectin-3 puncta in A375P-galectin-3-GFP cells after 24 hours. Galectin-3–positive puncta are shown with white arrows. (B) Fluorescence images of A375P cells stained with FOAM-LPO (1 μM, 5 min) to detect LLP after 6 hours. (C) Trypan blue cell viability in A375P cells after 72 hours of treatment with DC661, NAC, or both. (D) Schematic of lysosomal pull down using Lyso-IP. (E) Relative quantification of metabolites in whole-cell lysates (WCL), lysosomal IP unbound fractions (UB), and lysosomal IP bound samples (Lyso IP) with NAC or vehicle treatment after 24 hours. Total peak area accounts for metabolite abundance in the entire sample. Quantifications are depicted as mean ± SD from 3 biological replicates per condition. Scale bar: 20 μm. *P ≤ 0.05; **P ≤ 0.01; ****P ≤ 0.0001. ANOVA test was used when more than 2 groups were compared.
Figure 7
Figure 7. N-acetyl cysteine prevents DC661-induced calreticulin surface expression.
(AD) Flow cytometry for calreticulin (CALR) and propidium iodide (PI), with quantification of 2–3 independent experiments. (A) Murine MC38 cells were treated with 3 μM DC661, 10 mM N-acetyl cysteine (NAC), or both for 24 hours. (B) MC38 cells were treated with siPpt11 or siNT for 48 hours in the presence or absence of 10 mM NAC for 24 hours. (C) Murine B16F10 cells were treated with 3 μM DC661, 10 mM NAC, or both for 24 hours. (D) MC38 cells were treated with cell death inhibitors (40 μM Z-VAD-FMK, 50 μM Nec-1, 2 μM Liprox-1) with and without 3 μM DC661 for 24 hours. (E) Immunoblots of MHC class I, PSMB9, PSMB8, and β-actin in the lysates of murine B16F10 and MC38 cells treated with indicated concentrations of DC661 for 6 and 24 hours. *P ≤ 0.05; **P ≤ 0.01; ***P ≤ 0.001; ****P ≤ 0.0001. ANOVA test was used when more than 2 groups were compared.
Figure 8
Figure 8. DC661-induced calreticulin surface expression primes T cells against tumor cells.
(A) Schema of experimental setup of splenocyte priming and coculture experiments to measure cytotoxicity in vitro by DMSO or DC661 treatment for 24 hours. (B and D) Measurement of splenocyte-secreted IFN-γ upon coculturing syngeneic splenocytes with B16F10 or MC38 cells treated with DMSO or DC661. (C and E) Measurement of percentage cytotoxicity (LDH release assay) of B16F10 or MC38 cells by DMSO- or DC661-primed splenocytes. (F and G) MC38 cells were treated with 3 μM DC661, 10 mM NAC, or both for 24 hours and then used to prime splenocytes that were used for the cytotoxicity assay. IFN-γ and percentage cytotoxicity are shown. (H and I) For calreticulin (Calr) genetic inhibition, MC38 cells were treated with calreticulin/calregulin (Calr) siRNA or nontarget siRNA (siNT) for 48 hours, followed by treatment with either DMSO or 3 μM DC661 for 24 hours. These cells were then applied to the T cell priming and cytotoxicity assay. Measurement of IFN-γ and percentage cytotoxicity are shown. All experiments were done in triplicate. *P ≤ 0.05; **P ≤ 0.01; ***P ≤ 0.001; ****P ≤ 0.0001. ANOVA test was used when more than 2 groups were compared.
Figure 9
Figure 9. Inoculation of DC661-treated cells produces tumor rejection in specific contexts.
(A) Schema of tumor vaccination model. (BE) Cells were treated with DMSO or DC661 for 36 hours and then s.c. injected (1.8 × 10⁵ B16F10 cells, 1.5 × 10⁶ MC38 cells, or 3.0 × 10⁶ CT26 cells per mouse) into the left flank of immunocompetent syngeneic C57BL/6J, BALB/c mice, or immunodeficient NOD/SCID mice. Freeze-thawed (F/T) DMSO-treated cells were used as control. One week later, all mice were rechallenged and s.c. injected with live untreated cells (3 × 10⁴ B16F10 cells, 2 × 10⁵ MC38 cells, or 5 × 10⁵ CT26 cells per mouse) into the right flank of corresponding vaccinated mice. Dot plot of final tumor volumes for each individual mouse in each treatment group shown. n = 4–10 per group. (F) Illustration of DC661-induced lysosomal lipid peroxidation and immunogenic cell death.

Comment in

References

    1. Zeh HJ, et al. A randomized phase II preoperative study of autophagy inhibition with high-dose hydroxychloroquine and gemcitabine/Nab-paclitaxel in pancreatic cancer patients. Clin Cancer Res. 2020;26(13):3126–3134. doi: 10.1158/1078-0432.CCR-19-4042. - DOI - PMC - PubMed
    1. Rebecca VW, et al. PPT1 promotes tumor growth and is the molecular target of chloroquine derivatives in cancer. Cancer Discov. 2019;9(2):220–229. doi: 10.1158/2159-8290.CD-18-0706. - DOI - PMC - PubMed
    1. Brun S, et al. GNS561, a new autophagy inhibitor active against cancer stem cells in hepatocellular carcinoma and hepatic metastasis from colorectal cancer. J Cancer. 2021;12(18):5432–5438. doi: 10.7150/jca.58533. - DOI - PMC - PubMed
    1. Brun S, et al. GNS561, a clinical-stage PPT1 inhibitor, is efficient against hepatocellular carcinoma via modulation of lysosomal functions. Autophagy. 2022;18(3):678–694. doi: 10.1080/15548627.2021.1988357. - DOI - PMC - PubMed
    1. Oberle C, et al. Lysosomal membrane permeabilization and cathepsin release is a Bax/Bak-dependent, amplifying event of apoptosis in fibroblasts and monocytes. Cell Death Differ. 2010;17(7):1167–1178. doi: 10.1038/cdd.2009.214. - DOI - PubMed

Publication types