. 2023 Mar 22;8(6):e163763.
doi: 10.1172/jci.insight.163763.

EGFR inhibition leads to enhanced desmosome assembly and cardiomyocyte cohesion via ROCK activation

Affiliations

EGFR inhibition leads to enhanced desmosome assembly and cardiomyocyte cohesion via ROCK activation

Maria Shoykhet et al. JCI Insight. .

Abstract

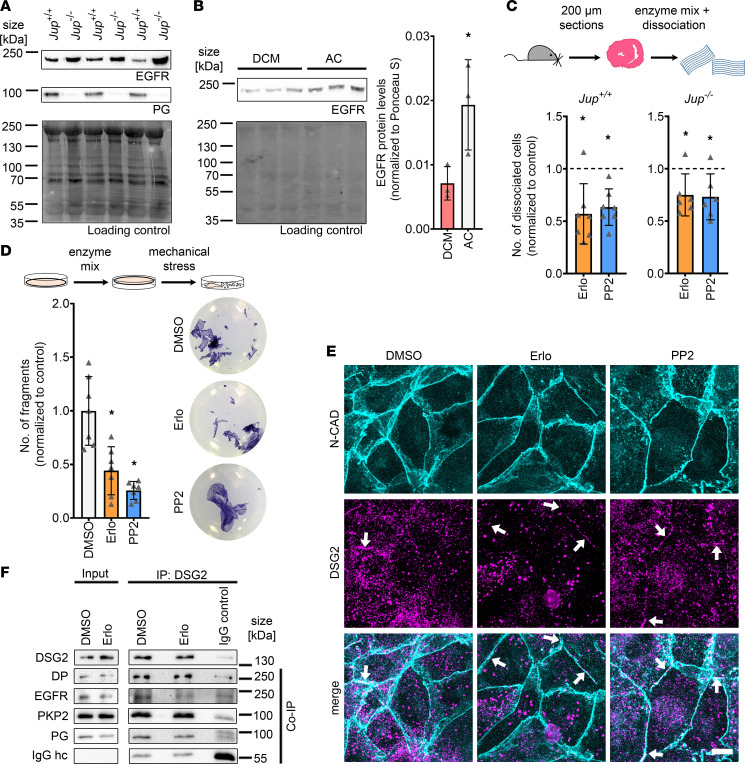
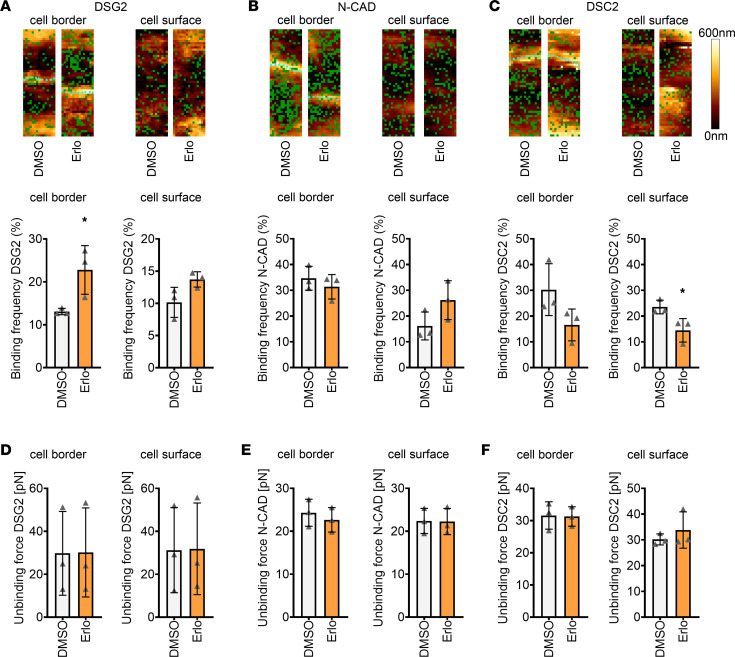
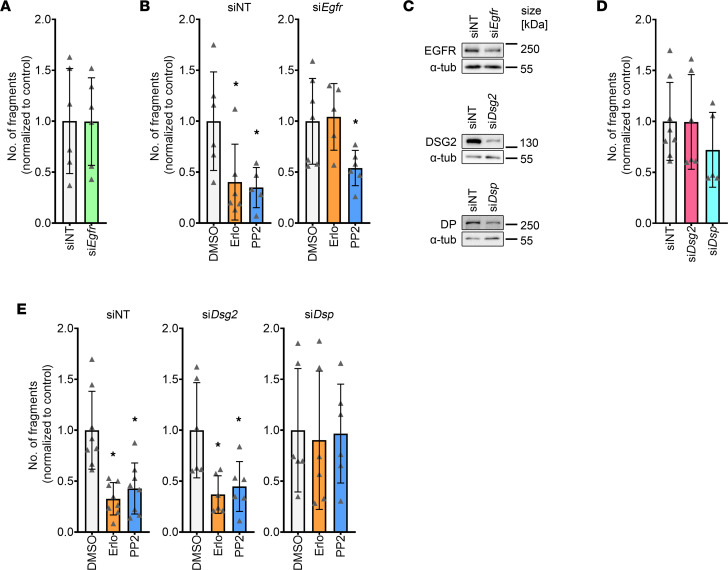
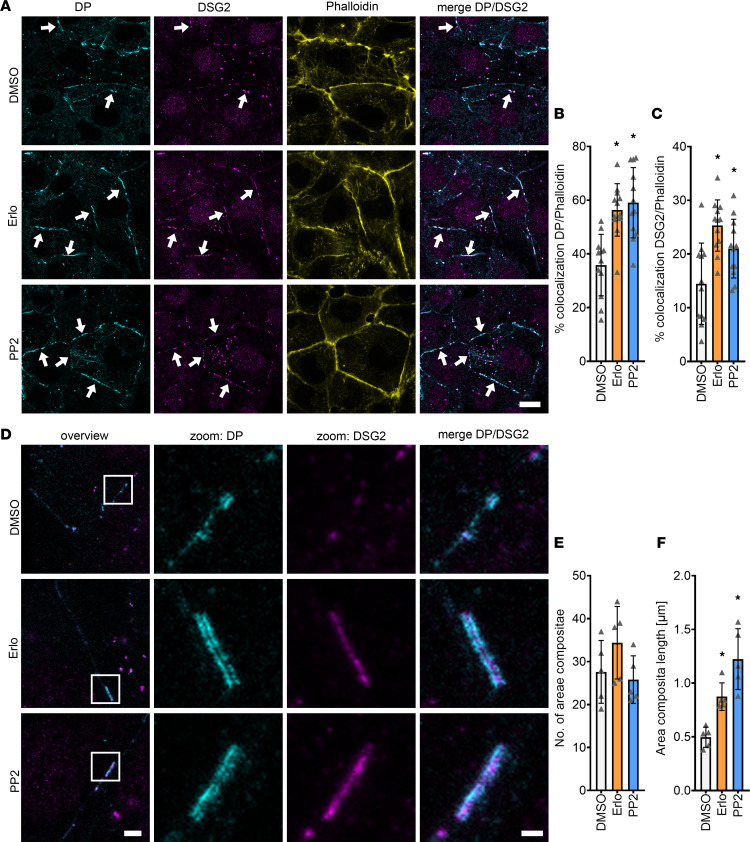
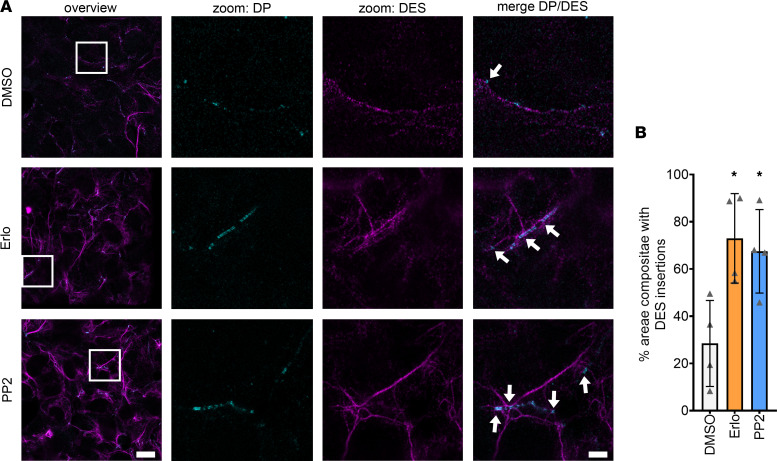
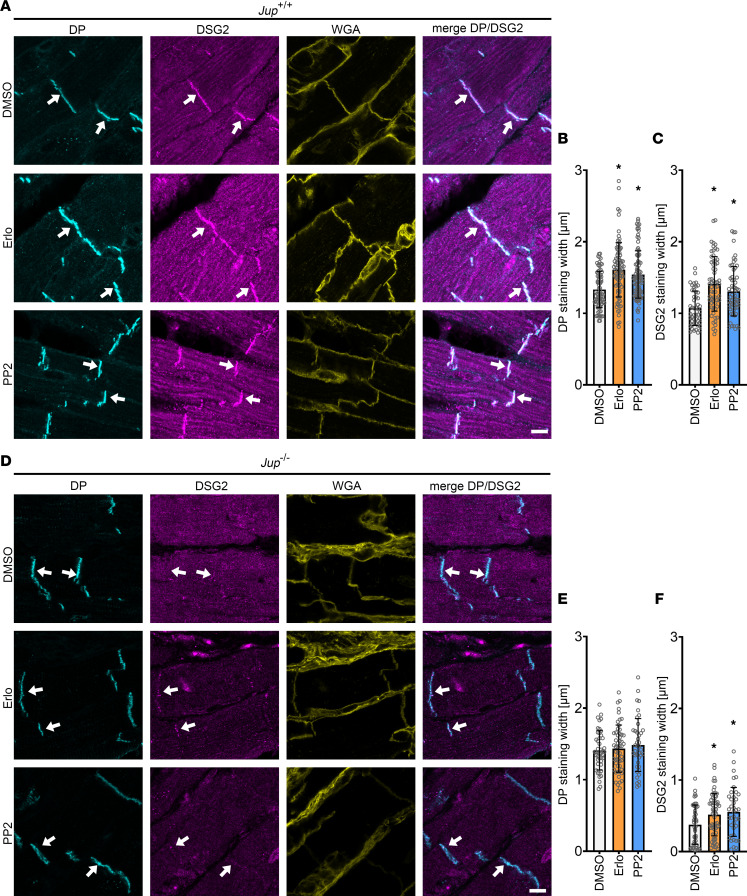
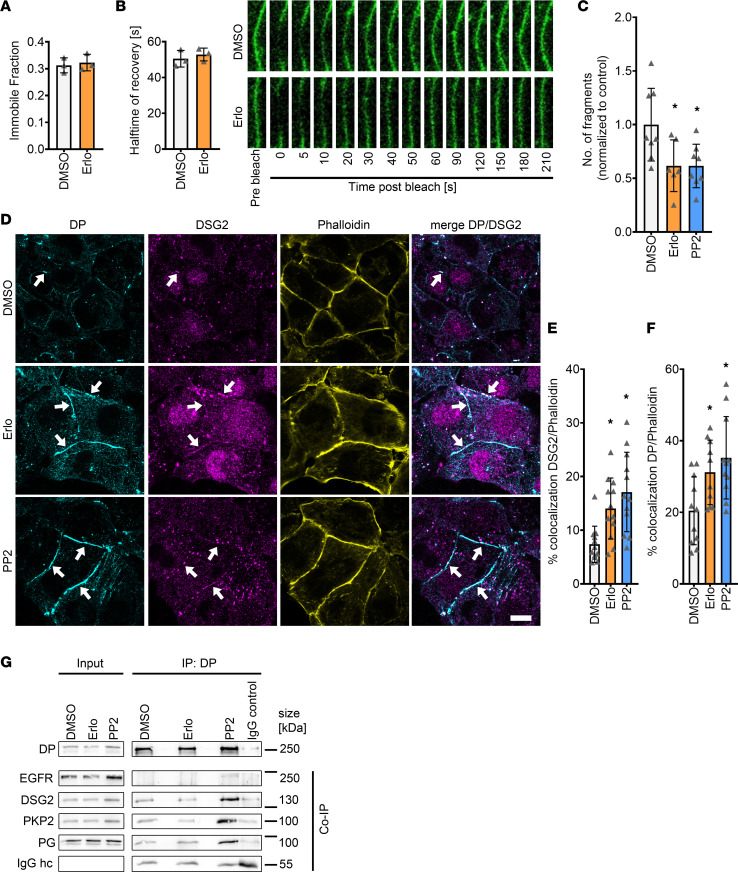
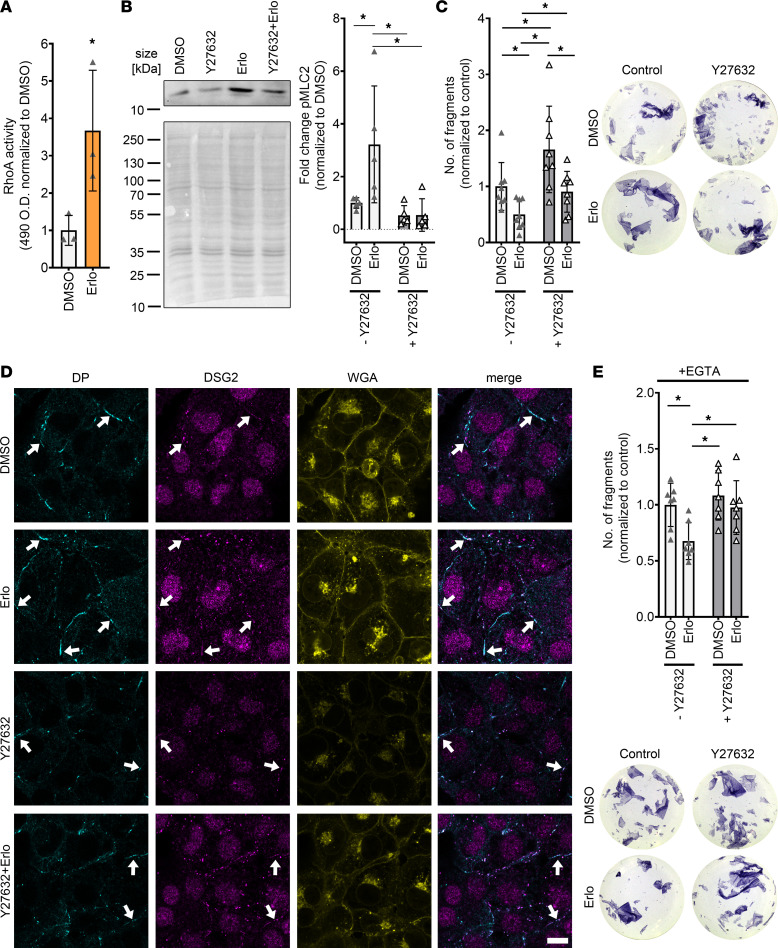
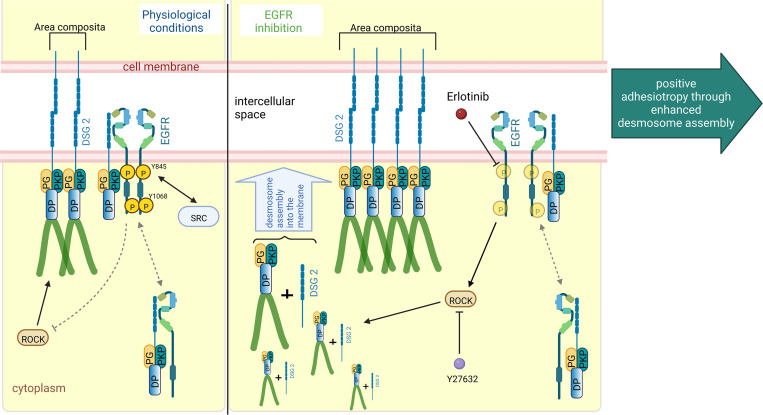
Arrhythmogenic cardiomyopathy (AC) is a familial heart disease partly caused by impaired desmosome turnover. Thus, stabilization of desmosome integrity may provide new treatment options. Desmosomes, apart from cellular cohesion, provide the structural framework of a signaling hub. Here, we investigated the role of the epidermal growth factor receptor (EGFR) in cardiomyocyte cohesion. We inhibited EGFR under physiological and pathophysiological conditions using the murine plakoglobin-KO AC model, in which EGFR was upregulated. EGFR inhibition enhanced cardiomyocyte cohesion. Immunoprecipitation showed an interaction of EGFR and desmoglein 2 (DSG2). Immunostaining and atomic force microscopy (AFM) revealed enhanced DSG2 localization and binding at cell borders upon EGFR inhibition. Enhanced area composita length and desmosome assembly were observed upon EGFR inhibition, confirmed by enhanced DSG2 and desmoplakin (DP) recruitment to cell borders. PamGene Kinase assay performed in HL-1 cardiomyocytes treated with erlotinib, an EGFR inhibitor, revealed upregulation of Rho-associated protein kinase (ROCK). Erlotinib-mediated desmosome assembly and cardiomyocyte cohesion were abolished upon ROCK inhibition. Thus, inhibiting EGFR and, thereby, stabilizing desmosome integrity via ROCK might provide treatment options for AC.

Keywords: Cardiology; Cardiovascular disease; Cell Biology; Cell migration/adhesion.


Conflict of interest statement

Conflict of interest: The authors have declared that no conflict of interest exists.

Figures

Figure 1
Figure 1. EGFR or SRC inhibition induces positive adhesiotropy in cardiomyocytes.
(A) Representative Western blot showing protein expression of EGFR and PG in Jup+/+ and Jup–/– mice, NoStain Protein Labeling Reagent was used as loading control. n = 6. (B) Western blot showing expression of EGFR in patients with AC and dilated cardiomyopathy (DCM). Ponceau S staining was used as a loading control. *P ≤ 0.05 unpaired Student’s t test, n = 3 patients per group. (C) Dispase-based dissociation assay in murine cardiac slice cultures obtained from Jup+/+ and Jup–/– mice upon inhibition of EGFR or SRC. Consecutive slices were taken for controls and treatments, and treatments were normalized to the respective control slice to minimize variability due to differences in cardiac slice size. *P ≤ 0.05, 1-way ANOVA with Holm-Sidak correction, n = 7 for Jup+/+ mice and n = 6 for Jup–/– mice. (D) Dispase-based dissociation assay in HL-1 cardiomyocytes upon inhibition of EGFR or SRC by erlotinib or PP2, respectively, with representative pictures of the wells. *P ≤ 0.05, 1-way ANOVA with Holm-Sidak correction, n = 7 independent experiments. (E) Maximum projections of immunostainings in HL-1 cardiomyocytes for N-CAD and DSG2 showing an increase of DSG2 at the cell borders after erlotinib or PP2 treatments. Z-scans spanning the whole cell volume; z steps = 0.25 μm. White arrows indicate areas of increased DSG2 localization at the cell membrane. Scale bar: 10 μm. (F) Representative Western blots for immunoprecipitation of DSG2, coimmunoprecipitation of DP, EGFR, PKP2, and PG. IgG heavy chain (IgG hc) served as loading control for immunoprecipitated samples. n = 3 independent experiments.
Figure 2
Figure 2. EGFR inhibition leads to increased DSG2 binding frequency at cell borders.
(AC) Binding frequency and topography during atomic force microscopy (AFM) measurements on HL-1 cardiomyocytes before and after erlotinib treatment at or close to cell borders and cell surfaces with tips coated with DSG2 (A), N-CAD (B), and DSC2 (C). Measurements were first performed in 90-minute DMSO-treated samples; then, medium was changed, erlotinib was added, and experiments were performed after 90 minutes. Green dots in topography images indicate binding events; cyan dots indicate cell borders. Topography images are 1.5 × 5 μm. In the graphs, per data point, 1,500 curves were analyzed across 2 areas (1.5 × 5 μm). *P ≤ 0.05. Statistical significance was calculated between DMSO versus erlotinib. Unpaired Student’s t test, n = 3 independent experiments. (DF) Unbinding forces measured during AFM measurements on HL-1 cardiomyocytes at cell borders and cell surfaces with tips coated with DSG2 (D), N-CAD (E), and DSC2 (F). Per data point, 1,500 curves were analyzed across 2 areas (1.5 × 5 μm). *P ≤ 0.05. Statistical significance was calculated between DMSO versus erlotinib. Unpaired Student’s t test, n = 3 independent experiments.
Figure 3
Figure 3. Positive adhesiotropy induced by EGFR or SRC inhibition is dependent on DP.
(A) Dispase-based dissociation assay in HL-1 cardiomyocytes after siRNA-mediated knockdown of Egfr and nontarget (NT) control knockdown. Unpaired Student’s t test, n = 6 independent experiments. (B) Dispase-based dissociation assay in HL-1 cardiomyocytes after siRNA-mediated knockdown of EGFR and treatments with erlotinib or PP2. *P ≤ 0.05, 1-way ANOVA with Holm-Sidak correction, n = 6. (C) Representative Western blot confirmation of siRNA-mediated knockdown efficiency for Egfr, Dsp, and Dsg2 knockdowns; α-tubulin served as loading control. n = 6 independent experiments. (D) Dispase-based dissociation assay in HL-1 cardiomyocytes after siRNA-mediated knockdown of Dsg2 or Dsp. Unpaired Student’s t test. (E) Dispase-based dissociation assay in HL-1 cardiomyocytes after siRNA-mediated knockdown of Dsg2 or Dsp and treatments with erlotinib or PP2. *P ≤ 0.05, 1-way ANOVA with Holm-Sidak correction, n = 6–8 independent experiments.
Figure 4
Figure 4. Increased DP and DSG2 recruitment to the cell membranes leads to longer areae compositae upon EGFR or SRC inhibition.
(A) Immunostaining of DP and DSG2 in HL-1 cardiomyocytes with phalloidin as membrane marker. Scale bar: 10 μm. White arrows represent an increase in DSG2 and DP localization to the membrane compared with DMSO. (B) Quantification of colocalization of DP and phalloidin. *P ≤ 0.05, 1-way ANOVA with Holm-Sidak correction. (C) Quantification of colocalization of DSG2 and phalloidin. *P ≤ 0.05, 1-way ANOVA with Holm-Sidak correction. Each data point represents 1 area. n = 6 independent experiments. (D) STED images of HL-1 cardiomyocytes stained for DP and DSG2. Scale bar: 2 μm (for overview images), 500 nm (for zoomed images). (E) Number of areae compositae over 6 areas (15 × 15 μm) from n = 5 independent experiments. 1-way ANOVA with Holm-Sidak correction. (F) Quantification of area composita length. *P ≤ 0.05, 1-way ANOVA with Holm-Sidak correction, n = 5 independent experiments.
Figure 5
Figure 5. Increased DES insertion into DP upon erlotinib or PP2 treatments.
(A) Representative STED images of HL-1 cardiomyocytes stained for DP and DES. (B) Bar graphs represent percentage of desmosomes with DES insertions. Scale bar: 10 μm (for overview images), 2 μm (for zoomed images). *P ≤ 0.05, 1-way ANOVA with Holm-Sidak correction, n = 4 independent experiments. White arrows indicate DES insertions into areae compositae.
Figure 6
Figure 6. EGFR or SRC inhibition leads to increased recruitment of DP and DSG2 into the ICDs in Jup+/+ and Jup–/– mice.
(A) Immunostaining of DP and DSG2 in Jup+/+ murine cardiac slices with WGA as membrane marker. Scale bar: 8 μm. (B) DP staining width. (C) DSG2 staining width. *P ≤ 0.05, 1-way ANOVA with Holm-Sidak correction. Each data point represents 1 ICD. n = 4 mice. (D) Immunostainings of Jup–/– murine cardiac slices for DP and DSG2 with WGA as membrane marker. Scale bar: 8 μm. (E) DP staining width. (F) DSG2 staining width. *P ≤ 0.05, 1-way ANOVA with Holm-Sidak correction. Each data point represents 1 ICD. n = 4 mice. White arrows represent an increase in staining width in DSG2 or DP staining compared with DMSO.
Figure 7
Figure 7. Increased recruitment of DP and DSG2 toward the cell membrane is achieved by enhanced desmosome assembly.
(A and B) Fluorescence recovery after photobleach (FRAP) measurements in HL-1 cardiomyocytes transfected with DSG2-GFP and treated with DMSO or erlotinib. Measurements were performed 60-120 minutes posttreatment immobile fraction (A) and halftime of recovery (τ) (B). *P ≤ 0.05, unpaired Student’s t test, n = 4 independent experiments. (C) Dispase-based dissociation assay in HL-1 cardiomyocytes after 90 minutes of Ca2+ depletion and subsequent Ca2+ repletion together with erlotinib or PP2. *P ≤ 0.05, 1-way ANOVA with Holm-Sidak correction, n = 6 independent experiments. (D) Immunostaining of DP and DSG2 in HL-1 cardiomyocytes with phalloidin as membrane marker after 90 minutes of Ca2+ depletion and subsequent Ca2+ repletion together with erlotinib or PP2. White arrows indicate areas of increased DP or DSG2 recruitment to the membrane. Scale bar: 10 μm. (E and F) Quantification of colocalization of DP (E) or DSG2 and phalloidin (F). *P ≤ 0.05, 1-way ANOVA with Holm-Sidak correction, n = 4 independent experiments. Each data point represents 1 area. (G) Immunoprecipitation of DP from HL-1 lysates, and coimmunoprecipitation of EGFR, DSG2, PKP2 and PG; IgG hc served as loading control. n = 4–5 independent experiments.
Figure 8
Figure 8. Erlotinib-enhanced cardiomyocyte cohesion and desmosomal assembly are mediated by ROCK in HL-1 cardiomyocytes.
(A) RhoA G-LISA showing enhanced RhoA activity upon EGFR inhibition by erlotinib. *P ≤ 0.05, unpaired Student’s t test, n = 3. (B) Representative Western blot showing phosphorylation of the ROCK target MLC2 upon erlotinib treatment. *P ≤ 0.05, 2-way ANOVA with Holm Sidak’s multiple comparison test, n = 6 independent experiments. (C) Dispase-based dissociation assay in HL-1 cardiomyocytes, after treatment with erlotinib with and without Y27632. Y27632 was added 30 minutes prior to erlotinib incubation for 60 minutes, with representative pictures of the wells. *P ≤ 0.05, 2-way ANOVA with Holm Sidak’s multiple comparison test, n = 8 independent experiments. (D) Immunostaining of DP and DSG2 in HL-1 cardiomyocytes with WGA as membrane marker after erlotinib treatment with and without Y26732, as in C. White arrows indicate areas of increased DP or DSG2 recruitment to the cell membrane. Scale bar: 10 μm. (E) Dispase-based dissociation assay in HL-1 cardiomyocytes after 90 minutes of Ca2+ depletion and treatment with erlotinib with and without Y26732 with representative pictures of the wells. *P ≤ 0.05, 2-way ANOVA with Holm-Sidak’s multiple comparison test, n = 7 independent experiments.
Figure 9
Figure 9. Schematic overview of EGFR inhibition–mediated positive adhesiotropy.
EGFR exists in complex with DSG2, along with DP, PG, and PKP2, either at the cell borders or in the cytoplasm. Under physiological conditions, ROCK is necessary for basal cardiomyocyte cohesion. EGFR inhibition by erlotinib leads to ROCK activation, which results in positive adhesiotropy via enhanced desmosome assembly and area composita length. Inhibition of ROCK completely abrogates erlotinib-mediated positive adhesiotropy.

Similar articles

Cited by

References

    1. Bhargava R, et al. EGFR gene amplification in breast cancer: correlation with epidermal growth factor receptor mRNA and protein expression and HER-2 status and absence of EGFR-activating mutations. Mod Pathol. 2005;18(8):1027–1033. doi: 10.1038/modpathol.3800438. - DOI - PubMed
    1. Kleinschmidt-DeMasters BK, et al. Glioblastomas in the older old. Arch Pathol Lab Med. 2005;129(5):624–631. doi: 10.5858/2005-129-0624-GITOO. - DOI - PubMed
    1. Shia J, et al. Epidermal growth factor receptor expression and gene amplification in colorectal carcinoma: an immunohistochemical and chromogenic in situ hybridization study. Mod Pathol. 2005;18(10):1350–1356. doi: 10.1038/modpathol.3800417. - DOI - PubMed
    1. Da Cunha Santos G, et al. EGFR mutations and lung cancer. Annu Rev Pathol. 2011;6:49–69. doi: 10.1146/annurev-pathol-011110-130206. - DOI - PubMed
    1. Campbell P, et al. Epithelial inflammation resulting from an inherited loss-of-function mutation in EGFR. J Invest Dermatol. 2014;134(10):2570–2578. doi: 10.1038/jid.2014.164. - DOI - PMC - PubMed

Publication types