. 2023 Feb 28;42(2):112127.
doi: 10.1016/j.celrep.2023.112127. Epub 2023 Feb 14.

Circadian regulator CLOCK promotes tumor angiogenesis in glioblastoma

Affiliations

Circadian regulator CLOCK promotes tumor angiogenesis in glioblastoma

Lizhi Pang et al. Cell Rep. .

Abstract

Glioblastoma (GBM) is one of the most aggressive tumors in the adult central nervous system. We previously revealed that circadian regulation of glioma stem cells (GSCs) affects GBM hallmarks of immunosuppression and GSC maintenance in a paracrine and autocrine manner. Here, we expand the mechanism involved in angiogenesis, another critical GBM hallmark, as a potential basis underlying CLOCK's pro-tumor effect in GBM. Mechanistically, CLOCK-directed olfactomedin like 3 (OLFML3) expression results in hypoxia-inducible factor 1-alpha (HIF1α)-mediated transcriptional upregulation of periostin (POSTN). As a result, secreted POSTN promotes tumor angiogenesis via activation of the TANK-binding kinase 1 (TBK1) signaling in endothelial cells. In GBM mouse and patient-derived xenograft models, blockade of the CLOCK-directed POSTN-TBK1 axis inhibits tumor progression and angiogenesis. Thus, the CLOCK-POSTN-TBK1 circuit coordinates a key tumor-endothelial cell interaction and represents an actionable therapeutic target for GBM.

Keywords: BMAL1; CLOCK; CP: Cancer; TBK1; and POSTN; angiogenesis; circadian rhythm; glioblastoma; tumor microenvironment.


Conflict of interest statement

Declaration of interests The authors declare no competing interests.

Figures

Figure 1.
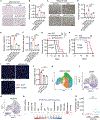
Figure 1.. GSC-derived CLOCK promotes angiogenesis in GBM
(A) GSEA analysis on TCGA GBM patient tumors shows the top 10 enriched hallmark pathways in BMAL1-high (the upper quartile) patients compared with BMAL1-low (the lower quartile) patients. Blue highlighted pathway relates to angiogenesis. (B) GSEA shows enrichment of angiogenesis signature in BMAL1-high patient tumors compared with BMAL1-low patient tumors. The normalized enrichment score (NES) and false discovery rate (FDR) q value of correlation are shown. (C) GSEA shows enrichment of angiogenesis signature in GSC272 cells harboring an inducible CLOCK shRNA (ishCLOCK) compared with ish control (ishC). NES and FDR q value of correlation are shown. (D and E) Representative images (D) and quantification (E) of relative migration of primary mouse brain endothelial cells following stimulation with conditioned media (CMs) from QPP7 GSCs expressing control shRNA (shC) and Clock shRNAs (shClock). Scale bar, 200 μm; n = 3 biological replicates. (F) Quantification of relative migration of iHUVECs following stimulation with CMs from QPP7 GSCs expressing shC and shClock. n = 3 biological replicates. (G and H) Representative images (G) and quantification (H) of relative tube formation of iHUVECs following stimulation with CMs from QPP7 GSCs expressing control shC and shClock. Scale bar, 200 μm; n = 3 biological replicates. (I) Quantification of relative migration of primary mouse brain endothelial cells following stimulation with CMs from QPP7 GSCs expressing shC and shBmal1. n = 3 biological replicates. (J) Quantification of relative migration of iHUVECs following stimulation with CMs from QPP7 GSCs expressing shC and shBmal1. n = 3 biological replicates. (K) Quantification of relative tube formation of iHUVECs following stimulation with CMs from QPP7 GSCs expressing control shC and shBmal1. n = 3 biological replicates. (L and M) Quantification of relative migration (L) and tube formation (M) of iHUVECs following stimulation with CMs from GSC272 cells expressing with or without ishC and ishCLOCK. n = 3 biological replicates. (N and O) Immunofluorescence (N) and quantification (O) of CD31 in tumors from SCID mice implanted with ishCLOCK and ishC GSC272 models. Scale bar, 100 μm; n = 3 biological replicates. (P) Quantification of relative migration of iHUVECs following stimulation with CMs from GSC272 cells treated with or without SR9009 (5 μM). n = 3 biological replicates. (Q) Quantification of relative tube formation of iHUVECs following stimulation with CMs from GSC272 cells treated with or without SR9009 (5 μM). n = 3 biological replicates. (R) Quantification of CD31 in tumors from CT2A-bearing C57BL/6J mice treated with or without SR9009 (100 mg/kg, intraperitoneally [i.p.], daily) for 10 days beginning at day 7 post-orthotopic injection. n = 3 biological replicates. (S) Clustering of human TCGA GBM tumor samples into angiogenesis-high and angiogenesis-low groups with use of a 20-gene angiogenesis signature. (T) The expression of CLOCK in angiogenesis-high versus angiogenesis-low patient tumors. (U) The expression of ARNTL in angiogenesis-high versus angiogenesis-low patient tumors. Data from multiple replicates are presented as mean. Error bars indicate mean ± SEM or SD. *p < 0.05, **p < 0.01, ***p < 0.001, Student’s t test and/or one-way ANOVA test. See also Figures S1 and S2.
Figure 2.
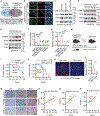
Figure 2.. The CLOCK-BMAL1 complex upregulates pro-angiogenetic factor POSTN in GSCs
(A) Identification of four overlapping angiogenic factors in ishCLOCK versus ishC GSC272 cells and in BMAL1-high versus BMAL1-low TCGA GBM patient tumors. (B) Heatmap representation of the four angiogenesis signature genes in ishCLOCK GSC272 cells compared with ishC cells. Red signal indicates higher expression, and blue signal denotes lower expression. (C) mRNA levels of the four angiogenesis signature genes in ishCLOCK and ishC GSC272 cells. n = 2 biological replicates. POSTN shows the most dramatic reduction upon CLOCK depletion. (D) qRT-PCR shows the expression of POSTN in ishC and ishCLOCK GSC272 cells. n = 3 biological replicates. Values are expressed as relative expression levels with respect to housekeeping gene ACTB. (E) qRT-PCR shows the expression of Postn in control- and SR9009 (5 μM)-treated QPP7 GSCs. n = 3 biological replicates. Values are expressed as relative expression levels with respect to housekeeping gene Actb. (F) Immunoblots for CLOCK, BMAL1, and POSTN in lysates of QPP7 GSCs expressing shC and shClock. (G) Immunoblots for CLOCK, BMAL1, and POSTN in lysates of QPP7 GSCs expressing shC and shBmal1. (H and I) Immunoblots for CLOCK, BMAL1, and POSTN in lysates of GSC272 cells (H) and QPP7 GSCs (I) treated with or without SR9009 (5 μM). (J) The correlation of CLOCK and POSTN in CGGA GBM patient tumors. R and p values are shown. Pearson test. (K) The correlation of ARNTL and POSTN in CGGA GBM patient tumors. R and p values are shown. Pearson test. (L) POSTN expression in ARNTL (−) and ARNTL (+) GSCs. The analysis is based on single-cell RNA sequencing data from 28 patients with GBM. **p < 0.01, Student’s t test. Data from multiple replicates are presented as mean. Error bars indicate mean ± SEM. *p < 0.05, **p < 0.01, Student’s t test. See also Figure S3.
Figure 3.
Figure 3.. POSTN in GSCs is essential for angiogenesis and tumor progression
(A and B) Representative images (A) and quantification (B) of relative migration of iHUVECs following stimulation with CMs from GSC272 cells expressing shC and shPOSTN. Scale bar, 200 μm; n = 3 biological replicates. (C and D) Representative images (C) and quantification (D) of relative tube formation of iHUVECs following stimulation with CMs from GSC272 cells expressing shC and shPOSTN. Scale bar, 400 μm; n = 3 biological replicates. (E and F) Quantification of relative Transwell migration (E) and tube formation (F) of iHUVECs following stimulation with CMs from QPP7 GSCs expressing shC and shPostn. n = 3 biological replicates. (G) Survival curves of C57BL/6 mice implanted with QPP7 GSCs (2 × 10⁴ cells) expressing shC and shPostn (n = 6–7 mice per group). (H) Survival curves of C57BL/6 mice implanted with CT2A cells (2 × 10⁴ cells) expressing shC and shPostn (n = 5 mice for shC group and 10 mice for shPostn group). (I and J) Immunofluorescence (I) and quantification (J) of CD31 in tumors from C57BL/6J implanted with shC and shPostn QPP7 GSCs. Scale bar, 50 μm; n = 3 biological replicates. (K–M) High-resolution uniform manifold approximation and projection (UMAP) dimensional reduction of glioma cells from GBM patient tumors, partitioned into nine distinct clusters (K). The expression of CD44 (L) and POSTN (M) in glioma cells/GSCs are shown. Intensity of the blue color indicates the expression of individual cells. The analysis was performed on single-cell RNA sequencing data of glioma cells from samples of 16 patients with GBM. (N) The correlation between glioma cell/GSC POSTN level and the frequency of tumor microenvironment components (including immune cells, endothelial cells, and pericytes as indicated) based on single-cell RNA sequencing data from 16 GBM patient tumors. Red signal indicates positive correlation, and blue signal denotes negative correlation. (O) Endothelial cell frequency in patients with glioma with glioma cell/GSC POSTN high versus POSTN low. The analysis is based on single-cell RNA sequencing data from 16 GBM patient tumors. Data from multiple replicates are presented as mean. Error bars indicate mean ± SEM. *p < 0.05, **p < 0.01, ***p < 0.001, one-way ANOVA test (B and D–F), Student’s t test (O), and log rank test (G and H). See also Figures S4–S6.
Figure 4.
Figure 4.. CLOCK-directed OLFML3-HIF1α axis upregulates POSTN expression and angiogenesis
(A) Volcano plots showing the fold change of genes (log2 scale) between OLFML3-high and OLFML3-low patient tumors (y axis, log10 scale). POSTN is the top one highly expressed in OLFML3-high tumors. (B) The correlation of POSTN and OLFML3 in TCGA GBM patient tumors. R and p values are shown. Pearson test. (C) Immunoblots for OLFML3 and POSTN in lysates of GSC272 cells expressing shC and shOLFML3. (D) Quantification of relative Transwell migration of iHUVECs following stimulation with CMs from GSC272 cells expressing shC and shOLFML3. n = 3 biological replicates. (E) Immunohistochemistry staining for CD31 (top panels) and POSTN (bottom panels) in tumors from SCID mice implanted with shOLFML3 and shC GSC272 cells. Scale bar, 100 μm. (F and G) Quantification of immunohistochemistry staining for CD31 (F) and POSTN (G) in tumors from SCID mice implanted with shOLFML3 and shC GSC272 cells. n = 3 biological replicates. (H and I) Representative images (H) and quantification (I) of HIF1A ChIP-PCR in the POSTN promoter of GSC272 cells. n = 3 biological replicates. (J) qRT-PCR for POSTN in lysates of GSC272 cells treated with HIF1α inhibitor acriflavine (ACF) at indicated concentrations. n = 3 biological replicates. Values are expressed as relative expression levels with respect to housekeeping gene ACTB. (K) Immunoblots for POSTN in lysates of GSC272 cells treated with ACF at indicated concentrations. (L and M) Quantification of relative Transwell migration (L) and tube formation (M) of iHUVECs following stimulation with CMs from GSC272 cells treated with or without ACF at indicated concentrations. n = 3 biological replicates. Data from multiple replicates are presented as mean. Error bars indicate mean ± SEM. *p < 0.05, **p < 0.01, ***p < 0.001, one-way ANOVA test (D, F, G, J, L, and M) and Student’s t test (I). See also Figure S7.
Figure 5.
Figure 5.. TBK1 mediates POSTN-induced angiogenesis in GBM
(A) Identification of the overlapping signature pathways in TCGA GBM patient tumors (POSTN high versus POSTN low) and in endothelial cells from single-cell RNA sequencing (scRNA-seq) data of GBM patient tumors (glioma cell/GSC POSTN high versus POSTN low). (B) Co-immunofluorescence for P-TBK1 and CD31 in QPP7 and CT2A tumors established in C57BL/6J mice (top and middle panels) and in GBM patient tumors (bottom panels). Scale bar, 50 μm. (C) Immunoblots for TBK1 and P-TBK1 in lysates of primary mouse brain endothelial cells treated with or without CMs from CT2A cells expressing shC and shPostn. (D and E) Immunoblots for TBK1 and P-TBK1 in lysates of iHUVECs treated with POSTN recombinant protein at 500 ng/mL for different time points (D) and for 60 min at different concentrations (E). (F and G) Quantification of relative Transwell migration (F) and tube formation (G) of iHUVECs following stimulation with POSTN recombinant protein (500 ng/mL) in the presence or absence of TBK1 inhibitor BX795 (1 μM) and CMPD1 (1 μM). n = 3 biological replicates. (H) Schematic of generation of endothelial cell-specific TBK1 knockout (TBK1-eKO) mice by crossing TBK1fl/fl mice with Cdh5(PAC)-CreERT2 mice. TBK1 KO in endothelial cells is induced by injection of tamoxifen (TAM; 75 mg/kg i.p.) for 5 days. (I and J) Survival curves of TBK1-WT and TBK1-eKO mice implanted with 2 × 10⁴ QPP7 GSCs (I, n = 8–9 mice/group) and CT2A cells (J, n = 5 mice/group). (K and L) Immunofluorescence (K) and quantification (L) of relative CD31 in tumors from TBK1-WT and TBK1-eKO mice implanted with CT2A cells. Scale bar, 50 μm n = 3 biological replicates. (M) Representative images show low, medium, and high expression of POSTN, P-TBK1, and CD31 in human GBM tumor samples based on immunohistochemistry staining. Scale bar, 100 μm. (N–P) Quantification of immunohistochemistry staining showing strong positive correlation between POSTN and P-TBK1 (N), POSTN and CD31 (O), and P-TBK1 and CD31 (P) in human GBM tumor samples (n = 23). R and p values are shown. Pearson test. Data from multiple replicates are presented as mean. Error bars indicate mean ± SEM. *p < 0.05, **p < 0.01, ***p < 0.001, one-way ANOVA test (F and G), Student’s t test (L), and log rank test (I and J). See also Figure S8.

References

    1. Chen P, Hsu WH, Chang A, Tan Z, Lan Z, Zhou A, Spring DJ, Lang FF, Wang YA, and DePinho RA (2020). Circadian regulator CLOCK recruits immune-suppressive microglia into the GBM tumor microenvironment. Cancer Discov. 10, 371–381. 10.1158/2159-8290.CD-19-0400. - DOI - PMC - PubMed
    1. Chen P, Zhao D, Li J, Liang X, Li J, Chang A, Henry VK, Lan Z, Spring DJ, Rao G, et al. (2019). Symbiotic macrophage-glioma cell interactions reveal synthetic lethality in PTEN-null glioma. Cancer Cell 35, 868–884.e6. 10.1016/j.ccell.2019.05.003. - DOI - PMC - PubMed
    1. Fernandes C, Costa A, Osorio L, Lago RC, Linhares P, Carvalho B, and Caeiro C (2017). Current standards of care in glioblastoma therapy. In Glioblastoma S. De Vleeschouwer, ed.. 10.15586/codon.glioblastoma.2017.ch11. - DOI - PubMed
    1. Wen PY, Weller M, Lee EQ, Alexander BM, Barnholtz-Sloan JS, Barthel FP, Batchelor TT, Bindra RS, Chang SM, Chiocca EA, et al. (2020). Glioblastoma in adults: a Society for Neuro-Oncology (SNO) and European Society of Neuro-Oncology (EANO) consensus review on current management and future directions. Neuro Oncol. 22, 1073–1113. 10.1093/neuonc/noaa106. - DOI - PMC - PubMed
    1. Stupp R, Taillibert S, Kanner A, Read W, Steinberg D, Lhermitte B, Toms S, Idbaih A, Ahluwalia MS, Fink K, et al. (2017). Effect of tumor-treating fields plus maintenance temozolomide vs maintenance temozolomide alone on survival in patients with glioblastoma: a randomized clinical trial. JAMA 318, 2306–2316. 10.1001/jama.2017.18718. - DOI - PMC - PubMed

Publication types

Substances