. 2023 Feb 28;42(2):112112.
doi: 10.1016/j.celrep.2023.112112. Epub 2023 Feb 14.

On the origin and evolution of RNA editing in metazoans

Affiliations

On the origin and evolution of RNA editing in metazoans

Pei Zhang et al. Cell Rep. .

Abstract

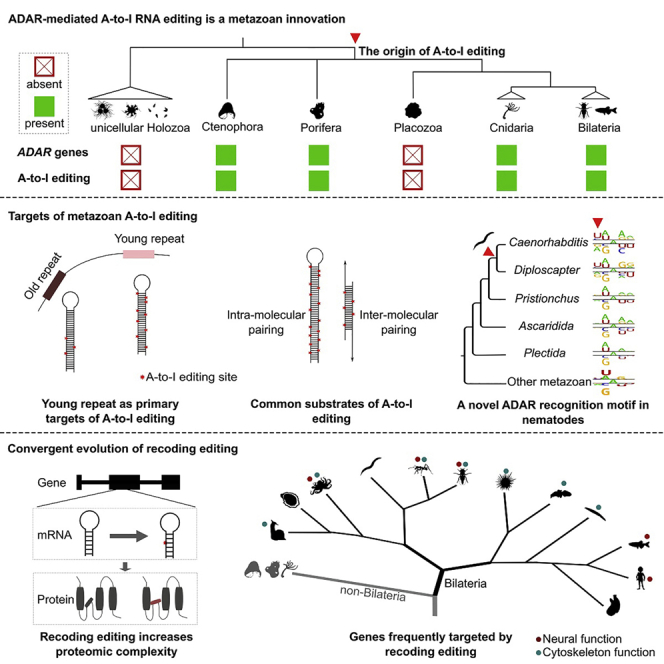
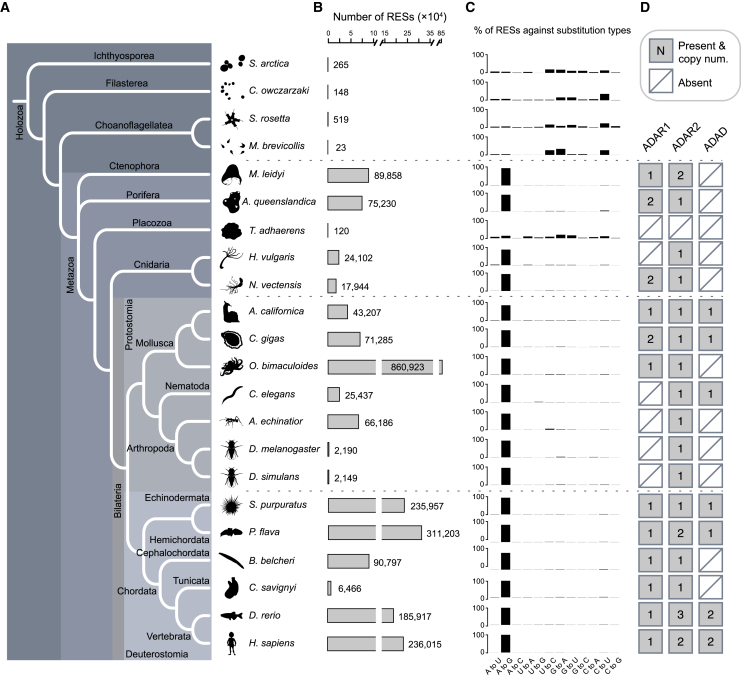
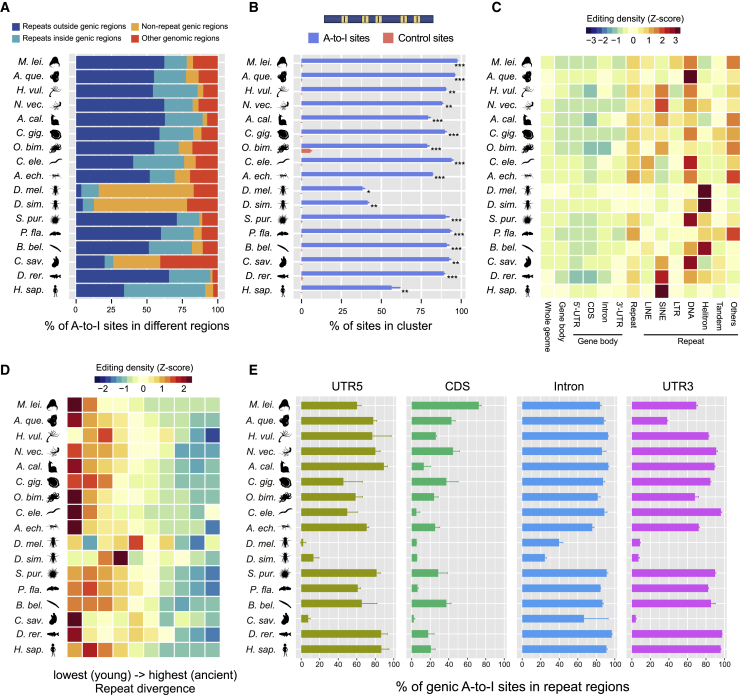
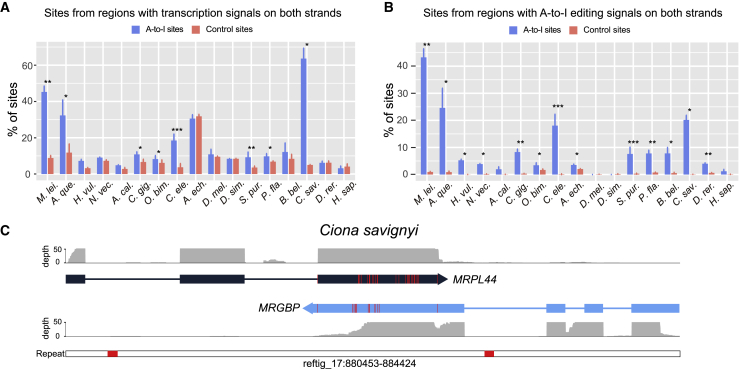
Extensive adenosine-to-inosine (A-to-I) editing of nuclear-transcribed mRNAs is the hallmark of metazoan transcriptional regulation. Here, by profiling the RNA editomes of 22 species that cover major groups of Holozoa, we provide substantial evidence supporting A-to-I mRNA editing as a regulatory innovation originating in the last common ancestor of extant metazoans. This ancient biochemistry process is preserved in most extant metazoan phyla and primarily targets endogenous double-stranded RNA (dsRNA) formed by evolutionarily young repeats. We also find intermolecular pairing of sense-antisense transcripts as an important mechanism for forming dsRNA substrates for A-to-I editing in some but not all lineages. Likewise, recoding editing is rarely shared across lineages but preferentially targets genes involved in neural and cytoskeleton systems in bilaterians. We conclude that metazoan A-to-I editing might first emerge as a safeguard mechanism against repeat-derived dsRNA and was later co-opted into diverse biological processes due to its mutagenic nature.

Keywords: A-to-I editing; Adar; CP: Molecular biology; Holozoa; RNA editing; animal; cytoskeleton; evolution; neural system; recoding editing; sense-antisense.


Conflict of interest statement

Declaration of interests The authors declare no competing interests.

Figures

None
Graphical abstract
Figure 1
Figure 1
The distribution of ADAR/ADAD genes and A-to-I mRNA editing in metazoans (A) The phylogeny of the 22 species examined in this study. The topology of the phylogenetic tree was derived according to previous reports.,, Full names for the 22 species from top to bottom are Sphaeroforma arctica (ichthyosporean); Capsaspora owczarzaki (filasterean); Salpingoeca rosetta (choanoflagellate); Monosiga brevicollis (choanoflagellate); Mnemiopsis leidyi (ctenophore); Amphimedon queenslandica (sponge); Trichoplax adhaerens (placozoan); Hydra vulgaris (hydra); Nematostella vectensis (sea anemone); Aplysia californica (sea hare); Crassostrea gigas (oyster); Octopus bimaculoides (octopus); Caenorhabditis elegans (roundworm); Acromyrmex echinatior (ant); Drosophila melanogaster (fruit fly); Drosophila simulans (fruit fly); Strongylocentrotus purpuratus (sea urchin); Ptychodera flava (acorn worm); Branchiostoma belcheri (lancelet); Ciona savignyi (sea squirt); Danio rerio (zebrafish); and Homo sapiens (human). (B) The total number of potential RNA-editing sites (RESs) identified in each species. (C) The percentage of editing sites across the 12 possible types of nucleotide substitutions. (D) The presence/absence of ADAR1, ADAR2, and ADAD in each metazoan species. The copy number is also indicated if a gene is present. See also Figures S1 and S2 and Tables S1 and S2.
Figure 2
Figure 2
The genomic targets of metazoan A-to-I editing (A) The proportion of A-to-I editing sites in different genomic regions. Genic regions include untranslated (5′ UTR and 3′ UTR), CDS, and intron regions of all protein-coding genes. Repeats include transposons and tandem repeats annotated for each species in this study. (B) The percentage of A-to-I editing sites occurring in clusters. A cluster contains ≥3 A-to-I editing sites, of which the distance between two adjacent sites is ≤30 nt. Control sites are randomly selected transcribed adenosines with the same number and comparable RNA depth of the A-to-I editing sites in each sample from each species. Bars represent the mean ± SD across samples, and asterisks indicate significance levels estimated by two-tailed paired t tests, with p < 0.05, ∗∗p < 0.01, and ∗∗∗p < 0.001. (C) Comparison of editability across different genomic elements in each species. Editability is measured as the number of A-to-I editing sites per million transcribed adenosine sites (RNA depth ≥2×) for each type of genomic element. (D) The negative correlation between the sequence divergence and the editability of repetitive elements. (E) The percentages of genic A-to-I editing sites located in regions annotated as concurrent repetitive elements. Genic editing sites were defined as editing sites located in the 5′ UTR, CDS, intron, and 3′ UTR of protein-coding genes. Bars represent the mean ± SD across samples. See also Figure S3.
Figure 3
Figure 3
A-to-I editing of dsRNA substrates formed by intermolecular pairing of sense and antisense transcripts (A) The percentage of A-to-I editing sites located in dsRNA regions potentially formed by intermolecular pairing of sense-antisense transcripts and measured as the proportion of sites located in a region (±50 nt surrounding the focal edited adenosine) with a transcription signal (RNA depth ≥2× along >50% of the region) in both strands. Control sites are randomly selected transcribed adenosines with the same number and comparable RNA depth of the A-to-I editing sites in each sample of each species. (B) The proportion of A-to-I editing sites located in regions with editing signals on both strands and measured as the proportion of sites located in a region (±25 nt surrounding the focal edited adenosine) with at least one A-to-I editing site found on the opposite strand. The control sites are the same as those in (A). (C) An example of sense-antisense transcript pairing in Ciona savignyi showing the RNA coverage of both transcript models, the location of A-to-I editing sites on both transcripts (red vertical bars within each transcript model), and the distribution of repeats in this genomic region (red boxes in the bottom track). In (A) and (B), bars represent the mean ± SD across samples, and asterisks indicate significance levels estimated by two-tailed paired t tests, with p < 0.05, ∗∗p < 0.01, and ∗∗∗p < 0.001. See also Table S3.
Figure 4
Figure 4
Origin of a novel ADAR recognition motif in nematodes (A) Principal-component analysis based on the neighboring nucleotide preference of the edited adenosines, showing that C. elegans is separated from other metazoans based on dimension 1. (B) The neighboring nucleotide preferences of the edited adenosines in nine different nematode species. The copy numbers of ADR-1 and ADR-2 are presented for each species. The red arrow indicates the latest emergence of the C. elegans motif in the nematode phylogenetic tree. (C) Multiple sequence alignment showing the four amino acid substitutions that have been fixed in the motif-shifted nematodes after diverging from other nematodes. Of note, the frequencies of amino acids obtained from 15 ADAR1s and 21 ADAR2s from the 16 non-Nematoda metazoans are displayed as sequence logos generated by Weblogo 3. The coordinates of the four indicated amino acids are based on human ADAR2 (UniProt: P78563-2). (D) 3D structure simulation of human ADAR2 with the E485D (top) and E488M substitutions (bottom) relative to the wild-type structure. The structure in cyan represents the wild-type structure with E485 and E488, and the structure in orange represents the structure with D485 or M488. Red circles indicate the areas with structural changes after substitutions. See also Figures S4 and S5 and Table S4.
Figure 5
Figure 5
The origin and evolution of recoding editing in metazoans (A) A summary of recoding editing sites identified in each species. (B and C) The recoding of two AIFM3 genes in the sponge A. queenslandica (B) and the LYSMD3 gene in the ctenophore M. leidyi (C). The top part shows the domain organization of the protein products. The bottom part shows the multiple sequence alignments surrounding the recoding sites. The prerecoding amino acids are highlighted by red shadows, and the postrecoding amino acids are shown above the recoding sites. The values on the right side of the multiple sequence alignments represent the editing levels. (D) Functional categories that are enriched by recoded genes in no less than three species (two-sided Fisher’s exact test adjusted p < 0.05). (E) Recoding sites shared by two or more species. For each recoding site, the recoded gene, the protein-based coordinate, the amino acid before recoding, and the amino acid after recoding are shown on the x axis. See also Table S5.

References

    1. Crick F. Central dogma of molecular biology. Nature. 1970;227:561–563. doi: 10.1038/227561a0. - DOI - PubMed
    1. Knoop V. When you can't trust the DNA: RNA editing changes transcript sequences. Cell. Mol. Life Sci. 2011;68:567–586. doi: 10.1007/s00018-010-0538-9. - DOI - PMC - PubMed
    1. Gray M.W. Evolutionary origin of RNA editing. Biochemistry. 2012;51:5235–5242. doi: 10.1021/bi300419r. - DOI - PubMed
    1. Eisenberg E., Levanon E.Y. A-to-I RNA editing - immune protector and transcriptome diversifier. Nat. Rev. Genet. 2018;19:473–490. doi: 10.1038/s41576-018-0006-1. - DOI - PubMed
    1. Nishikura K. A-to-I editing of coding and non-coding RNAs by ADARs. Nat. Rev. Mol. Cell Biol. 2016;17:83–96. doi: 10.1038/nrm.2015.4. - DOI - PMC - PubMed

Publication types

LinkOut - more resources