. 2023 Feb 28;42(2):112115.
doi: 10.1016/j.celrep.2023.112115. Epub 2023 Feb 15.

Cone photoreceptors transfer damaged mitochondria to Müller glia

Affiliations

Cone photoreceptors transfer damaged mitochondria to Müller glia

Rachel A Hutto et al. Cell Rep. .

Abstract

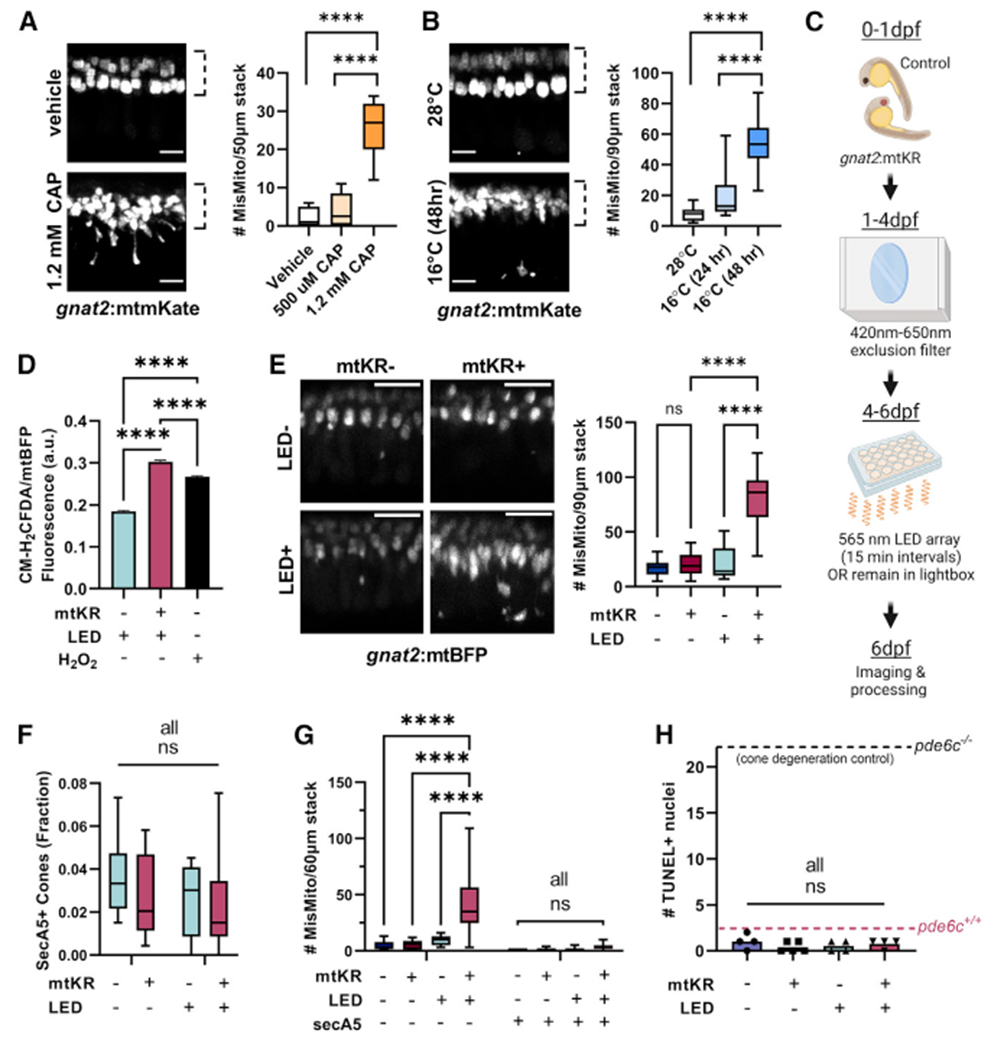
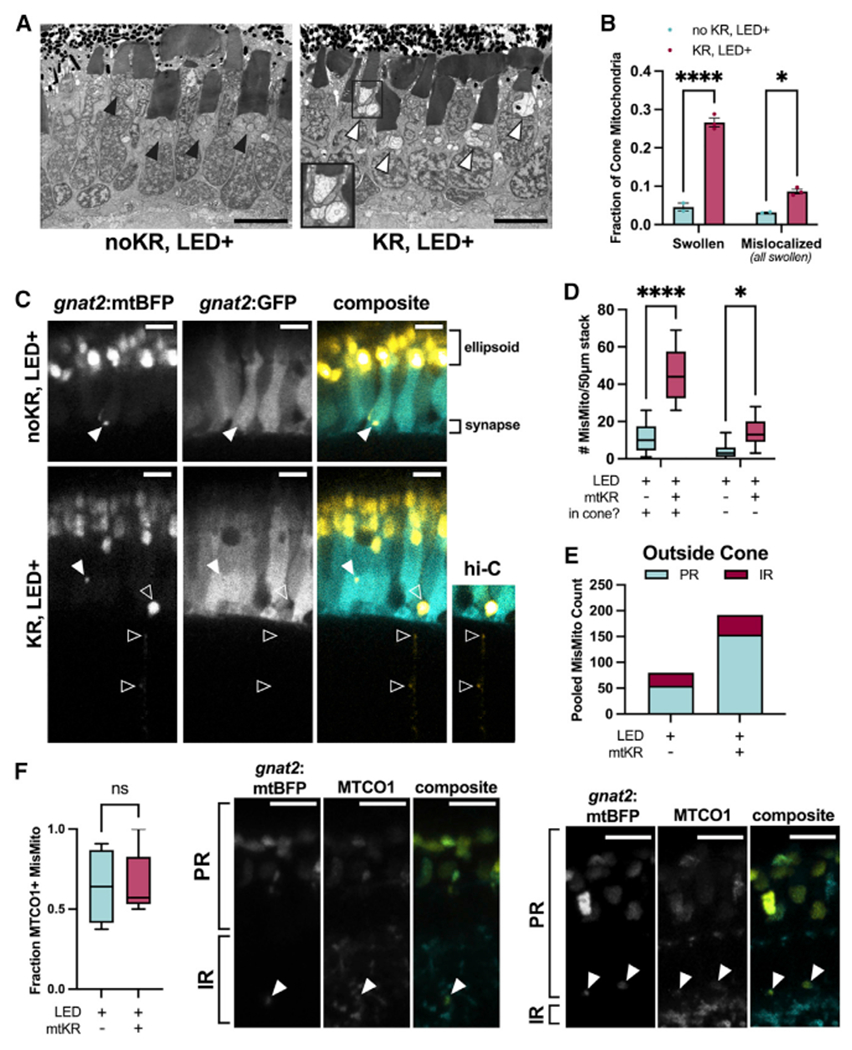
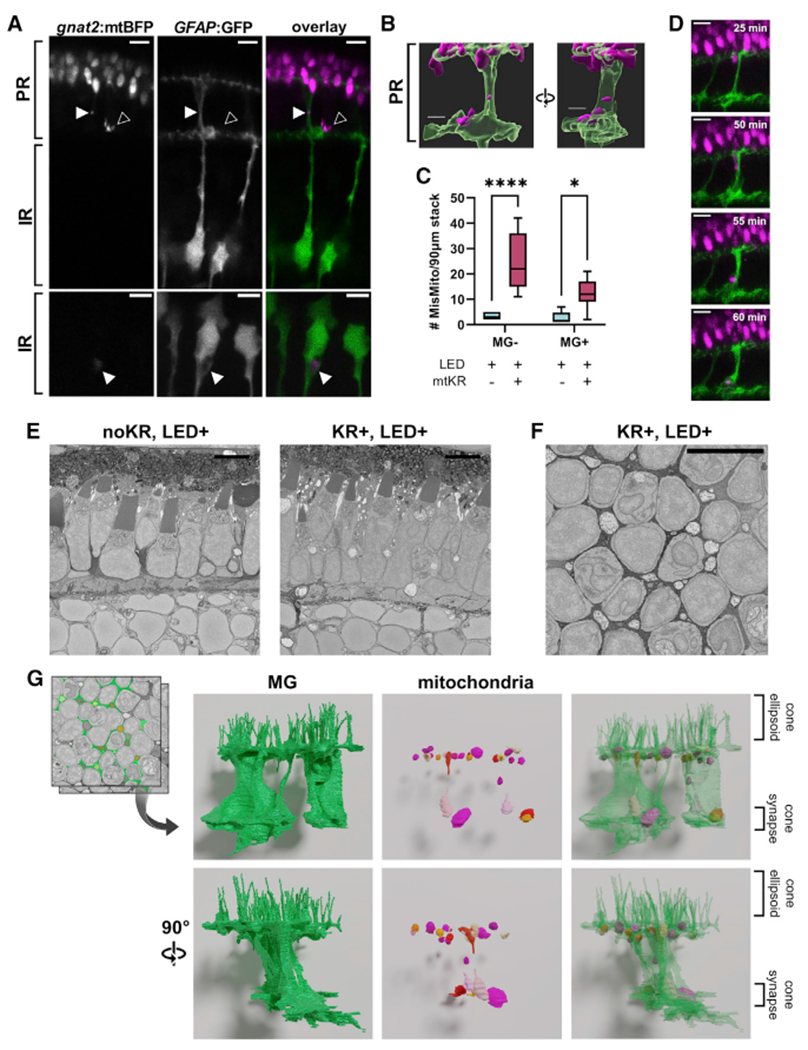
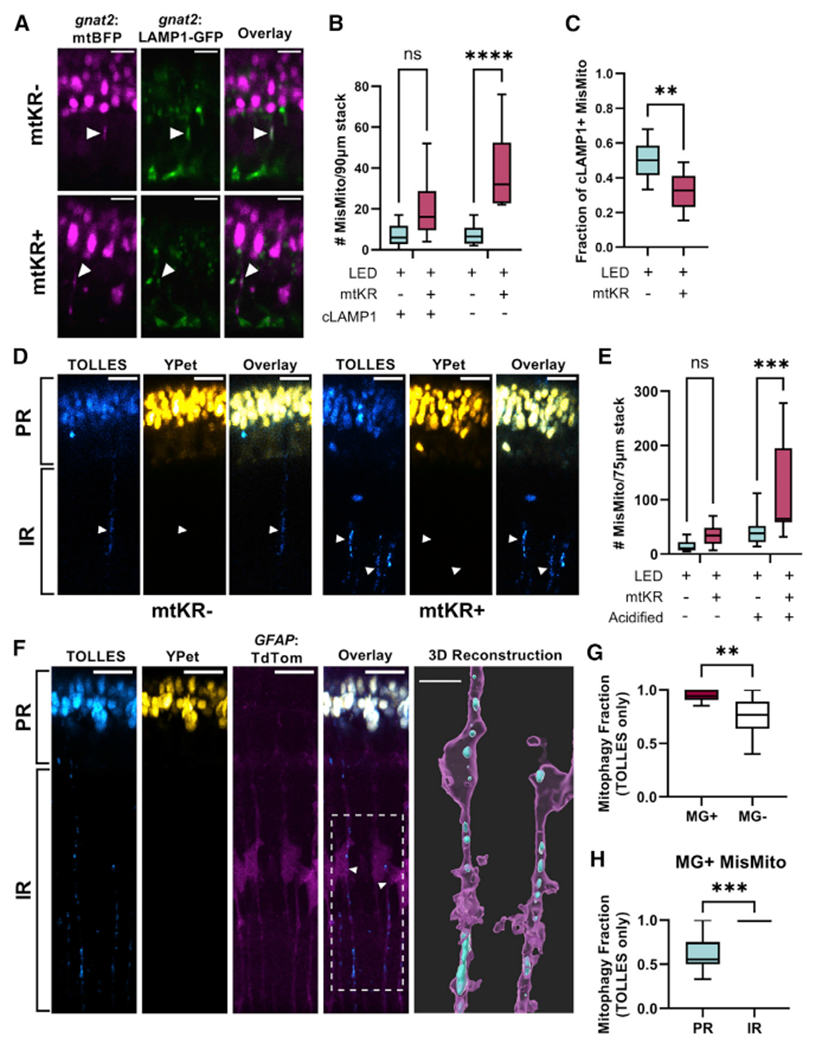
Mitochondria are vital organelles that require sophisticated homeostatic mechanisms for maintenance. Intercellular transfer of damaged mitochondria is a recently identified strategy broadly used to improve cellular health and viability. Here, we investigate mitochondrial homeostasis in the vertebrate cone photoreceptor, the specialized neuron that initiates our daytime and color vision. We find a generalizable response to mitochondrial stress that leads to loss of cristae, displacement of damaged mitochondria from their normal cellular location, initiation of degradation, and transfer to Müller glia cells, a key non-neuronal support cell in the retina. Our findings show transmitophagy from cones to Müller glia as a response to mitochondrial damage. Intercellular transfer of damaged mitochondria represents an outsourcing mechanism that photoreceptors use to support their specialized function.

Keywords: CP: Neuroscience; Müller glia; mitochondria; mitophagy; photoreceptor; retina; zebrafish.


Conflict of interest statement

Declaration of interests The authors declare no competing interests.

Figures

Figure 1.
Figure 1.. Stress causes mislocalized mitochondria in cones
(A) Chloramphenicol (CAP) causes cone mitochondria (gnat2:mtmKate) to migrate away from the ellipsoid region (dotted line). Mislocalized mitochondria were quantified per fish. n = 11 fish for vehicle and 1.2 mM CAP conditions and n = 8 for 500 μM CAP. ****p < 0.0001 using one-way ANOVA. Scale bar: 5 μm. (B) Cold (16°C) causes cone mitochondria to migrate from the cone ellipsoid (dotted line). Mislocalized mitochondria were quantified per fish. n = 10 28°C, n = 6 16°C (24 h), and n = 20 16°C (48 h) fish. ****p < 0.0001 using one-way ANOVA. Scale bar: 5 μm. (C) Schematic for gnat2:mtKillerRed (mtKR) experiments. Embryos were put in a chamber reducing 420–650 nm light to prevent KillerRed activation while maintaining light/dark cycles. At 4 dpf, fish were either kept in the chamber or put on a plate above an LED array of 565 nm light. After 48 h, fish were processed/imaged. (D) CM-H2DCFDA fluorescence in cone mitochondria (gnat2:mtBFP) shows increased mitochondrial ROS upon gnat2:mtKR activation. Fluorescence was normalized to mtBFP to correct for depth in the eye. ****p < 0.0001 with one-way ANOVA. mtKR−: 26,035 mitochondrial clusters from 8 eyes, mtKR+: 24,144 clusters from 13 eyes, and H2O2: 40,632 clusters from 15 eyes. (E) Only mtKR fish activated by the LED array (mtKR+, LED+, see protocol in C) have increased cone mitochondrial mislocalization. Cone mitochondria labeled with gnat2:mtBFP. Scale bar: 10 μm. n = 13 fish for mtKR−, LED− and mtKR+, LED+; n = 16 for mtKR+, LED−; and n = 14 for mtKR−, LED+. ****p<0.0001 with one-way ANOVA. (F) Quantification of secreted Annexin5+ (secA5; apoptotic) cones, identified by the presence of gnat2:mtBFP. Neither LED treatment nor mKR activation is associated with cone cell death. Total cones in a 60 μm stack were estimated by quantification of ellipsoid mitochondrial clusters across n = 5 fish. All comparisons are not significant (ns) with two-way ANOVA. mtKR−, LED−: n = 6; mtKR−, LED+: n = 9; mtKR+, LED−: n = 8; mtKR+, LED+: n = 19. (G) Increases in mislocalized mitochondria (gnat2:mtBFP) upon mtKR activation were only observed in non-apoptotic cells (secA5−). Few mislocalized mitochondria were found in apoptotic cells. Same n as (F). ****p < 0.0001 with a two-way ANOVA. (H) TUNEL+nuclei across a 10 μm slice from 6 dpf eyes. No difference detected regardless of LED exposure or the presence of mtKR. Positive control is the pde6c−/− cone degeneration model (black dotted line) and negative control is pde6c+/+ wild-type (WT) sibling (magenta dotted line). n = 4 for all but mtKR+, LED− (n = 5). All comparisons are ns with one-way ANOVA.
Figure 2.
Figure 2.. Mislocalized mitochondria are abnormal and reside in and outside of cone photoreceptors
(A) Transmission electron micrographs taken at the optic nerve. Cones with activated mKR have many mitochondria with disturbed, swollen morphology both in and outside of the ellipsoid clusters; an inset (black box) shows a cone ellipsoid containing multiple swollen mitochondria. Black arrowhead: ellipsoid cluster with typical mitochondria morphology, white arrowhead: ellipsoid cluster with swollen mitochondria. Scale bar: 5 μm. (B) Quantification of individual cone mitochondria from slices in (A). A greater fraction of mitochondria are swollen and mislocalized in mKR+ cones. All mislocalized mitochondria had swollen morphology. n = 2 kR− fish (641 and 759 total mitochondria) and n = 3 kR+ fish (520, 613, and 566 total mitochondria). *p < 0.05 and ****p < 0.0001 using a two-way ANOVA. (C) Imaging of Tg(gnat2:mtBFP, gnat2:GFP) fish reveals that mislocalized cone mitochondria reside inside cones (filled arrowheads) and partially or completely outside of cones (unfilled arrowheads). Hi-C, high-contrast to enhance visibility of mitochondria. Scale: 5 μm. (D) Quantification of mislocalized mitochondria by colocalization of cone GFP; cone− includes mitochondria that appear partially or completely out of cones (see C). mtKR increases cone mitochondria number both inside and outside cones. *p < 0.05 and ****p < 0.0001 using a two-way ANOVA. n = 13 fish each condition. (E) Pooled cone-mislocalized mitochondria totals across all fish binned by retinal region. IR, inner retina; PR, photoreceptor layer. (F) Immunohistochemistry images of mislocalized mitochondria (filled arrows) colocalized with MTCO1 in PR and inner retina IR. Fraction of mislocalized cone mitochondria colocalized with mitochondrial protein, MTCO1. mKiller Red−: 74 mislocalized mitochondria from 4 eyes mtKillerRed+: 104 mislocalized mitochondria from 5 eyes. Comparisons are ns with unpaired t test. Scale: 5 μm.
Figure 3.
Figure 3.. Mislocalized cone mitochondria are found in Müller glia (MG) cells
PR, photoreceptor layer; IR, inner retina; OLM, outer limiting membrane. (A) In vivo imaging offish expressing gnat2:mtBFP and GFAP:GFP shows mislocalized mitochondria both inside (filled arrow) and outside (unfilled arrow) MGs. Both images were obtained from mtKR+, LED+ fish. Scale: 5 μm. (B) 3D reconstruction of mislocalized mitochondrion encapsulated by an MG process from the first panel of (A). Scale: 3 μm. (C) Quantification of mislocalized cone mitochondria classified by colocalization with MGs. Activation of mtKR increases both MG+ and MG− mislocalized mitochondria. *p < 0.05 and ****p < 0.0001 using a two-way ANOVA. n = 6 noKR fish, n = 7 kR+ fish. (D) Images from a 4 h, 5 min interval in vivo timelapse of a Tg(gnat2:mtBFP, GFAP:GFP,gnat2:mtKR) fish post-LED treatment. Scale: 5 μm. (E) Longitudinal micrographs from SBFEM for mtKR− and mtKR+ fish (both LED treated). The mtKR fish contains several swollen, electron-lucent mitochondria between cone cell bodies near the photoreceptor nuclear layer and synapse. Scale: 5 μm. (F) Transverse section from SBFEM stack of a mtKR+ fish at the OLM where abundant swollen/lucent mitochondria can be observed between cone cells in MG. Scale: 5 μm. (G) 3D reconstruction of MG cytosol (green) and the swollen mitochondria (multicolor) observed both at the OLM further down MG processes.
Figure 4.
Figure 4.. Cone mitochondria degradation occurs in MGs
(A) In vivo imaging of Tg(gnat2:mtBFP, gnat2:-LAMP1-GFP) fish; mislocalized mitochondria colocalized with cone lysosomes (filled arrows) in mtKR− and mtKR+ fish. Scale: 5 μm. (B) Quantification of (A) shows a marked increase in mislocalized mitochondria unassociated with cone lysosomes upon ROS stress. cLAMP1, cone LAMP1. n = ****p < 0.0001 using a two-way ANOVA. n = 10 fish each condition. (C) Fraction of cLAMP1+ mislocalized mitochondria from data in (A) and (B). While mtKR have more mislocalized mitochondria, a lower fraction is associated with cone lysosomes compared with controls. n = 10 mtKR+ fish, n = 9 mtKR− fish (1 excluded from fraction due to <5 total mislocalized mitochondria). **p < 0.01 using Welch’s t test. (D) In vivo imaging of Tg(gnat2:mtSRAI) with and without mtKR (LED treated). PR, photoreceptor layer; IR, inner retina. Mitochondria that have lost YPet fluorescence (acid and protease sensitive) are in acidified compartments. Arrowheads indicate “trails” of acidified cone mitochondria in the IR. Scale: 10 μm. (E) Quantification of acidified mislocalized mitochondria from dataset in (D). 3D volumes were generated in Imaris, manually binned as mislocalized/ellipsoidal, and identified as acidified if mean fluorescence TOLLES > Ypet. noKR n = 12; KR+ n = 9 fish. ***p < 0.001 with two-way ANOVA. (F) In vivo imaging of normal, unstressed Tg(gnat2:mtSRAI, GFAP:TdTomato) fish (no mtKR, no LED). Trails of TOLLES+ mislocalized cone mitochondria colocalize with MG processes in the IR. Scale: 10 μm. Imaris was used to generate a 3D reconstruction (scale: 5 μm) of two of these MGs; their cell bodies are noted by an arrowhead and the ROI by a dotted line in the overlay fluorescent image (magenta: MG, cyan: TOLLES+ MisMito). (G) Mitophagy fraction (acidified/total) of mislocalized mitochondria inside and outside MGs in unstressed fish. Mitochondria were manually binned by presence of YPet (see STAR Methods). n = 11 fish. **p < 0.01 with Welch’s t test. (H) Mitophagy fraction (acidified/total) of cone mitochondria in MG, binned by location in the retina. Mitochondria observed in inner retinal portions of MG were acidified. n = 11 fish. ***p < 0.001 with Welch’s t test.

References

    1. Davis C.h.O., Kim KY, Bushong EA, Mills EA, Boassa D, Shih T, Kinebuchi M, Phan S, Zhou Y, Bihlmeyer NA, et al. (2014). Transcellular degradation of axonal mitochondria. Proc. Natl. Acad. Sci. USA 111, 9633–9638. 10.1073/pnas.1404651111. - DOI - PMC - PubMed
    1. Lampinen R, Belaya I, Saveleva L, Liddell JR, Rait D, Huuskonen MT, Giniatullina R, Sorvari A, Soppela L, Mikhailov N, et al. (2022). Neuron-astrocyte transmitophagy is altered in Alzheimer’s disease. Neurobiol. Dis 170, 105753. 10.1016/j.nbd.2022.105753. - DOI - PubMed
    1. Morales I, Sanchez A, Puertas-Avendaño R, Rodriguez-Sabate C, Perez-Barreto A, and Rodriguez M (2020). Neuroglial transmitophagy and Parkinson’s disease. Glia 68, 2277–2299. 10.1002/glia.23839. - DOI - PubMed
    1. Rosina M, Ceci V, Turchi R, Chuan L, Borcherding N, Sciarretta F, Sánchez-Díaz M, Tortolici F, Karlinsey K, Chiurchiù V, et al. (2022). Ejection of damaged mitochondria and their removal by macrophages ensure efficient thermogenesis in brown adipose tissue. Cell Metabol. 34, 533–548.e12. 10.1016/j.cmet.2022.02.016. - DOI - PMC - PubMed
    1. Okawa H, Sampath AP, Laughlin SB, and Fain GL (2008). ATP consumption by mammalian rod photoreceptors in darkness and in light. Curr. Biol 18, 1917–1921. 10.1016/j.cub.2008.10.029. - DOI - PMC - PubMed

Publication types