. 2023 Feb 16;18(2):e0281464.
doi: 10.1371/journal.pone.0281464. eCollection 2023.

Induction of flight via midbrain projections to the cuneiform nucleus

Affiliations

Induction of flight via midbrain projections to the cuneiform nucleus

Emmy Tsang et al. PLoS One. .

Abstract

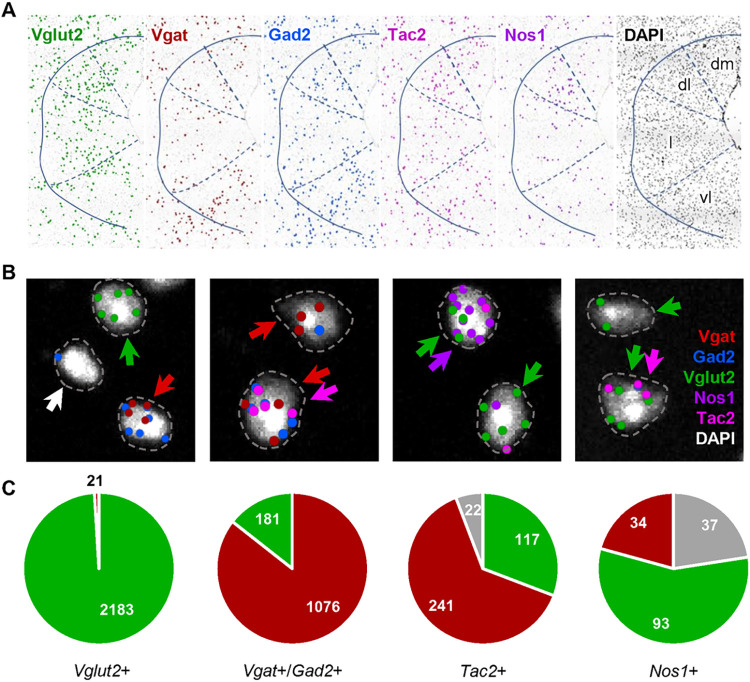
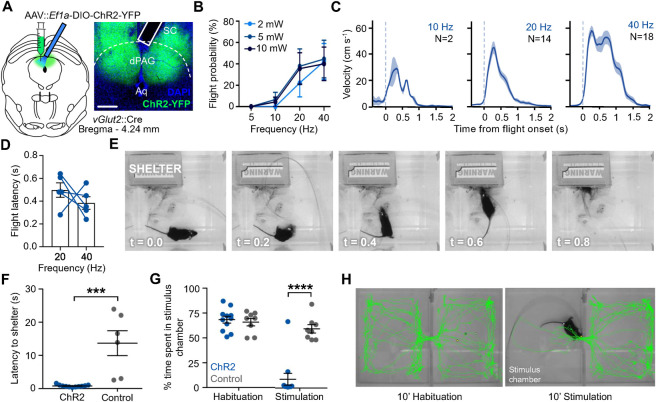
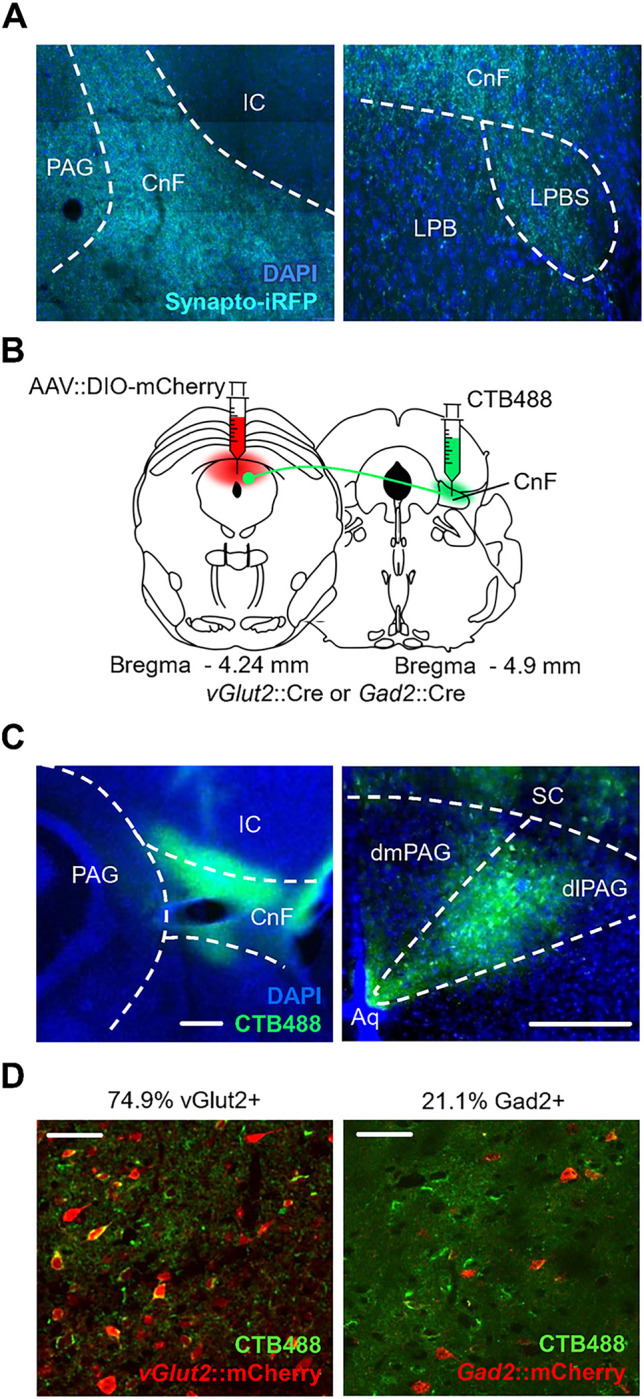
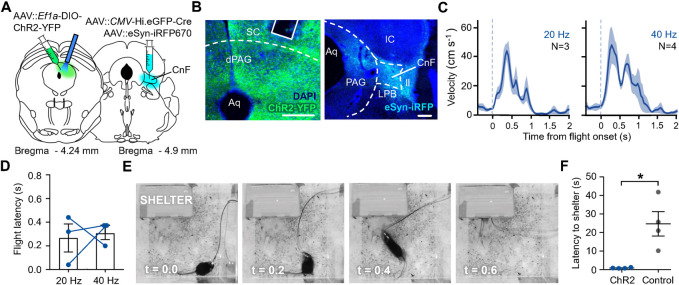
The dorsal periaqueductal gray is a midbrain structure implicated in the control of defensive behaviors and the processing of painful stimuli. Electrical stimulation or optogenetic activation of excitatory neurons in dorsal periaqueductal gray results in freezing or flight behavior at low and high intensity, respectively. However, the output structures that mediate these defensive behaviors remain unconfirmed. Here we carried out a targeted classification of neuron types in dorsal periaqueductal gray using multiplex in situ sequencing and then applied cell-type and projection-specific optogenetic stimulation to identify projections from dorsal periaqueductal grey to the cuneiform nucleus that promoted goal-directed flight behavior. These data confirmed that descending outputs from dorsal periaqueductal gray serve as a trigger for directed escape behavior.


Conflict of interest statement

The authors have declared that no competing interests exist.

Figures

Fig 1
Fig 1. Colocalization of Nos1 and Tac2 with excitatory and inhibitory cells in PAG.
(A) Localization of Vglut2, Vgat, Gad2, Nos1, and Tac2 transcripts in PAG using multiplex in situ sequencing (ISS) showed regional patterns consistent with prior single gene in situ hybridization methods. DAPI signal was used to identify isolated cells and assign amplified ISS signals to putative single cells. The location of isolated cells that satisfied quality control criteria are represented by a single dot. (B) Representative images of cells classified as glutamatergic (red arrow), GABAergic (green arrow), Tac2+ (pink arrow), Nos1+ (purple arrow), or unclassified (white arrow). Genes were considered present if they showed at least two high quality (score > 2) spots (Vgat and Gad2 were considered equivalent) that fell within an expanded perimeter of DAPI signal (dotted line). (C) Distribution of co-expression of glutamatergic and GABAergic markers and their co-localization with Nos1 and Tac2 across three replicates in dPAG.
Fig 2
Fig 2. Optogenetic stimulation of dPAG excitatory neurons elicits escape.
(A) Graphical representation of experimental strategy for optogenetic activation of excitatory cells in dPAG and representative histology of virus expression and fibre placement (solid line; SC, superior colliculus; dPAG, dorsal periaqueductal grey; Aq, aqueduct; scale bar, 250 μm). (B) Probability of observing flight upon optical stimulation of Vglut2+ neurons in dPAG with increasing frequency and intensity (ChR2-expressing mice, N = 9, 5 trials per animal). (C) Evoked velocity aligned to flight onset (t = 0) upon optical stimulation at 10 mW at three different frequencies (N = number of trials). (D) Latency to elicit flight following optical stimulation (10 mW). Comparison between low and high frequency showed no significant difference (each blue dot represents a single subject). (E) Representative example of escape to shelter upon light stimulation in a ChR2-expressing animal (t = 0 indicates beginning of stimulation). (F) ChR2-expressing animals showed a short latency to escape to the shelter upon optical stimulation compared to the control group (ChR2 animals: N = 11, YFP animals: N = 6; Mann-Whitney unpaired t test, P = 0.0002). (G) ChR2-expressing animals avoided significantly more the stimulation chamber during the stimulation epoch when compared to YFP-expressing controls (ChR2: N = 11, YFP: N = 8; multiple t-test with Holm Sidak post hoc, t = 6.44, adjusted P < 0.0001). (H) Path of a representative ChR2-expressing animal during the habituation (left) and stimulation (right) epoch in the real-time place preference test; stimulation chamber is on the left.
Fig 3
Fig 3. Projections from dlPAG to the cuneiform nucleus.
(A) Vglut2+ cells in dPAG project to the cuneiform nucleus (CnF) and to the superior lateral parabrachial nucleus (LPBS). Cre-dependent Synaptophysin-iRFP expressing virus was injected in dPAG of a Vglut2::Cre transgenic animal. Sections show synaptic boutons expressing Synaptophysin-iRFP in CnF and LPBS (IC, Inferior Colliculus; Blue, DAPI). (B) Graphical representation of experimental strategy for retrograde labeling with CTB and identification of glutamatergic (Vglut2+) or GABAergic (Gad2+) identity of projection neurons. (C) Cell bodies of CnF afferents in PAG were limited to the dorsolateral column (green, CTB; left, CnF; right, PAG; blue, DAPI; scale bar, 250 μm). (D) CTB label (green) in PAG co-localized with both (left) glutamatergic (red) and (right) GABAergic (red) neurons (scale bar, 50 μm).
Fig 4
Fig 4. Optogenetic stimulation of dPAG neurons that project to CnF elicits goal-directed flight.
(A) Graphical representation of experimental strategy for optogenetic activation of dPAG neurons that project to CnF. (B) Representative histology of Cre-dependent ChR2 expression (green) and fibre placement (solid line) in (left) dPAG and (right) site of retrograde viral injection in CnF (blue; SC, superior colliculus; CnF, cuneiform nucleus; LPB, lateral parabrachial nucleus; IC, inferior colliculus; ll, lateral lemniscus; scale bar, 200 μm). (C) Measured velocity aligned to flight onset at two different frequencies (N = number of trials, 1 trial per animal). (D) Latency to initiate flight from stimulation onset showed no significant difference between low and high frequency (blue dots represent individual subjects). (E) Representative example of escape to the shelter upon stimulation in a ChR2-expressing animal (t = 0 indicates stimulation onset). (F) ChR2-expressing animals showed significantly lower latency to escape in the shelter upon stimulation compared to control animals (N = 4; two-tailed unpaired t test, t (6) = -3.63, *P = 0.0110).

Similar articles

Cited by

References

    1. Mobbs D, Petrovic P, Marchant JL, Hassabis D, Weiskopf N, Seymour B, et al.. When fear is near: Threat imminence elicits prefrontal-periaqueductal gray shifts in humans. Science (1979). 2007;317: 1079–1083. doi: 10.1126/science.1144298 - DOI - PMC - PubMed
    1. LeDoux J. Rethinking the Emotional Brain. Neuron. Cell Press; 2012. pp. 653–676. doi: 10.1016/j.neuron.2012.02.004 - DOI - PMC - PubMed
    1. Silva C, McNaughton N. Are periaqueductal gray and dorsal raphe the foundation of appetitive and aversive control? A comprehensive review. Progress in Neurobiology. Elsevier Ltd; 2019. pp. 33–72. doi: 10.1016/j.pneurobio.2019.02.001 - DOI - PubMed
    1. Tovote P, Esposito MS, Botta P, Chaudun F, Fadok JP, Markovic M, et al.. Midbrain circuits for defensive behaviour. Nature. 2016;534: 206–212. doi: 10.1038/nature17996 - DOI - PubMed
    1. Franklin TB, Silva BA, Perova Z, Marrone L, Masferrer ME, Zhan Y, et al.. Prefrontal cortical control of a brainstem social behavior circuit. Nature Neuroscience. 2017;20: 260–270. doi: 10.1038/nn.4470 - DOI - PMC - PubMed

Publication types

LinkOut - more resources