. 2023 Feb 16;18(2):e0281676.
doi: 10.1371/journal.pone.0281676. eCollection 2023.

Gadolinium-enhanced MRI visualizing backflow at increasing intra-renal pressure in a porcine model

Affiliations

Gadolinium-enhanced MRI visualizing backflow at increasing intra-renal pressure in a porcine model

Søren Kissow Lildal et al. PLoS One. .

Abstract

Introduction: Intrarenal backflow (IRB) is known to occur at increased intrarenal pressure (IRP). Irrigation during ureteroscopy increases IRP. Complications such as sepsis is more frequent after prolonged high-pressure ureteroscopy. We evaluated a new method to document and visualize intrarenal backflow as a function of IRP and time in a pig model.

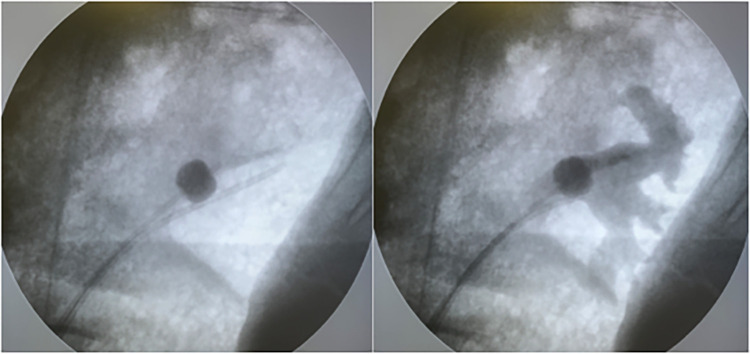
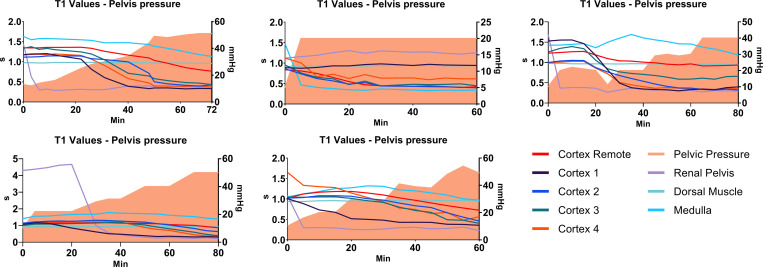
Methods: Studies were performed on five female pigs. A ureteral catheter was placed in the renal pelvis and connected to a Gadolinium/ saline solution 3 ml/L for irrigation. An occlusion balloon-catheter was left inflated at the uretero-pelvic junction and connected to a pressure monitor. Irrigation was successively regulated to maintain steady IRP levels at 10, 20, 30, 40 and 50 mmHg. MRI of the kidneys was performed at 5-minute intervals. PCR and immunoassay analyses were executed on the harvested kidneys to detect potential changes in inflammatory markers.

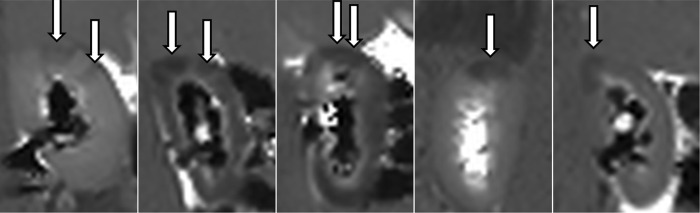
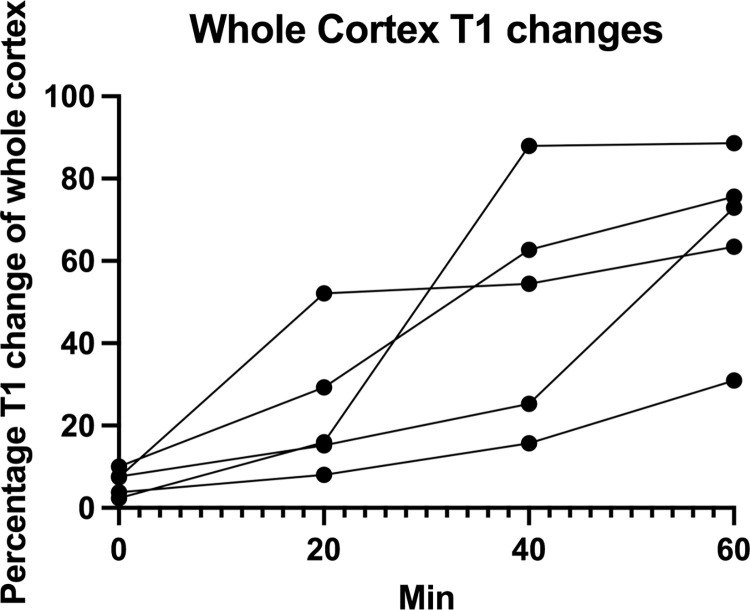
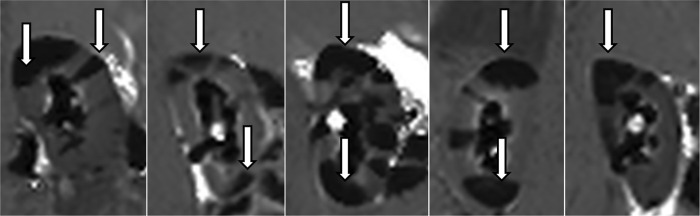
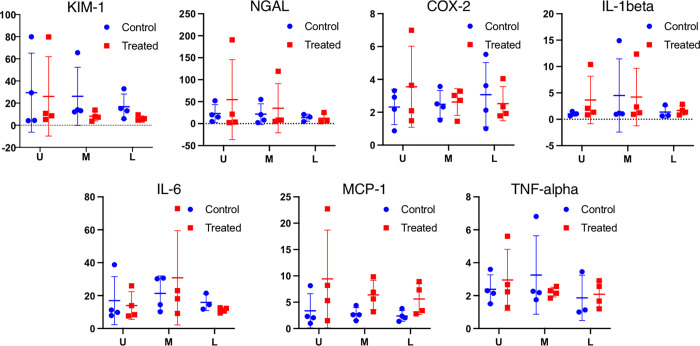
Results: MRI showed backflow of Gadolinium into the kidney cortex in all cases. The mean time to first visual damage was 15 minutes and the mean registered pressure at first visual damage was 21 mmHg. On the final MRI the mean percentage of IRB affected kidney was 66% after irrigation with a mean maximum pressure of 43 mmHg for a mean duration of 70 minutes. Immunoassay analyses showed increased MCP-1 mRNA expression in the treated kidneys compared to contralateral control kidneys.

Conclusions: Gadolinium enhanced MRI provided detailed information about IRB that has not previously been documented. IRB occurs at even very low pressures, and these findings are in conflict with the general consensus that keeping IRP below 30-35 mmHg eliminates the risk of post-operative infection and sepsis. Moreover, the level of IRB was documented to be a function of both IRP and time. The results of this study emphasize the importance of keeping IRP and OR time low during ureteroscopy.


Conflict of interest statement

The authors have declared that no competing interests exist.

Figures

Fig 1
Fig 1. Pyelography.
Placement of ureteral catheter and balloon catheter for occlusion, irrigation and pressure measurement confirmed by fluoroscopic pyelography.
Fig 2
Fig 2. First visual changes.
First MR-scan for each of the 5 animals with visual changes appearing as dark areas (arrows). In animal no. 4 the study was performed on the right kidney due to catheter placement failure on the left side. 1: 22 min—25 mmHg 2: 5 min– 20 mmHg 3: 25 min– 22 mmHg 4: 20 min– 22 mmHg 5: 5 min– 16 mmHg.
Fig 3
Fig 3. Time series MR.
Time series of MR-scans in 1 animal from baseline (0 mins) to end scan (80 mins) showing increased T1 values with rising intraluminal pressure (10 mmhg– 50 mmHg) in the right kidney. 0 min—10 mmHg 20 min– 22 mmHg 40 min– 31 mmHg 60 min– 40 mmHg 80 min– 50 mmHg.
Fig 4
Fig 4. Whole cortex changes.
Fraction of whole cortex T1 changes as a function of time from baseline scan to 60 mins. scan for all 5 experimental animals. The curves are ended at 60 mins. as some of the experiments were ended at this time point. At 60 minutes a mean of 66% of the cortex was affected by intrarenal backflow.
Fig 5
Fig 5. Final MR scan.
Final MR-scan for the 5 animals showing widespread T1 changes as dark areas (arrows) due to increased intraluminal pressure in the treated kidneys. Time range 60–80 mins; pressure range 20–54 mmHg. In animal no. 4 the study was performed on the right kidney due to ureteral catheter placement failure on the left side. 1: 72 min—51 mmHg 2: 60 min– 20 mmHg 3: 80 min– 40 mmHg 4: 80 min– 50 mmHg 5: 60 min– 54 mmHg.
Fig 6
Fig 6. T1 vs accumulated pelvis pressure.
The development of T1 with increasing accumulated pressure (mmHg x min) was assessed by placing ROI’s in different segments of the kidneys, and plotting T1 as function of time x pressure. Left vertical axis: T1; right vertical axis: accumulated pressure; horizontal axis: time. Each graph represents the treated kidney of each of the 5 animals. Cortex remote: visibly non-affected area; cortex 1–4: visibly affected cortical areas; renal pelvis; medulla and dorsal muscle ROIs depicted by lines. Pressure at a given time depicted by colour filled area under the curve. T1 values in affected areas decrease as a function of increasing pressure/time.
Fig 7
Fig 7. PCR and ELISA results.
KIM-1 was not associated with any statical significant difference between the upper (U), mid (M) and lower (P) pole of the kidney (p = 0.044), nor between the ureteroscopically treated and the contralateral kidney (p = 0.18). No statistical significant difference was found between the kidney regions and between the contralateral and the ureteroscopic treated kidney respectively for NGAL (p = 0.38, p = 0.45), COX-2 (p = 0.75,p = 0.75), IL-1beta (p = 0.52,p = 0.42), IL-6 (p = 0.33,p = 0.80) and TNF-alpha (p = 0.65,p = 0.79). MCP-1 was on the other hand found to be statistical significant upregulated in the ureteroscopic treated (p = 0.04), while no regional difference was found (p = 0.55). Y-axis units: KIM-1 and NGAL: ng/ml. COX-2, IL-1beta, IL-6, MCP-1 and TNF-alfa: mRNA expression (qPCR marker/GAPDH ratio).
Fig 8
Fig 8. T1 vs pelvis pressure.
The development of T1 with increasing pressure was assessed by placing ROI’s in different segments of the treated kidneys, and plotting T1 as function of time/pressure. Left vertical axis: T1; right vertical axis: pressure; horizontal axis: time. Each graph represents the treated kidney of each of the 5 animals. Cortex remote: visibly non-affected area; cortex 1–4: visibly affected areas; renal pelvis; medulla and dorsal muscle ROIs depicted by lines. Pressure at a given time depicted by colour filled area under the curve. T1 values in affected areas decrease as a function of increasing pressure/time.

Similar articles

Cited by

References

    1. Cindolo L, Castellan P, Scoffone CM, Cracco CM, Celia A, Paccaduscio A, et al.. (2016) Mortality and flexible ureteroscopy: analysis of six cases. World journal of urology 34 (3):305–310. doi: 10.1007/s00345-015-1642-0 - DOI - PubMed
    1. JC D (1980) Aspects of Renal Pelvic Function. University of Copenhagen, Copenhagen
    1. Kiil F (1953) Pressure recordings in the upper urinary tract. Scandinavian journal of clinical and laboratory investigation 5 (4):383–384. doi: 10.3109/00365515309094217 - DOI - PubMed
    1. Jung H, Osther PJ (2015) Intraluminal pressure profiles during flexible ureterorenoscopy. SpringerPlus 4:373. doi: 10.1186/s40064-015-1114-4 - DOI - PMC - PubMed
    1. Wilson WT PG (1990) Intrarenal pressures generated during flexible deflectable ureterorenoscopy. Journal of endourology / Endourological Society 4:135–142