. 2023 May 1;207(9):1171-1182.
doi: 10.1164/rccm.202207-1384OC.

A Unique Cellular Organization of Human Distal Airways and Its Disarray in Chronic Obstructive Pulmonary Disease

Affiliations

A Unique Cellular Organization of Human Distal Airways and Its Disarray in Chronic Obstructive Pulmonary Disease

Samir Rustam et al. Am J Respir Crit Care Med. .

Abstract

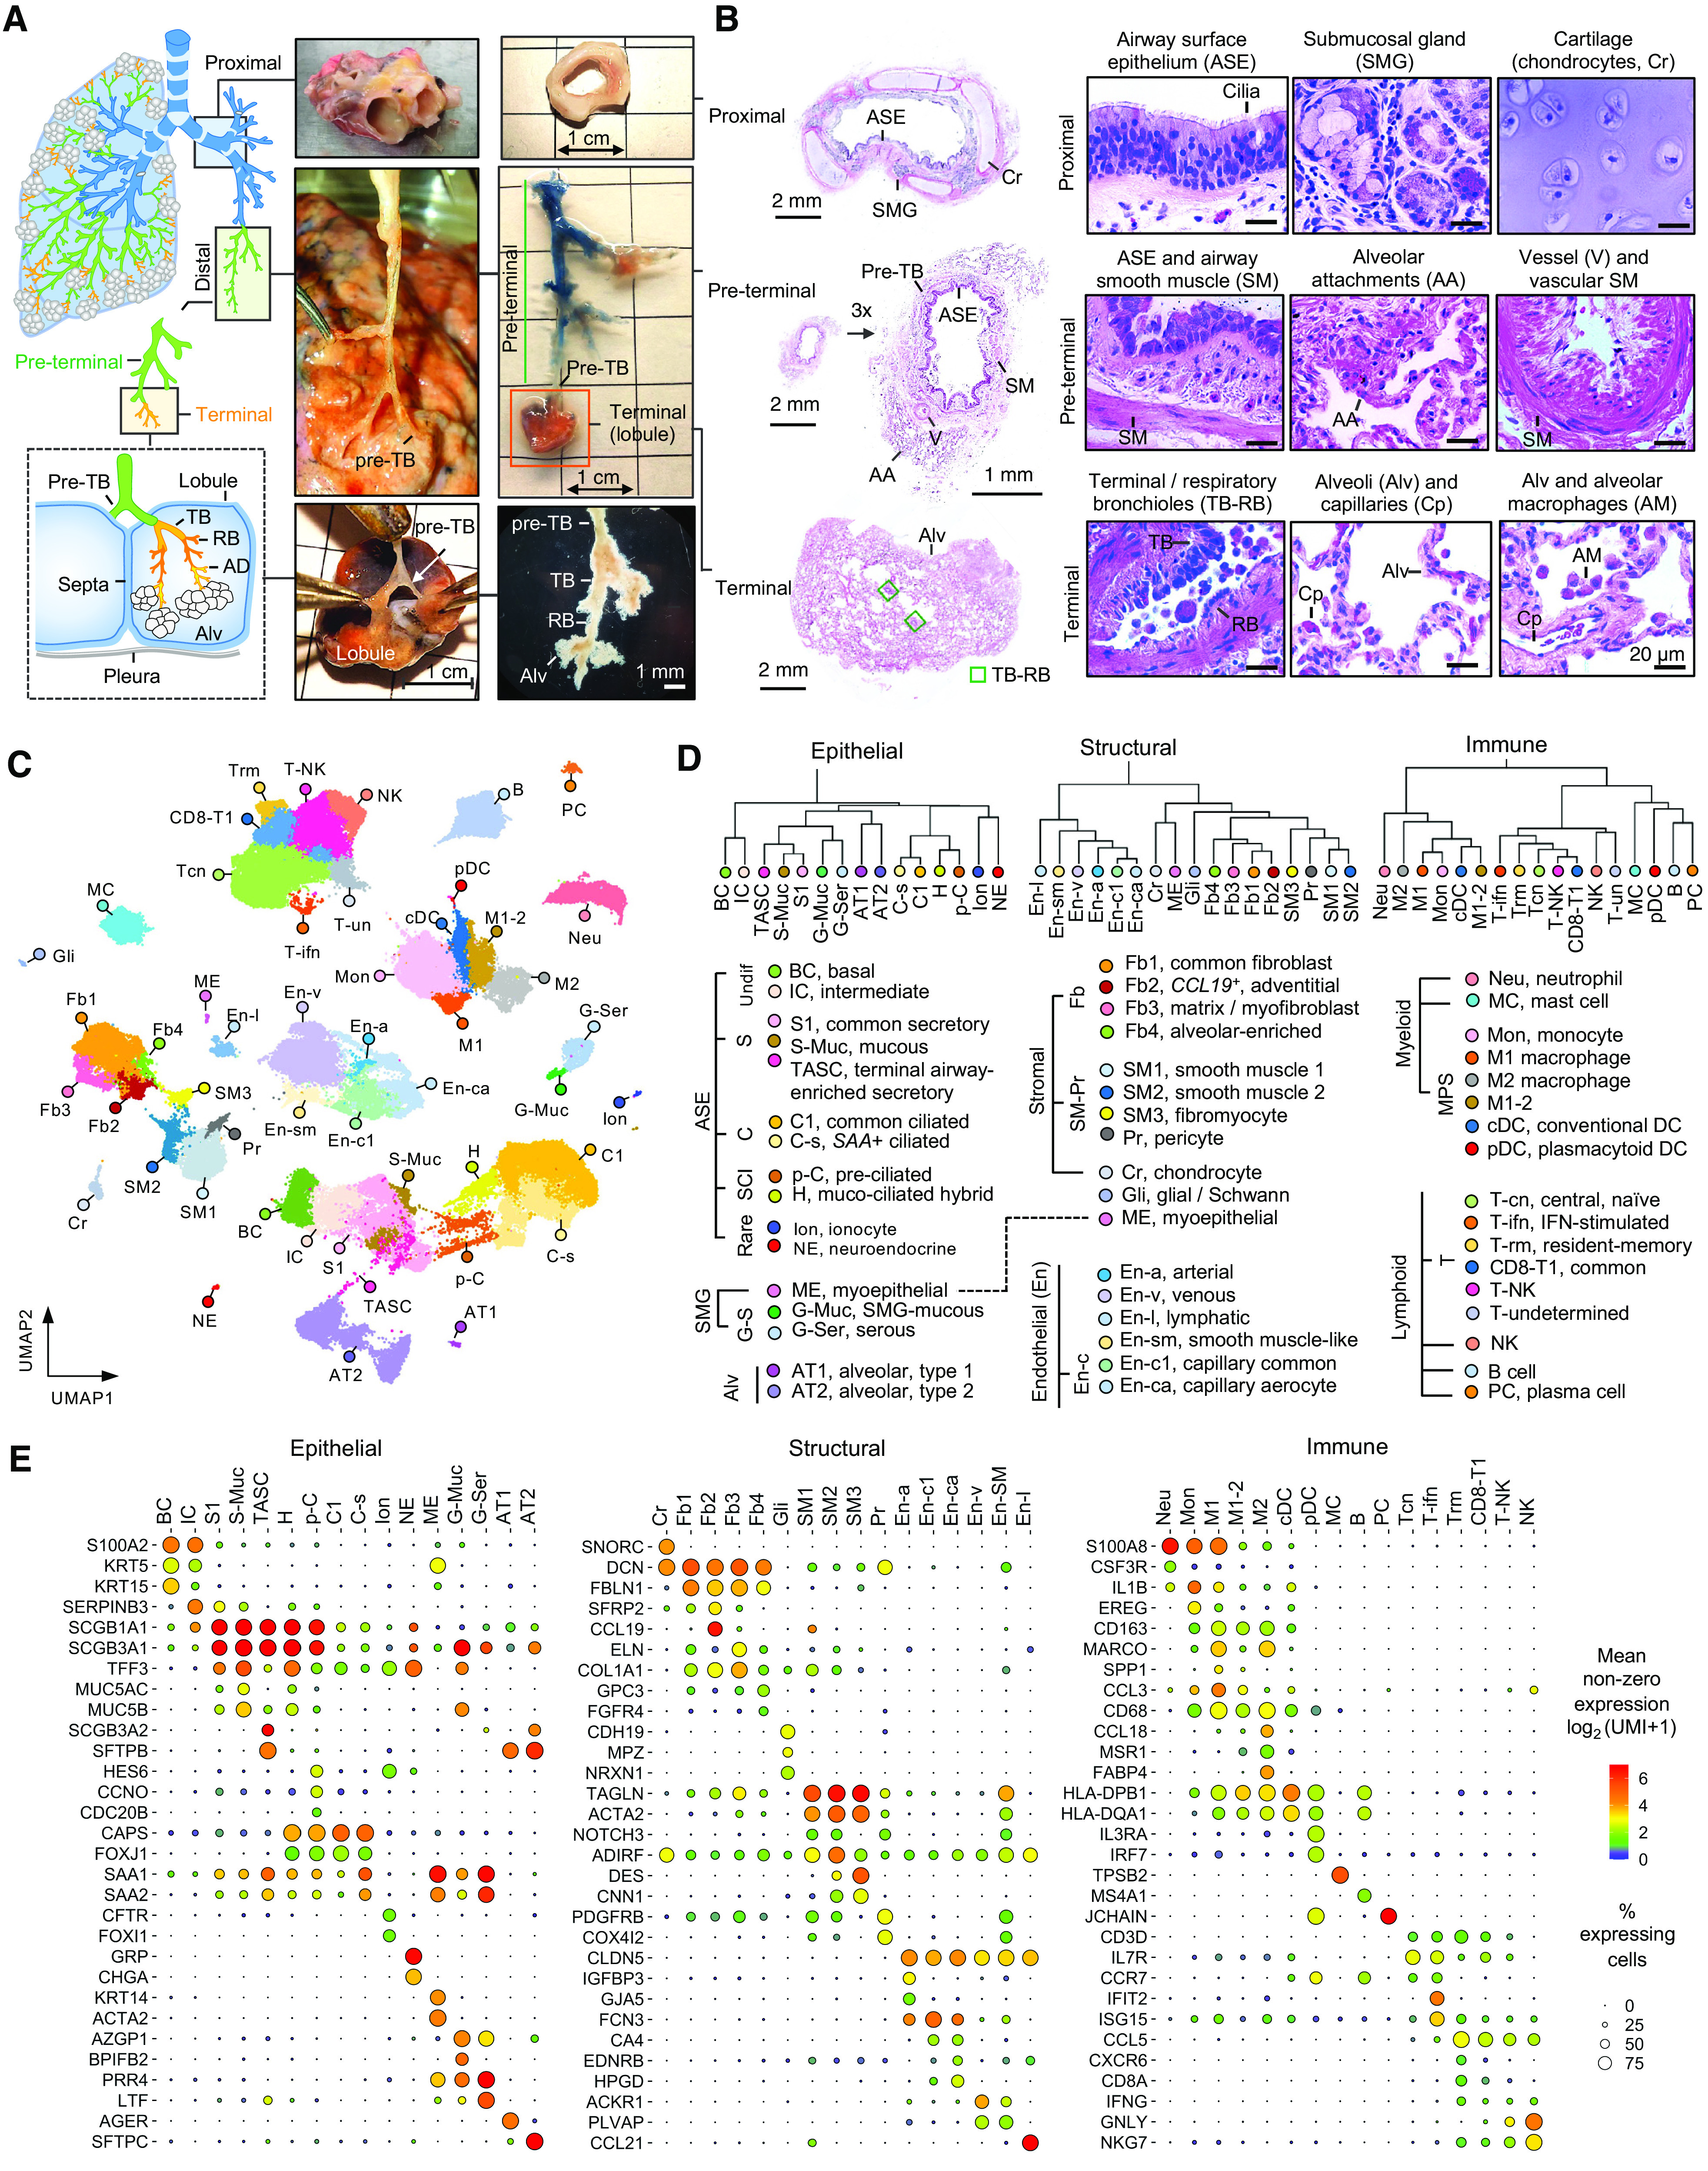
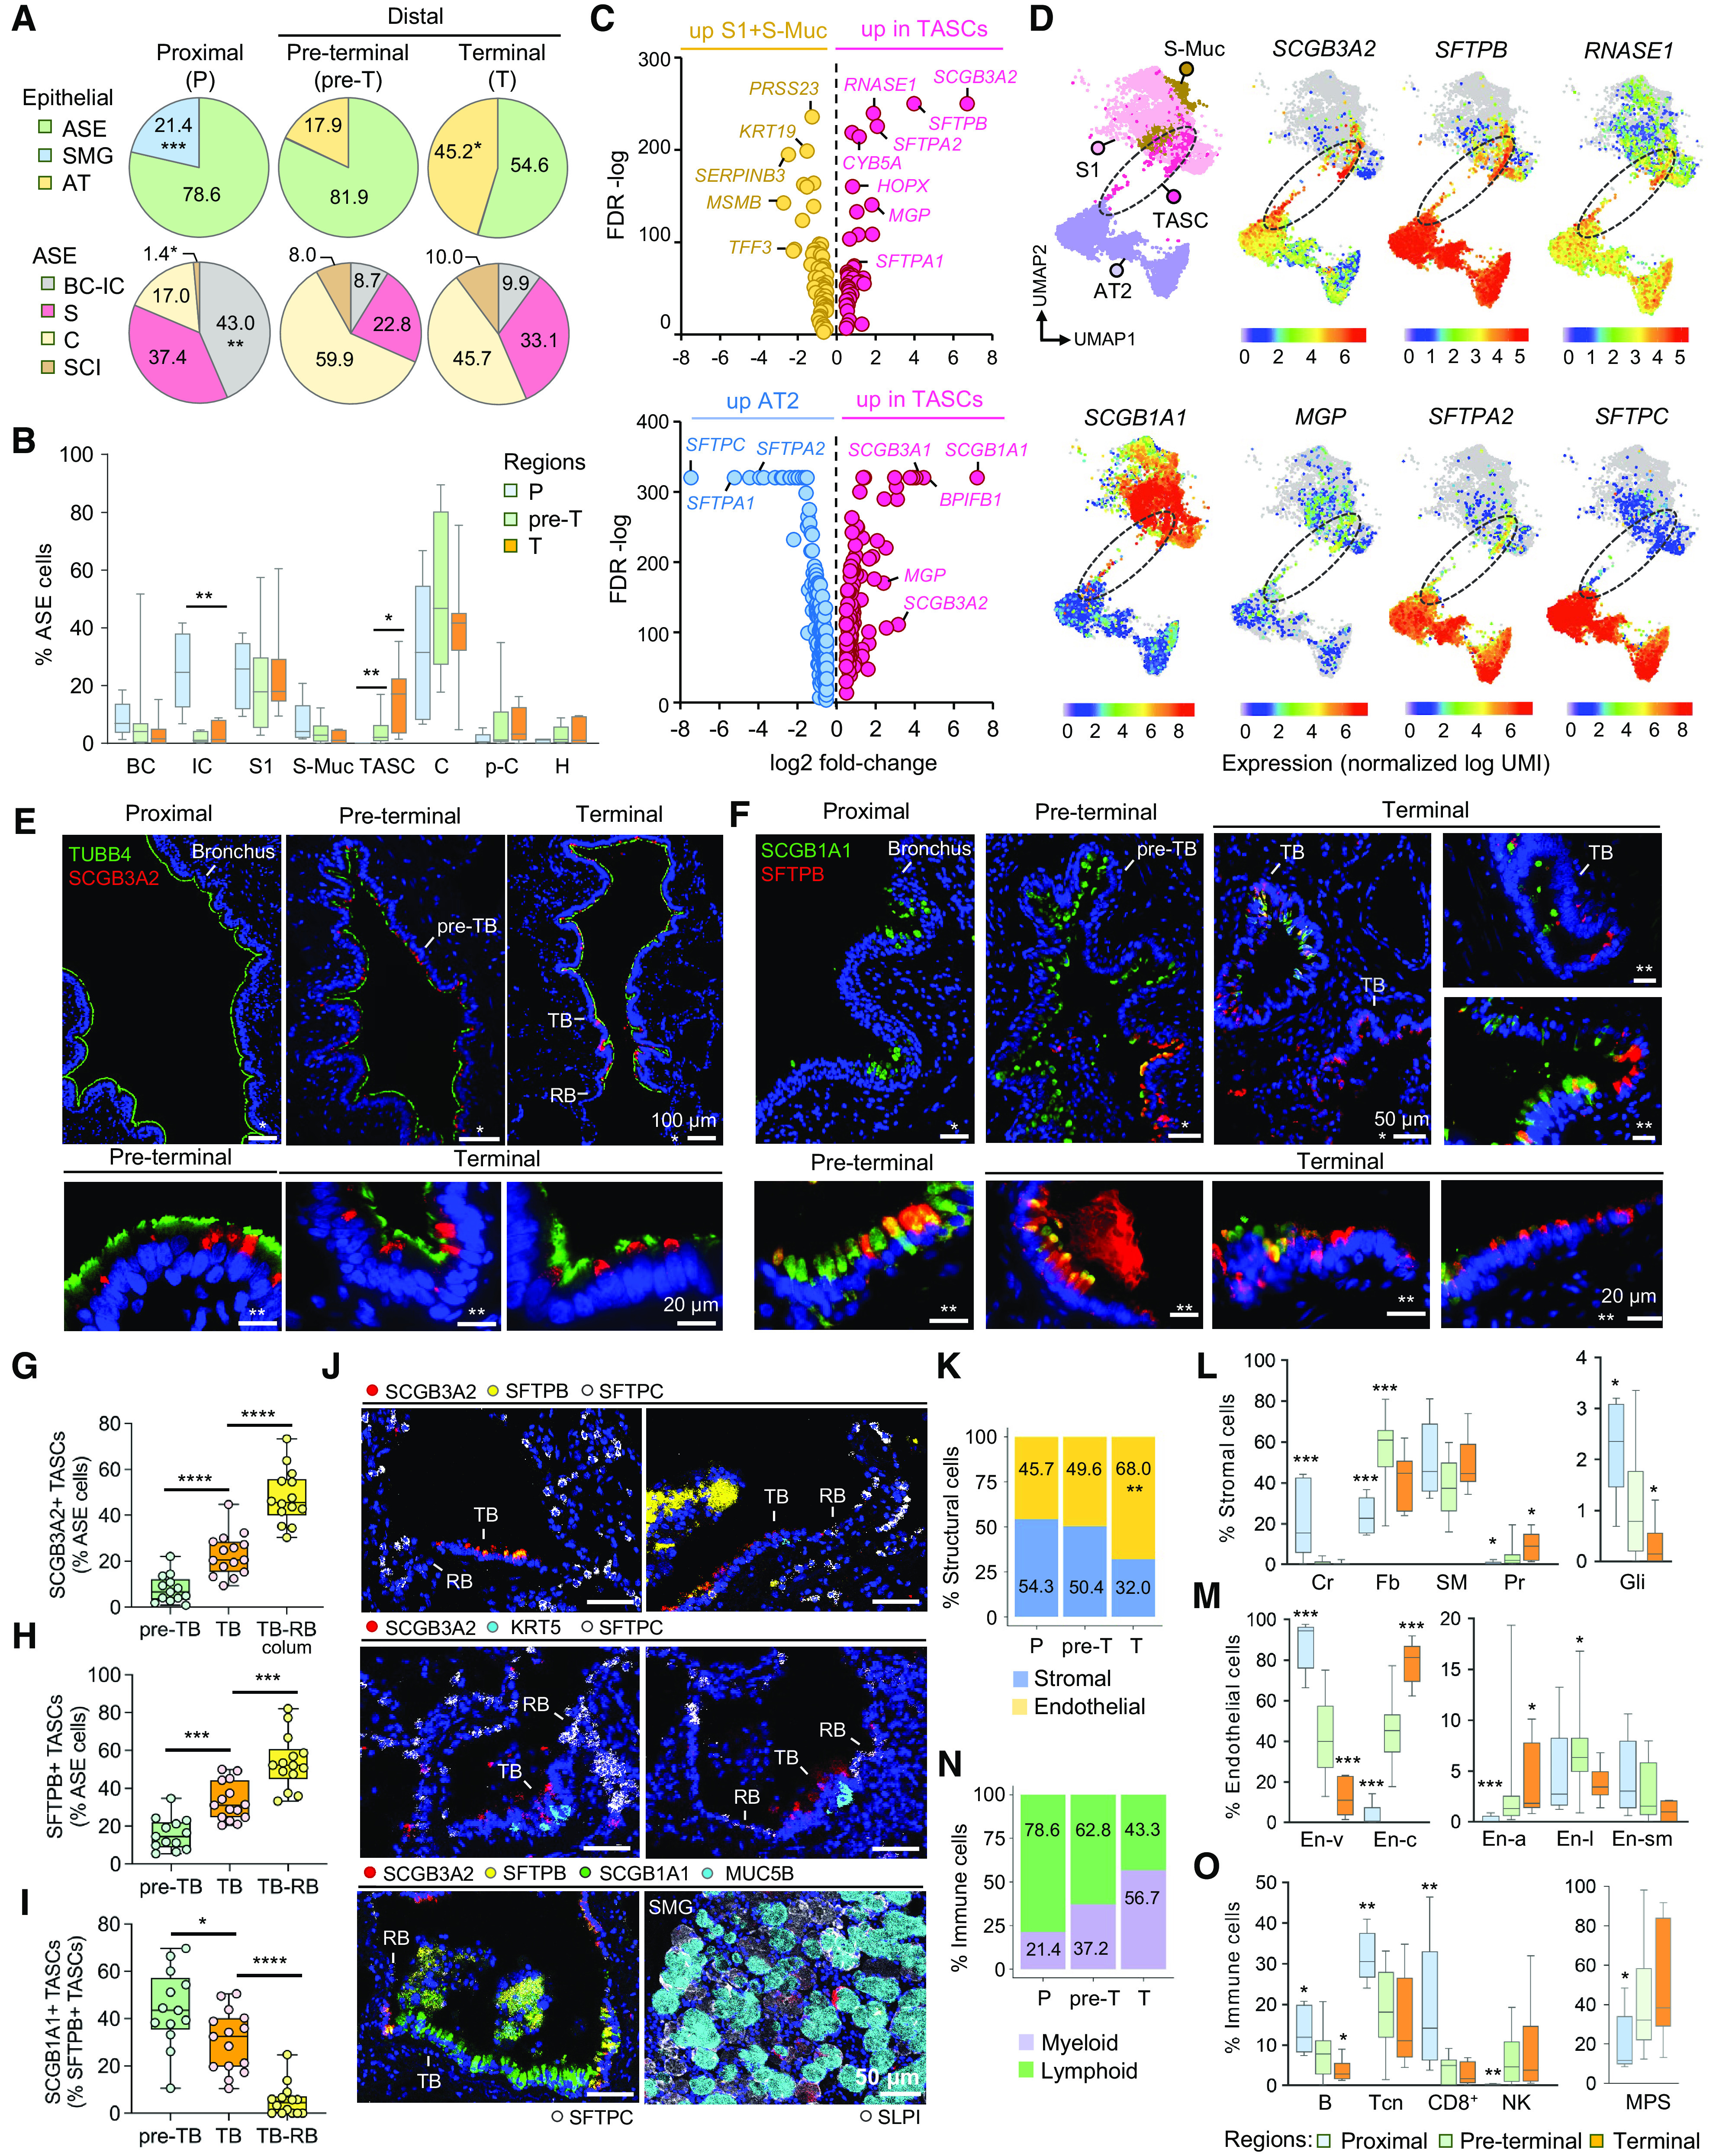
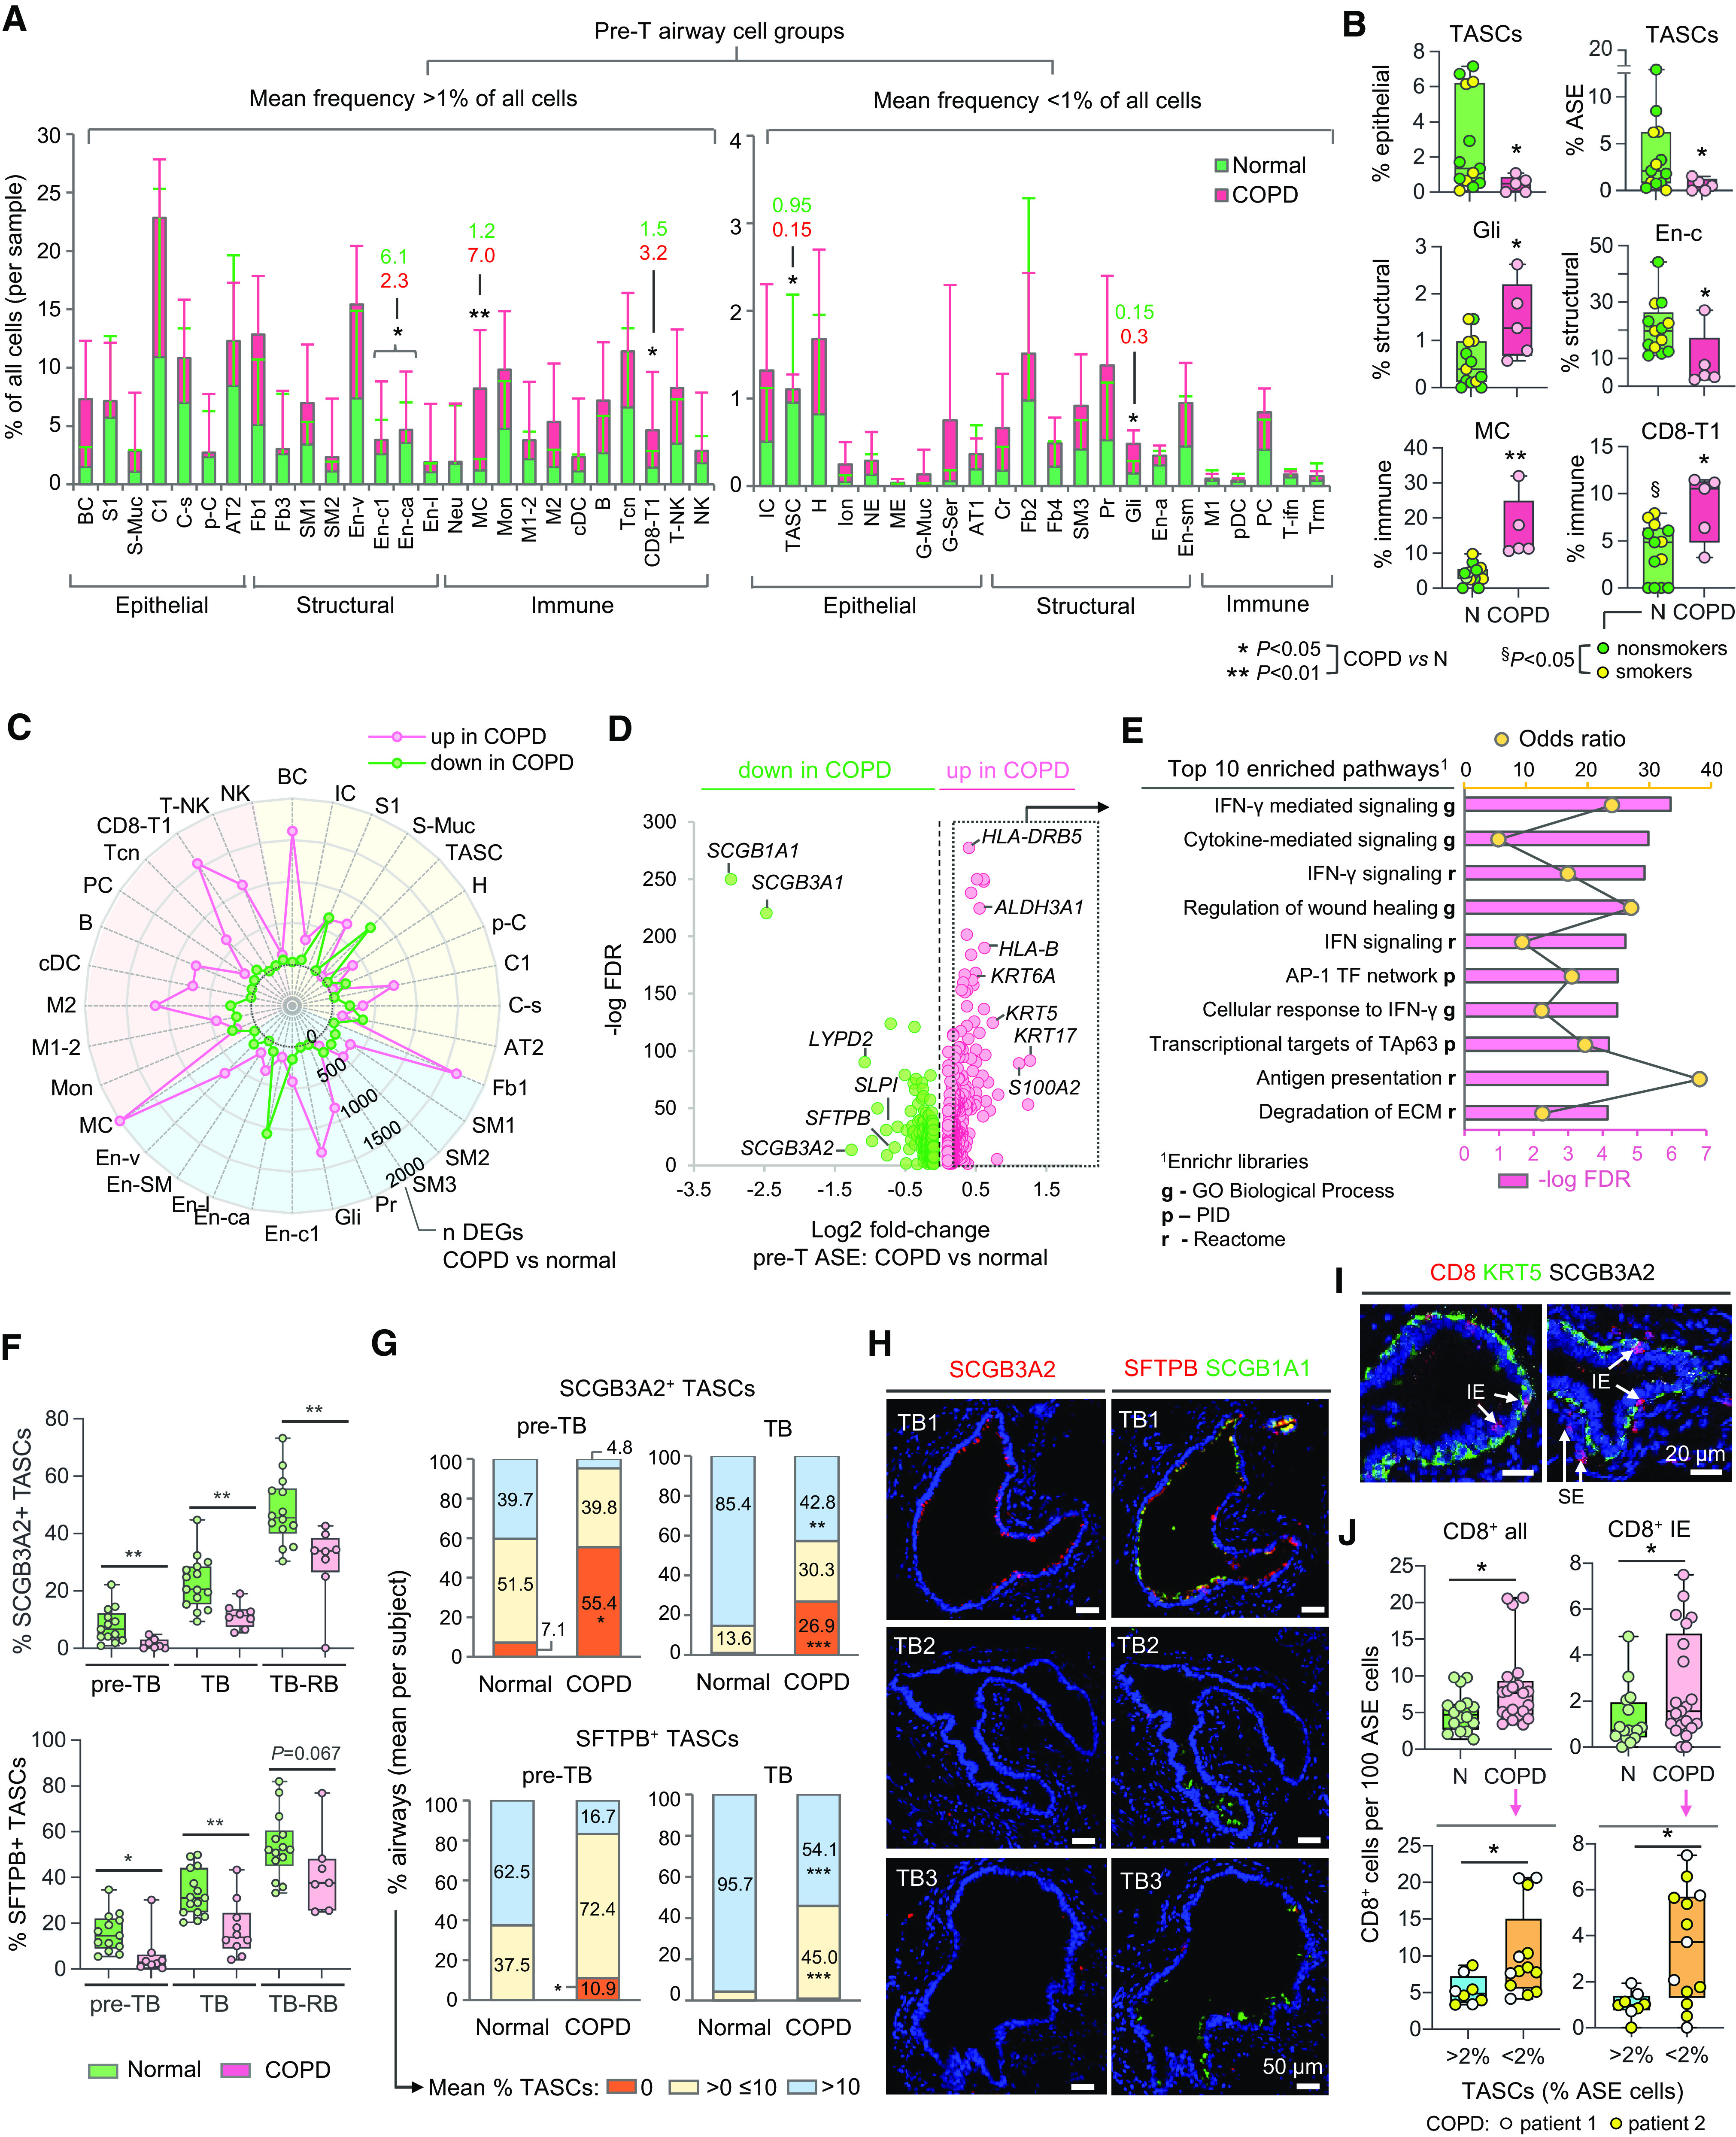
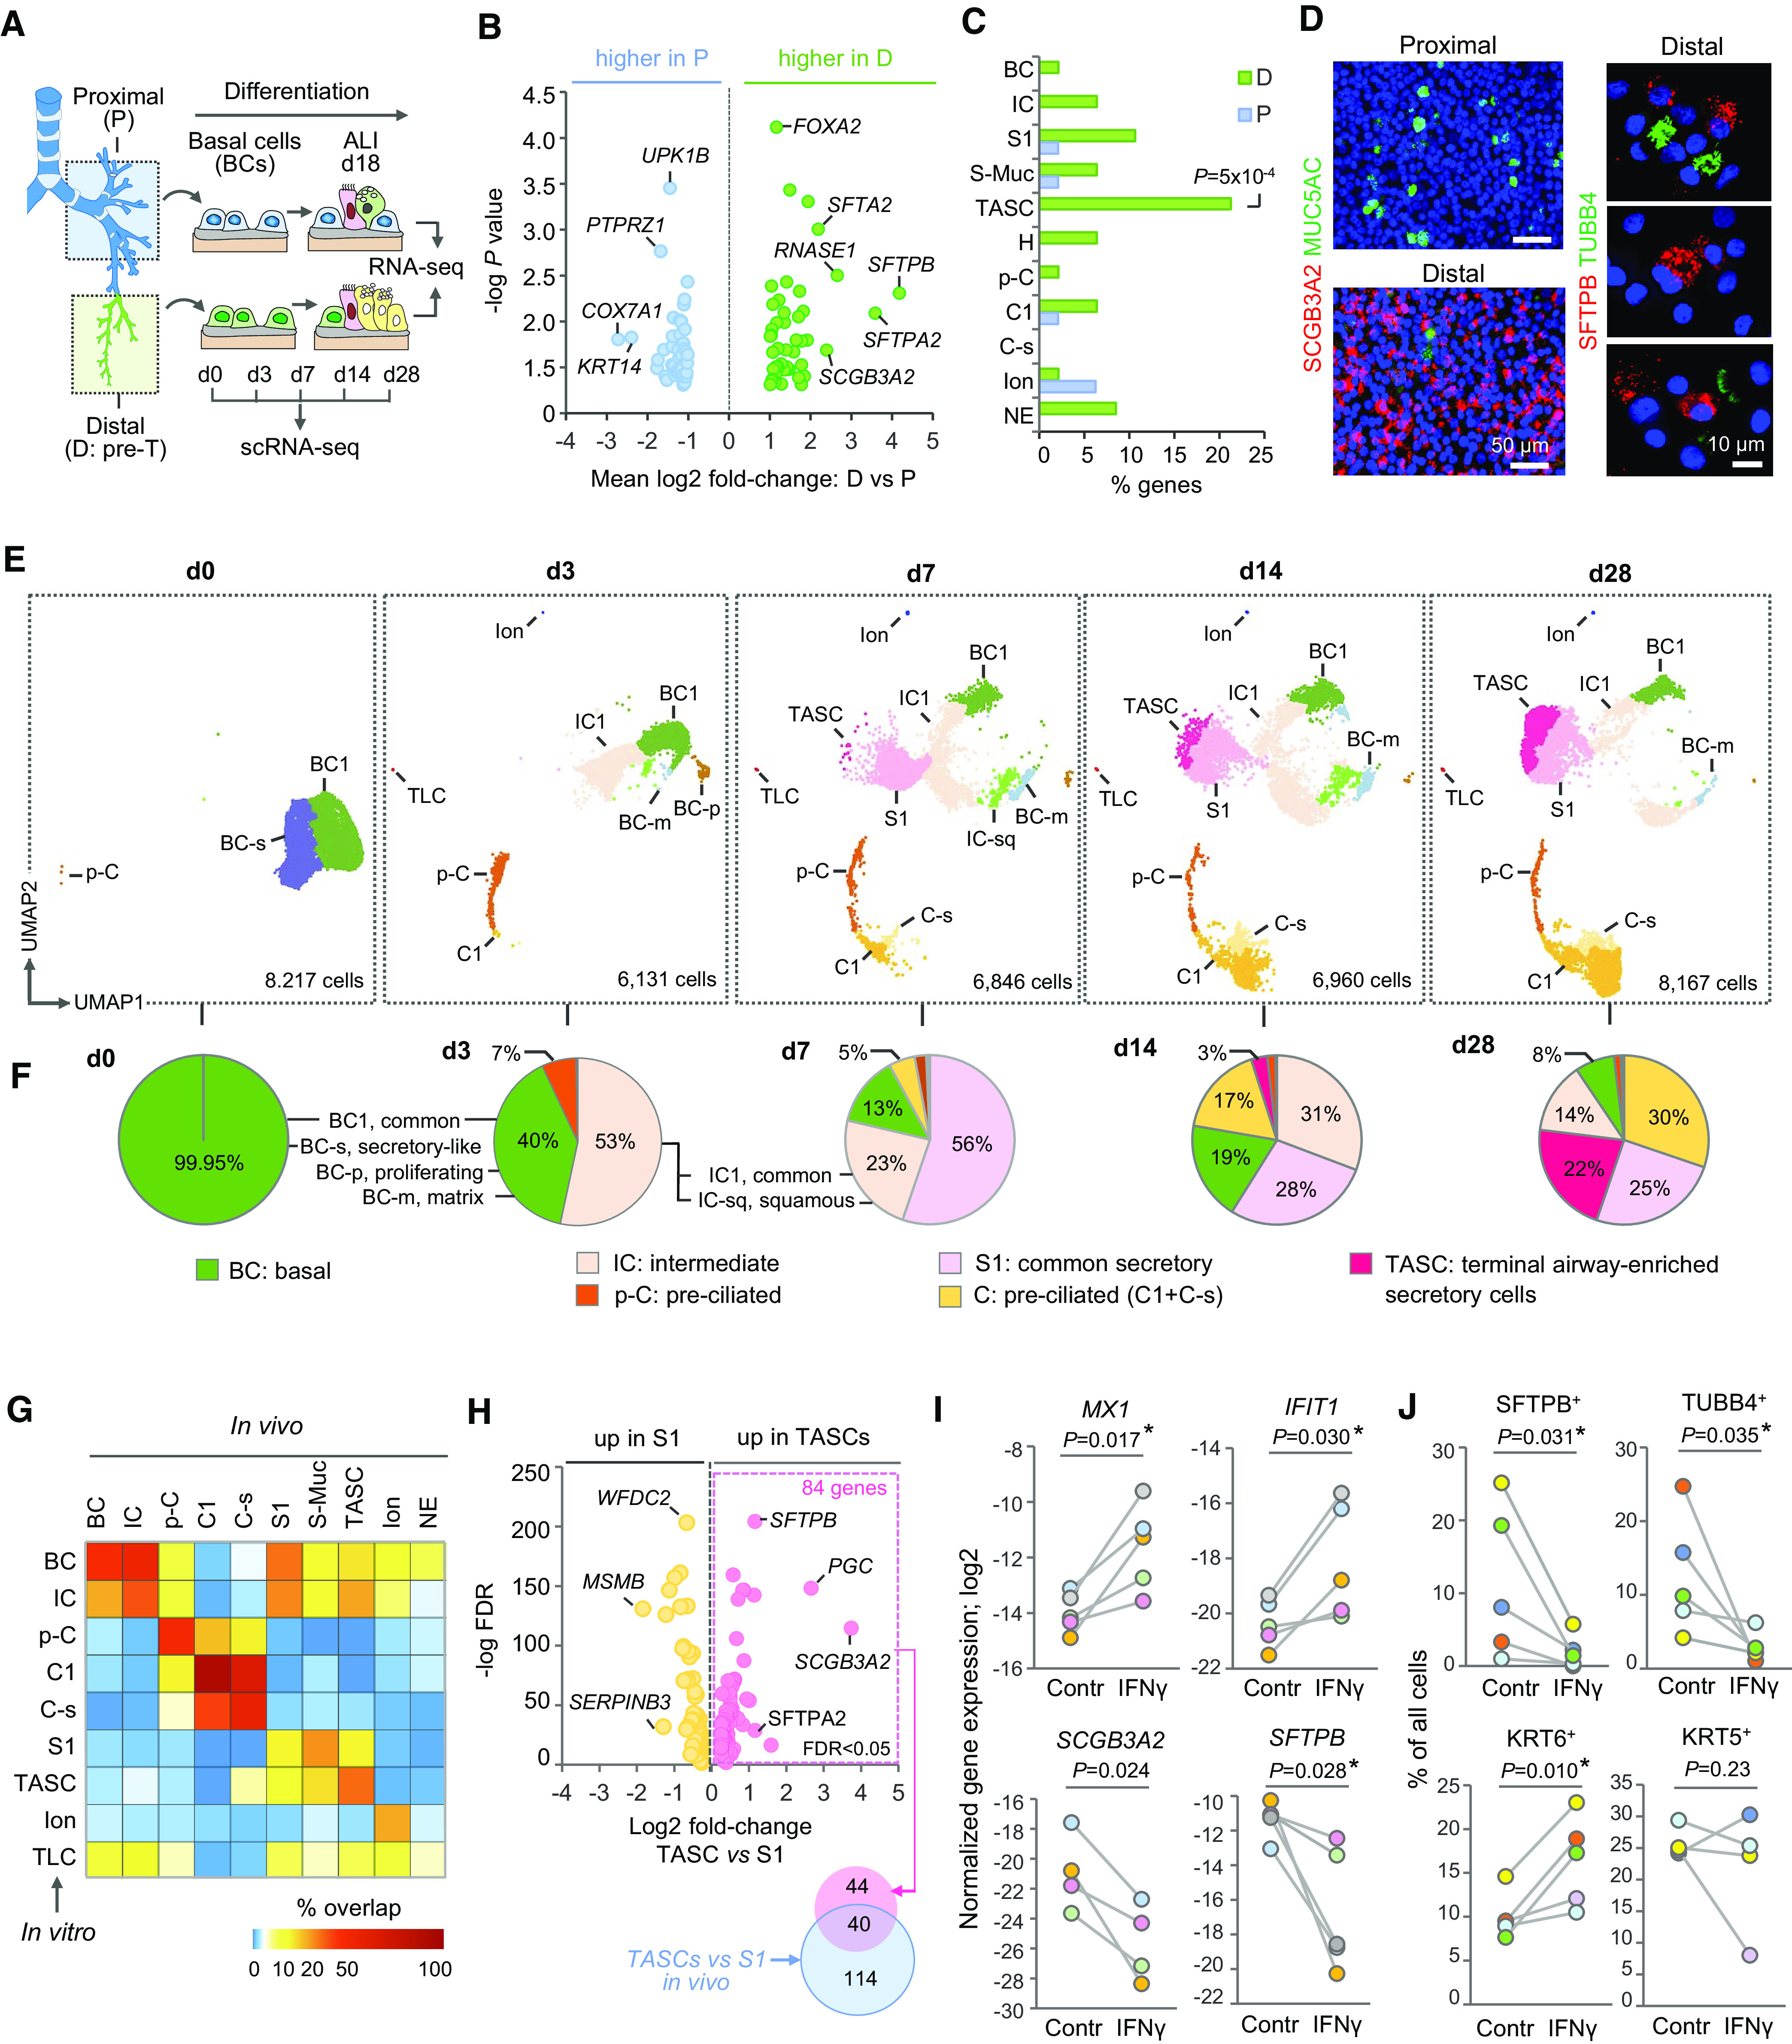
Rationale: Remodeling and loss of distal conducting airways, including preterminal and terminal bronchioles (pre-TBs/TBs), underlie progressive airflow limitation in chronic obstructive pulmonary disease (COPD). The cellular basis of these structural changes remains unknown. Objectives: To identify biological changes in pre-TBs/TBs in COPD at single-cell resolution and determine their cellular origin. Methods: We established a novel method of distal airway dissection and performed single-cell transcriptomic profiling of 111,412 cells isolated from different airway regions of 12 healthy lung donors and pre-TBs of 5 patients with COPD. Imaging CyTOF and immunofluorescence analysis of pre-TBs/TBs from 24 healthy lung donors and 11 subjects with COPD were performed to characterize cellular phenotypes at a tissue level. Region-specific differentiation of basal cells isolated from proximal and distal airways was studied using an air-liquid interface model. Measurements and Main Results: The atlas of cellular heterogeneity along the proximal-distal axis of the human lung was assembled and identified region-specific cellular states, including SCGB3A2+ SFTPB+ terminal airway-enriched secretory cells (TASCs) unique to distal airways. TASCs were lost in COPD pre-TBs/TBs, paralleled by loss of region-specific endothelial capillary cells, increased frequency of CD8+ T cells normally enriched in proximal airways, and augmented IFN-γ signaling. Basal cells residing in pre-TBs/TBs were identified as a cellular origin of TASCs. Regeneration of TASCs by these progenitors was suppressed by IFN-γ. Conclusions: Altered maintenance of the unique cellular organization of pre-TBs/TBs, including loss of the region-specific epithelial differentiation in these bronchioles, represents the cellular manifestation and likely the cellular basis of distal airway remodeling in COPD.

Keywords: bronchiole; epithelium; heterogeneity; regeneration; remodeling.


Figures

Figure 1.
Figure 1.
The atlas of cellular diversity along the proximal (P)–distal (D) airway axis of human lung. (A) Anatomy and examples of dissected P and D airway regions of the human lung. D region included preterminal (pre-T) and terminal (T) regions separated by preterminal bronchioles (pre-TBs). Pre-T region included pre-TBs and three or four generations proximal to pre-TBs. T region included segments within the lobule supplied by pre-TBs: TBs, respiratory bronchioles (RBs), alveolar ducts (ADs), and alveoli (Alv). Lower left image shows T region inspected under dissection microscope. (B) Examples of hematoxylin and eosin staining of dissected P, pre-T, and T regions. Histological landmarks are shown. (C) Uniform Manifold Approximation and Projection (UMAP) clustering of 111,744 single cells isolated from P (n = 5), pre-T (n = 13), and T (n = 7) regions of healthy lungs and pre-T airways of subjects with COPD (n = 5). (D) Dendrograms based on hierarchical clustering of cell groups identified in C based on top 2,000 variable genes using Spearman correlation and complete linkage algorithm. Specific cell groups within epithelial, structural, and immune superfamilies are shown. (E) Dot plots showing expression of selected marker genes in indicated cell groups. Dot size reflects percentage of cells within a group expressing a given gene. Dot color shows mean expression level as indicated.
Figure 2.
Figure 2.
Region-specific cellular heterogeneity along the bronchoalveolar axis. (A) Proportions (percentages) of cells belonging to indicated families within epithelial superfamily (upper; airway surface epithelium [ASE]; SMG; alveolar epithelium): average percentage of cells per sample in indicated regions of normal lungs and in ASE family as described in Figure 1D. (B) Average percentage of cells belonging to indicated cell types (per sample as described in A) within ASE in different regions. (C) Volcano plots (based on single-cell RNA-sequencing data) showing differentially expressed genes (DEGs) identified by comparing all (upper) terminal airway-enriched secretory cells (TASCs) and other S (S1 and S-Muc) cells and (lower) TASCs and alveolar type 2 (AT2) cells. DEGs shown with false discovery rate <0.01 and log2 fold change greater than 0.5 or less than −0.5. (D) Portion of the Uniform Manifold Approximation and Projection (UMAP) graph shown in Figure 1C. A clustering region where TASCs form a bridge between S and AT2 cells is demarcated (dashed line). Expression of selected DEGs identified in the analysis shown in C is color mapped. (E, F) Immunofluorescence (IF) images showing expression of (E) SCGB3A2 and tubulin β4 (TUBB4; cilia marker) and (F) SFTPB and SCGB1A1 (S1 cell marker) in indicated regions. (G–I) Percentage of (G) SCGB3A2+ TASCs, (H) SFTPB+ TASCs among ASE cells, and (I) SCGB1A1+ cells among SFTPB+ TASCs in indicated regions. TB-RB, simple epithelium (colum, columnar) in TB–RB transition areas. (J) Representative CyTOF images showing expression of indicated markers in different regions. (K) Proportions of structural cell families (average percentage of cells per sample) in different regions. (L, M) Average percentage of indicated cell types (per sample; as described in A; cell type names as described in Figure 1D) within stromal (L) and endothelial (En; M) cell families. (N) Proportions of cells representing immune families (average percentage of cells per sample) in different regions. (O) Average percentage of indicated cell types (per sample; as described in A; cell type names as described in Figure 1D) in different regions. (A, B, G–I, K–O) *P < 0.05, **P < 0.01, ***P < 0.005, and ****P < 0.0001 (two-tailed Mann-Whitney test) versus other or indicated regions. CyTOF = cytometry by time of flight; RBs = respiratory bronchioles; SMG = submucosal gland; TB = terminal bronchioles.
Figure 3.
Figure 3.
Changes in cellular organization of chronic obstructive pulmonary disease (COPD) distal airways. (A, B) Proportions (percentages) of indicated cell groups (single-cell RNA-sequencing [scRNA-seq] data; abbreviations described in Figure 1D) in pre-terminal (pre-T) airway samples of donors without lung disease (normal; n = 13) and subjects with COPD (n = 5): (A) Mean percentage of cells in indicated cell groups among all cells per sample (values are shown for cell groups with significant differences between the groups). Error bars represent standard deviation. (B) Mean percentage of cells in indicated cell groups among all cells per sample within superfamilies (dots: individual samples). (C) Radar plot showing numbers of differentially expressed genes (DEGs) identified by comparing scRNA-seq average gene expression profiles of indicated cell groups in pre-T samples (COPD vs. normal) described in A. Criteria for cell types/subtype inclusion: >10 cells in each group (normal; COPD); at least 3 cells in >50% samples in each group. Colored areas: epithelial (yellow), structural (blue), and immune (red) superfamilies. Dots show numbers of DEGs up- or downregulated in COPD versus normal samples (Mann-Whitney P < 0.05). (D) Volcano plot showing DEGs (false discovery rate <0.05) identified by comparison of scRNA-seq average expression profiles of airway surface epithelial (ASE) cells in COPD versus normal pre-T samples described in A. (E) Top 10 annotation categories among Gene Ontology (GO) Biological Process; Reactome and NCI-Nature Pathway Interaction database (PID) libraries enriched among DEGs upregulated in ASE of COPD versus normal pre-T samples (log2 fold change >0.2); ranked by −log false discovery rate of enrichment; based on Enrichr analysis. (F–H) Immunofluorescence analysis. (F) Mean percentage of SCGB3A2+ (upper) and SFTPB+ (lower) terminal airway-enriched secretory cells (TASCs) per subject among ASE cells in preterminal bronchiole (pre-TB), TB, and TB-RB (defined as in Figures 2G–2I) of healthy lung donors and subjects with COPD. Dots represent individual subjects (see Table E2 for details). (G) Distribution of distal airways (pre-TBs and TBs) in healthy and COPD lung tissue samples (described in F) based on average percentage of SCGB3A2+ (upper) and SFTPB+ (lower) cells in the ASE (per subject). (H) Representative immunofluorescence images showing SCGB3A2+ TASCs, SFTPB+ TASCs, and SCGB1A1 expression in different TBs of the same COPD patient’s lung. (I, J) Imaging CyTOF. (I) Representative images showing CD8+ cells (intraepithelial [IE]; subepithelial [SE]) in distal airways (pre-TBs/TBs) of patients with COPD; KRT5, keratin 5; SCGB3A2 (white). (J) Frequency of all (left) and IE (right) CD8+ cells in distal airways of normal (N; n = 3; 16 airways) and COPD (n = 2; 21 airways) subjects (upper panel); shown separately in the lower panel for COPD distal airways with TASC frequency: >2% and <2% of epithelial cells. *P < 0.05, **P < 0.01, ***P < 0.005 (two-tailed Mann-Whitney test) COPD versus normal (A, B, F, G, and J, upper), and §P < 0.05 normal lung donors: smokers versus nonsmokers (two-tailed Mann-Whitney test) in B; COPD distal airways with TASC frequency >2% versus <2% of epithelial cells (J, lower). CyTOF = cytometry by time of flight; RB = respiratory bronchioles.
Figure 4.
Figure 4.
Distal airway basal cells (BCs) as the cellular origin of terminal airway-enriched secretory cells (TASCs). (A) Design of in vitro studies. BCs isolated from proximal (P) and distal (D; pre-terminal [pre-T]) airways were cultured under the same conditions in the Transwell system. After BCs established a confluent layer, apical medium was removed to establish an air–liquid interface (ALI), and medium was supplied from the basolateral side. Samples were analyzed at indicated ALI time points representing different stages of BC differentiation. (B) Volcano plot: Differentially expressed genes (DEGs) identified by comparison of ALI day 18 epithelia generated by BCs from P and D airways of six normal lung donors (shown DEGs with log2 fold change >1 and two-tailed paired t test; P < 0.05). (C) Proportions (percentages) of DEGs upregulated in ALI day 18 samples generated by BCs from matched P and D airways overlapping with marker genes of indicated pre-T airway surface epithelial (ASE) cell types based on single-cell RNA-sequencing analysis (criteria: log2 fold change >1; false discovery rate [FDR] <0.05). (D) Immunofluorescence staining of the apical surface of ALI day 18 epithelia generated by BCs from P and D airways (left) and cytopreps of ALI day 17 epithelia generated by D airway BCs (right); blue: DAPI (nuclei). (E) Uniform Manifold Approximation and Projection (UMAP) clustering of cells at indicated time points of ALI culture of the same D airway BC sample; total number of single cells captured at each time point is indicated. (F) Percentage of cell types at ALI time points shown in E. TLCs, tuft-like cells. (G) Heatmap: Percentage of DEGs of indicated ASE cell types in vivo overlapping with those identified for cell types in ALI day 28 epithelia derived from D airway BCs shown in E using the same criteria: FDR <0.05; log2 fold change >0.5 versus other ASE cells. (H) Volcano plot: DEGs (FDR <0.05) identified by comparison of TASCs and S1 cells in ALI day 28 epithelia generated by D airway BCs (shown in E); right side: overlap between DEGs upregulated in TASCs versus S1 in vitro and those identified in the same comparison in vivo. (I) Log2 normalized expression of indicated genes detected by qPCR and (J) percentage of cells expressing indicated markers detected by immunofluorescence in ALI day 17–40 epithelia generated by D airway BCs in the absence (Contr) or presence of 5 ng/ml IFN-γ. Dot colors mark independent samples; P values based on paired t test (two-tailed in I; *Wilcoxon test <0.05 for n > 4 in I and J); see details in Figure E10D.

Comment in

References

    1. Haefeli-Bleuer B, Weibel ER. Morphometry of the human pulmonary acinus. Anat Rec . 1988;220:401–414. - PubMed
    1. Reid L. The secondary lobule in the adult human lung, with special reference to its appearance in bronchograms. Thorax . 1958;13:110–115. - PMC - PubMed
    1. Webb WR. Thin-section CT of the secondary pulmonary lobule: anatomy and the image—the 2004 Fleischner Lecture. Radiology . 2006;239:322–338. - PubMed
    1. Hogg JC, Chu F, Utokaparch S, Woods R, Elliott WM, Buzatu L, et al. The nature of small-airway obstruction in chronic obstructive pulmonary disease. N Engl J Med . 2004;350:2645–2653. - PubMed
    1. McDonough JE, Yuan R, Suzuki M, Seyednejad N, Elliott WM, Sanchez PG, et al. Small-airway obstruction and emphysema in chronic obstructive pulmonary disease. N Engl J Med . 2011;365:1567–1575. - PMC - PubMed

Publication types