. 2023 May:61:102630.
doi: 10.1016/j.redox.2023.102630. Epub 2023 Feb 8.

Decreased expression of mitochondrial aminoacyl-tRNA synthetases causes downregulation of OXPHOS subunits in type 2 diabetic muscle

Affiliations

Decreased expression of mitochondrial aminoacyl-tRNA synthetases causes downregulation of OXPHOS subunits in type 2 diabetic muscle

Iliana López-Soldado et al. Redox Biol. 2023 May.

Abstract

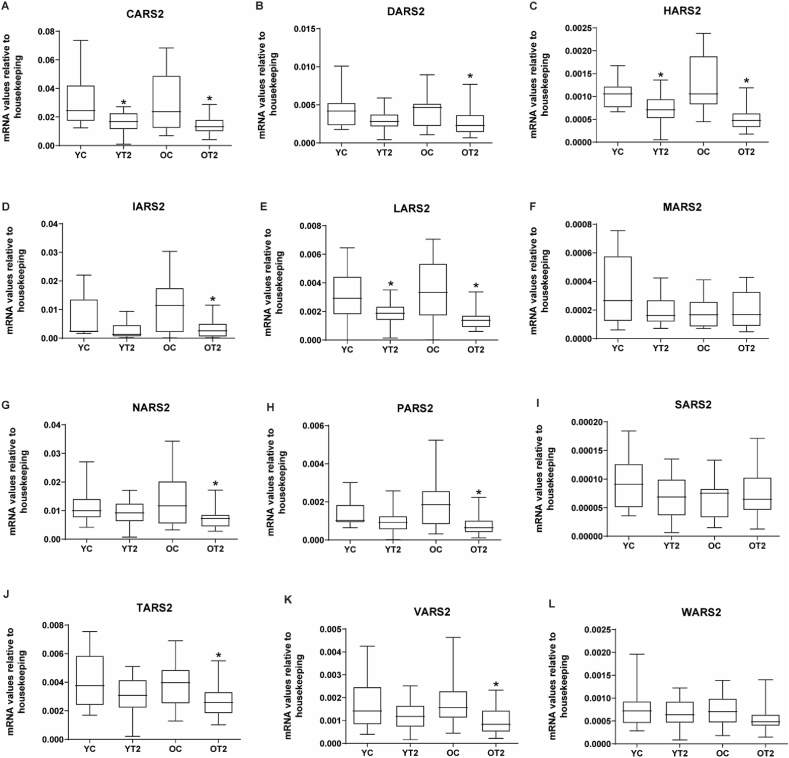
Type 2 diabetes mellitus (T2D) affects millions of people worldwide and is one of the leading causes of morbidity and mortality. The skeletal muscle (SKM) is one of the most important tissues involved in maintaining glucose homeostasis and substrate oxidation, and it undergoes insulin resistance in T2D. In this study, we identify the existence of alterations in the expression of mitochondrial aminoacyl-tRNA synthetases (mt-aaRSs) in skeletal muscle from two different forms of T2D: early-onset type 2 diabetes (YT2) (onset of the disease before 30 years of age) and the classical form of the disease (OT2). GSEA analysis from microarray studies revealed the repression of mitochondrial mt-aaRSs independently of age, which was validated by real-time PCR assays. In agreement with this, a reduced expression of several encoding mt-aaRSs was also detected in skeletal muscle from diabetic (db/db) mice but not in obese ob/ob mice. In addition, the expression of the mt-aaRSs proteins most relevant in the synthesis of mitochondrial proteins, threonyl-tRNA, and leucyl-tRNA synthetases (TARS2 and LARS2) were also repressed in muscle from db/db mice. It is likely that these alterations participate in the reduced expression of proteins synthesized in the mitochondria detected in db/db mice. We also document an increased iNOS abundance in mitochondrial-enriched muscle fractions from diabetic mice that may inhibit aminoacylation of TARS2 and LARS2 by nitrosative stress. Our results indicate a reduced expression of mt-aaRSs in skeletal muscle from T2D patients, which may participate in the reduced expression of proteins synthesized in mitochondria. An enhanced mitochondrial iNOS could play a regulatory role in diabetes.

Keywords: Mitochondrial aminoacyl tRNA synthetases; Nitric oxide; Nitrosative stress; OXPHOS; Skeletal muscle; Type 2 diabetes.


Conflict of interest statement

Declaration of competing interest The authors are not affected by any conflict of interest.

Figures

Image 1
Graphical abstract
Fig. 1
Fig. 1
Identification of the downregulated aminoacyl-tRNA synthetases gene expression in early-onset and classical forms of type 2 diabetes. (A) The enrichment gene set expression of the aminocyl-tRNA synthetases. (B) Fold change OT2 vs OC of the main mitochondrial (identified with number 2) and cytosolic aminoacyl-tRNA synthetases.
Fig. 2
Fig. 2
Skeletal muscle gene expression of mitochondrial tRNA synthetases in early-onset type 2 diabetic subjects (YT2) and late-onset type 2 diabetic subjects (OT2) and their respective matched control groups (YC and OC). Real-time PCR was performed in skeletal muscle biopsies. YT2 are early-onset type 2 diabetic subjects; OT2 are late-onset type 2 diabetic subjects, and their respective controls are YC and OC. (A) CARS2, (B) DARS2, (C) HARS2, (D) IARS2, (E) LARS2, (F) MARS2, (G) NARS2, (H) PARS2, (I) SARS2. Data are presented in boxplots; on each box, the central mark indicates the median, and the bottom and top edges of the box indicate the 25th and 74th percentiles, respectively. Unpaired non-parametric distribution and Mann-Whitney test was used *p < 0.05. YC (n = 12), YT2 (n = 21), OC (n = 17), OT2 (n = 24).
Fig. 3
Fig. 3
Skeletal muscle gene expression of mitochondrial tRNA synthetases in type 2 diabetic subjects (T2D) and their respective matched control groups. Real-time PCR was performed in skeletal muscle biopsies. T2D are type 2 diabetic subjects and their respective matched control groups. (A) CARS2, (B) DARS2, (C) HARS2, (D) IARS2, (E) LARS2, (F) MARS2, (G) NARS2, (H) PARS2, (I) SARS2. Data are presented in boxplots; on each box, the central mark indicates the median, and the bottom and top edges of the box indicate the 25th and 74th percentiles, respectively. Statistical analyses comparing type 2 diabetic subjects vs respective controls were performed by unpaired t-test *p < 0.05. C (n = 29), T2D (n = 45).
Fig. 4
Fig. 4
Skeletal muscle gene and protein expression of mitochondrial tRNA synthetases in obese and diabetic mice and their respective matched control group. Real-time PCR and Western blot were performed in skeletal muscle biopsies. Ob/ob are obese mice, db/db are diabetic mice, and their respective controls are C57BL/6 and db/+. (A) Skeletal muscle gene expression of mt-aaRSs in obese mice. (B) Skeletal muscle gene expression of mt-aaRSs in diabetic mice. (C) Skeletal muscle protein expression of LARS2 and TARS2 in obese mice. (D) Skeletal muscle protein expression of LARS2 and TARS2 in diabetic mice. Data are mean ± SEM. Statistical analyses comparing C57BL6 vs ob/ob or db/+ vs db/db mice were performed by unpaired t-test *p < 0.05. n = 4–6/group.
Fig. 5
Fig. 5
Skeletal muscle gene and protein expression of mitochondrial complexes in obese and diabetic mice and their respective matched control group. Real-time PCCR and Western blot were performed in skeletal muscle biopsies. Ob/ob are obese mice, db/db are diabetic mice, and their respective controls are C57BL/6 and db/+. (A) Skeletal muscle gene expression of mitochondrial complexes in obese mice. (B) Skeletal muscle gene expression of mitochondrial complexes in diabetic mice. (C) Skeletal muscle protein expression of mitochondrial complexes in obese mice. (D) Skeletal muscle protein expression of mitochondrial complexes in diabetic mice. Data are mean ± SEM. Statistical analyses comparing C57BL6 vs ob/ob or db/+ vs db/db mice were performed by unpaired t-test *p < 0.05. n = 6–8/group.
Fig. 6
Fig. 6
Skeletal muscle gene expression of iNOS and eNOS in obese and diabetic mice and their respective matched control group. iNOS and eNOS protein expression in mitochondria isolated from skeletal muscle of obese and diabetic mice and their respective matched control group. Real-time PCR or Western blot was performed in skeletal muscle biopsies. Ob/ob are obese mice, db/db are diabetic mice, and their respective controls are C57BL/6 and db/+. (A) Skeletal muscle gene expression of iNOS and eNOS in obese mice. (B) Skeletal muscle gene expression of iNOS and eNOS in diabetic mice. (C) iNOS and eNOS protein expression in enriched mitochondrial fractions from skeletal muscle of obese mice. (D) iNOS and eNOS protein expression in enriched mitochondrial fractions from skeletal muscle of diabetic mice. Data are mean ± SEM. Statistical analyses comparing C57BL6 vs ob/ob or db/+ vs db/db mice were performed by unpaired t-test *p < 0.05. n = 6–8/group.

References

    1. Rocha M., Apostolova N., Diaz-Rua R., Muntane J., Victor V.M. Mitochondria and T2D: role of autophagy, ER stress, and inflammasome. Trends Endocrinol. Metabol. 2020;31(10):725–741. - PubMed
    1. DeFronzo R.A., Tripathy D. Skeletal muscle insulin resistance is the primary defect in type 2 diabetes. Diabetes Care. 2009;32(Suppl 2):S157–S163. - PMC - PubMed
    1. Galicia-Garcia U., Benito-Vicente A., Jebari S., Larrea-Sebal A., Siddiqi H., Uribe K.B., Ostolaza H., Martin C. Pathophysiology of type 2 diabetes mellitus. Int. J. Mol. Sci. 2020;21(17) - PMC - PubMed
    1. Sherratt H.S., Turnbull D.M. Mitochondrial oxidations and ATP synthesis in muscle. Baillieres Clin Endocrinol Metab. 1990;4(3):523–560. - PubMed
    1. Simoneau J.A., Kelley D.E. Altered glycolytic and oxidative capacities of skeletal muscle contribute to insulin resistance in NIDDM. J. Appl. Physiol. 1997;83(1):166–171. - PubMed

Publication types

MeSH terms