. 2023 Mar:89:104465.
doi: 10.1016/j.ebiom.2023.104465. Epub 2023 Feb 14.

Selective emergence of antibody-secreting cells in the multiple sclerosis brain

Affiliations

Selective emergence of antibody-secreting cells in the multiple sclerosis brain

Laurens Bogers et al. EBioMedicine. 2023 Mar.

Abstract

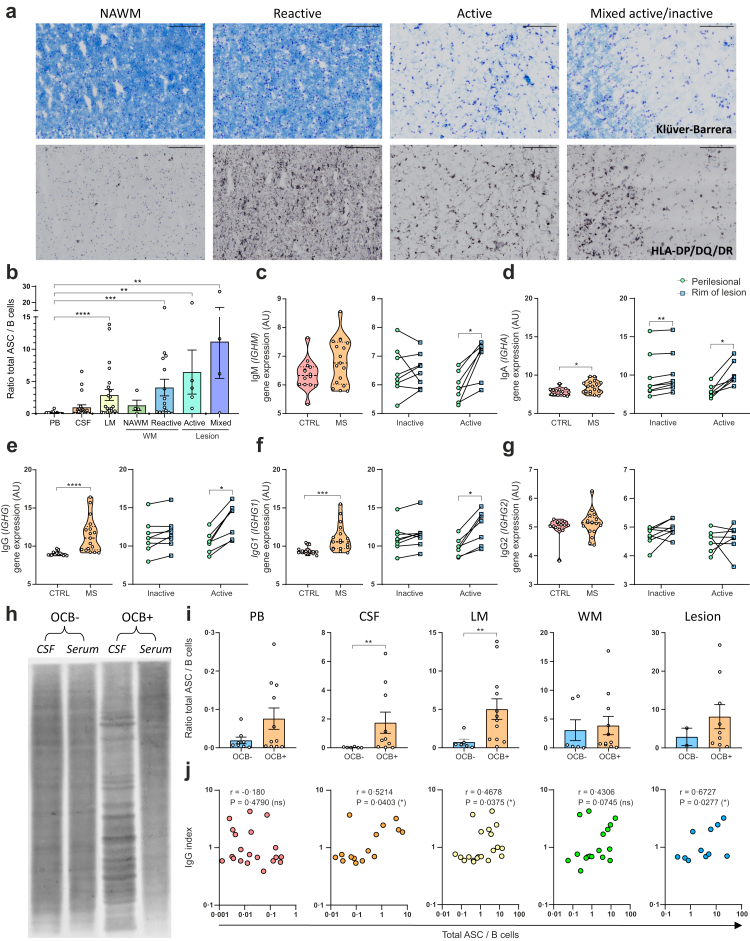
Background: Although distinct brain-homing B cells have been identified in multiple sclerosis (MS), it is unknown how these further evolve to contribute to local pathology. We explored B-cell maturation in the central nervous system (CNS) of MS patients and determined their association with immunoglobulin (Ig) production, T-cell presence, and lesion formation.

Methods: Ex vivo flow cytometry was performed on post-mortem blood, cerebrospinal fluid (CSF), meninges and white matter from 28 MS and 10 control brain donors to characterize B cells and antibody-secreting cells (ASCs). MS brain tissue sections were analysed with immunostainings and microarrays. IgG index and CSF oligoclonal bands were measured with nephelometry, isoelectric focusing, and immunoblotting. Blood-derived B cells were cocultured under T follicular helper-like conditions to evaluate their ASC-differentiating capacity in vitro.

Findings: ASC versus B-cell ratios were increased in post-mortem CNS compartments of MS but not control donors. Local presence of ASCs associated with a mature CD45low phenotype, focal MS lesional activity, lesional Ig gene expression, and CSF IgG levels as well as clonality. In vitro B-cell maturation into ASCs did not differ between MS and control donors. Notably, lesional CD4+ memory T cells positively correlated with ASC presence, reflected by local interplay with T cells.

Interpretation: These findings provide evidence that local B cells at least in late-stage MS preferentially mature into ASCs, which are largely responsible for intrathecal and local Ig production. This is especially seen in active MS white matter lesions and likely depends on the interaction with CD4+ memory T cells.

Funding: Stichting MS Research (19-1057 MS; 20-490f MS), National MS Fonds (OZ2018-003).

Keywords: B-cell maturation; CXCR3; Central nervous system; Immunoglobulins; T cells; White matter lesions.


Conflict of interest statement

Declaration of interests M.M.v.L. received research support from EMD Serono, Merck, GSK and Idorsia Pharmaceutical Ltd. J.S. received lecture and/or consultancy fees from Biogen, Merck, Novartis and Sanofi-Genzyme. The remaining authors declare no competing interests.

Figures

Fig. 1
Fig. 1
Ex vivo ASCs are enriched in relation to B cells in the CNS of MS patients. (a) Representative flow cytometry dot plots with gating of ex vivo CD38highCD27high ASCs within viable CD45+CD19+CD3 lymphocytes from freshly obtained paired post-mortem blood, CSF, leptomeninges, white matter and white matter lesions of MS brain donors. (b) Representative flow cytometry dot plots with gating of ex vivo CD38highCD27highCD3 cells (total ASCs) within total viable lymphocytes from freshly isolated post-mortem peripheral and CNS compartments of MS brain donors. (c, d) Quantifications of ASC/B-cell ratios and total ASC/B-cell ratios in peripheral and CNS compartments of MS brain donors (n = 28) and NDCs (n = 10). Data are presented as the mean ± standard error of the mean (SEM). Data were analysed using Kruskal–Wallis and Dunn's post-hoc tests. ∗p < 0.05; ∗∗p < 0.01; ∗∗∗p < 0.001; ∗∗∗∗p < 0.0001. ASC = antibody-secreting cell; CSF = cerebrospinal fluid; LM = leptomeninges; MS = multiple sclerosis; NDC = non-demented control; PB = peripheral blood; WM = white matter.
Fig. 2
Fig. 2
ASCs in the MS CNS associate with lesion activity, local Ig expression and intrathecal IgG production. (a) Representative pictures (20× magnification) of Klüver-Barrera staining and HLA-DP/DQ/DR immunohistochemistry on macroscopically defined white matter and white matter lesions from MS brain donors. Scale bars are 200 micron. White matter is distinguished into NAWM and reactive sites, while white matter lesions are divided into active and mixed active/inactive lesions. (b) Quantifications of total ASC/B-cell ratios in these different brain tissues compared to peripheral blood, CSF and leptomeninges. (cg) Normalized gene expression levels of IGHM, IGHA, IGHG, IGHG1 and IGHG2 in post-mortem control white matter (n = 14) and MS NAWM (n = 17) as well as in post-mortem perilesional tissue and rims of inactive (n = 8) and active (n = 7) MS white matter lesions, measured with a microarray. (h) Representative pictures of immunoblotting with post-mortem CSF and serum from MS brain donors with and without OCBs. (i) Quantification of total ASC/B-cell ratios in post-mortem peripheral blood, CSF, leptomeninges, white matter and white matter lesions from OCB-negative and -positive MS patients. (j) Correlation plots showing the link between IgG index and total ASC/B-cell ratios in post-mortem peripheral and CNS compartments from MS brain donors. Data are presented as the mean ± standard error of the mean (SEM). p-values were calculated using Kruskal–Wallis and Dunn's post-hoc tests (b), Mann–Whitney U tests (cg, i) and Wilcoxon signed-rank tests (cg). Correlation plots were analysed by calculating Spearman correlation coefficients (j). ∗p < 0.05; ∗∗p < 0.01; ∗∗∗p < 0.001; ∗∗∗∗p < 0.0001. ASC = antibody-secreting cell; AU = arbitrary units; CSF = cerebrospinal fluid; CTRL = control; LM = leptomeninges; MS = multiple sclerosis; NAWM = normal appearing white matter; OCB = oligoclonal band; PB = peripheral blood; WM = white matter.
Fig. 3
Fig. 3
ASCs in MS CNS tissues show a mature phenotype, while CSF contains a more active subset of ASCs. (a, b) Quantifications of CD45 and CD19 MFI on ASCs from post-mortem peripheral blood and CNS compartments of MS brain donors. (c, d) Representative flow cytometry dot plots with gating of CD138+ and CXCR3+ cells within total ASCs from peripheral blood and CSF. (e, f) CD138+ and CXCR3+ percentages within total ASCs from peripheral blood and CSF. (g, h) Correlation plots showing the link between IgG index and CXCR3 expression on total ASCs in post-mortem peripheral blood and CSF. (i) Representative flow cytometry dot plots with gating of CD45 and CD19 negative and positive populations in total ASCs from post-mortem CSF. (j, k) Paired CD138+ and CXCR3+ percentages within these CD45 and CD19 negative and positive ASC populations. Data are presented as the mean ± standard error of the mean (SEM). Data were analysed by performing Kruskal–Wallis and Dunn's post-hoc tests (a, b), Mann–Whitney U tests (e, f) and paired t-tests (j, k). Correlation plots were analysed by calculating Spearman correlation coefficients. ∗p < 0.05; ∗∗p < 0.01; ∗∗∗p < 0.001; ∗∗∗∗p < 0.0001. ASC = antibody-secreting cell; CSF = cerebrospinal fluid; LM = leptomeninges; MFI = median fluorescence intensity; MS = multiple sclerosis; PB = peripheral blood; WM = white matter.
Fig. 4
Fig. 4
No difference in peripheral B cell-to-ASC differentiation between healthy controls and MS patients under TFH-like conditions in vitro. PBMCs from healthy controls (n = 7) and progressive MS patients (n = 7) were cocultured with CD40L-attached 3T3 fibroblasts and stimulated with soluble IL-21 (TFH-like conditions) for 6 and 11 days, followed by multicolour flow cytometry. (a) Representative flow cytometry dot plots with gating of CD38highCD27high ASCs within viable CD19+CD3- lymphocytes on day 0, 6 and 11. (b) Paired ASC/B-cell ratios on day 0, 6 and 11 for both healthy controls and MS patients. (c) Quantifications of ASC/B-cell ratios on day 6 and 11 for both groups, corrected for values on day 0. (d) Percentages of CXCR3+ ASCs on day 0 and 6 for healthy controls and MS patients. (e) Percentages of CD138+ ASCs on day 6 and 11 for both groups. (f) Quantifications of IgG, IgM and IgA secretion in supernatants on day 6, measured with an ELISA. (g) Percentages of intracellular producing IgG+, IgM+ and IgA+ ASCs on day 11. Data are presented as the mean ± standard error of the mean (SEM). Data were analysed with Friedman and Dunn's post hoc tests (b) and Mann–Whitney U tests (c–g). ∗p < 0.05; ∗∗p < 0.01; ∗∗∗p < 0.001; ∗∗∗∗p < 0.0001. ASC = antibody-secreting cell; HC = healthy control; MS = multiple sclerosis.
Fig. 5
Fig. 5
ASCs in MS lesions associate with local presence of CD4+memory T cells. (a) Correlation plots showing the link between total ASC/B-cell ratios and age in peripheral blood, CSF, leptomeninges, white matter and white matter lesions of MS brain donors. (b) Representative flow cytometry dot plots with the gating strategy for identifying CD4+CD45RA and CD8+CD45RA memory T cells (CD3+CD19) in viable CD45+ lymphocytes from peripheral blood, white matter and white matter lesions of MS brain donors. (c) Correlation plots showing the link between CD4+/CD8+ memory T cell ratios and total ASC/B-cell ratios in peripheral and CNS compartments. (d) Confocal images (63× magnification) of CD19 (green), CD3 (yellow) and CXCR5 (red) immunofluorescence staining on MS white matter lesions showing local interplay between CD19+ B cells and CD3+CXCR5+ T cells. Hoechst (blue) was used for staining nuclei. The white arrows indicate CD3+CXCR5+ T cells. The asterisk indicates a CD3+CXCR5 T cell. Scale bars are 5 micron. B-cell contact within total CXCR5+ and CXCR5 T cells is quantified in proximity of cuffs within MS white matter lesions (n = 6). (e) CXCR5+ percentages are determined within total CD4+ and CD8+ T cells from MS white matter and white matter lesions (n = 4) using flow cytometry. Correlation plots were analysed by calculating Spearman correlation coefficients (a, c). p-values were calculated using paired t-tests (d) and Wilcoxon signed-rank tests (e). ∗p < 0.05; ∗∗p < 0.01; ∗∗∗p < 0.001; ∗∗∗∗p < 0.0001. ASC = antibody-secreting cell; CSF = cerebrospinal fluid; LM = leptomeninges; MS = multiple sclerosis; PB = peripheral blood; WM = white matter.

References

    1. Hampe C.S. B cells in autoimmune diseases. Scientifica. 2012;2012:259–277. - PMC - PubMed
    1. Hoffman W., Lakkis F.G., Chalasani G. B cells, antibodies, and more. Clin J Am Soc Nephrol. 2016;11:137. - PMC - PubMed
    1. Sanz I., Wei C., Jenks S.A., et al. Challenges and opportunities for consistent classification of human B cell and plasma cell populations. Front Immunol. 2019;10:2458. - PMC - PubMed
    1. Meffre E., Wardemann H. B-cell tolerance checkpoints in health and autoimmunity. Curr Opin Immunol. 2008;20:632–638. - PubMed
    1. Knox J.J., Myles A., Cancro M.P. T-bet+ memory B cells: generation, function, and fate. Immunol Rev. 2019;288:149. - PMC - PubMed

MeSH terms

Substances