. 2023 Mar 2;30(3):312-332.e13.
doi: 10.1016/j.stem.2023.01.010. Epub 2023 Feb 15.

Natural variation in gene expression and viral susceptibility revealed by neural progenitor cell villages

Affiliations

Natural variation in gene expression and viral susceptibility revealed by neural progenitor cell villages

Michael F Wells et al. Cell Stem Cell. .

Abstract

Human genome variation contributes to diversity in neurodevelopmental outcomes and vulnerabilities; recognizing the underlying molecular and cellular mechanisms will require scalable approaches. Here, we describe a "cell village" experimental platform we used to analyze genetic, molecular, and phenotypic heterogeneity across neural progenitor cells from 44 human donors cultured in a shared in vitro environment using algorithms (Dropulation and Census-seq) to assign cells and phenotypes to individual donors. Through rapid induction of human stem cell-derived neural progenitor cells, measurements of natural genetic variation, and CRISPR-Cas9 genetic perturbations, we identified a common variant that regulates antiviral IFITM3 expression and explains most inter-individual variation in susceptibility to the Zika virus. We also detected expression QTLs corresponding to GWAS loci for brain traits and discovered novel disease-relevant regulators of progenitor proliferation and differentiation such as CACHD1. This approach provides scalable ways to elucidate the effects of genes and genetic variation on cellular phenotypes.

Keywords: CACHD1; CRISPR-Cas9 screen; Neurogenin-2; Zika virus; cell villages; neural progenitor cells; neurodevelopmental disorders; proliferation.


Conflict of interest statement

Declaration of interests K.E. is a founder of Q-State Biosciences, Quralis, and Enclear Therapies; an employee and shareholder of BioMarin; and a member of Cell Stem Cell’s advisory board.

Figures
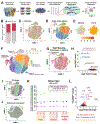
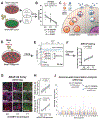
Figure 1:
Figure 1:. scRNA-seq characterization of human iPSC village.
A, Schematic of cell village workflow. B, Composition of hiPSC village by donor sex and reprogrammed tissue source. C-E, Factors influencing variation in gene expression. tSNE projection of scRNA-seq data color-coded by (C) donor and (D) cell cycle stage as inferred from RNA expression profiles. (E) Expression of pluripotency markers OCT4 and NANOG. F, Cell groups represent proliferative stem cells, differentiated cells, and nuclei. G-H, Minimal effect of cell source (fibroblast vs. PBMC) is seen in (G) tSNE projection of scRNA-seq data and (H) volcano plot of DEG analysis grouped by donor cell source. I-L, Effect of donor sex on RNA expression. tSNE projections of scRNA-seq data from (I) all genes and (J) autosomal genes only. (K) Numbers of DEGs in pairwise comparisons of all iPSC donors, grouped by donor sex and cell source. Three different fold-change thresholds denoted by green (1.2-fold), blue (1.5-fold), and purple (2.0-fold) dotted lines. (L) Volcano plot of DEG analysis grouped by donor sex.
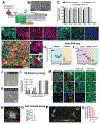
Figure 2:
Figure 2:. Rapid induction of stem cell-derived human NPCs.
A, SNaP induction protocol. B, Bright field images of SW7388-1 iPSCs (left) and SNaPs at 48 hours post-induction (right). C, Quantification of protein marker expression from immunocytochemistry at 48 hours post-induction, after first passage, and after passage 10. D, Immunostaining of forebrain NPC protein markers at 48 hours post-induction. E-G, SNaPs self-organize into (E) rosette-like structures 2 days after first passage. Magnified images of a (F) ZO-1+ and (G) SOX1+ rosette structure. H-I, Bulk RNA-seq of H9 SNaPs. Normalized DESeq2 counts of (H) anterior/posterior genes and (I) dorsal/ventral genes. J-M, SNaP multipotency assays. Bright field images of (J) SNaP-derived post-mitotic neurons after 2 weeks in base media and (K) glial cells after 7 days in Astrocyte Media (AM). L, Quantification of Panel M. M, Immunostaining of neuronal (HuC/D) and glial (CD44, S100b, and GFAP) protein markers in base media or 1% FBS media after 2-3 weeks in culture or after 20-60 days in AM. N-Q, SNaPs can self-renew. (N) Representative image of a cluster of PAX6+/NESTIN+ cells 14 days after plating of a single SNaP. (O) Quantification of N. (P) Representative image of well containing both SNaP-derived neurons and glia at 14 days post-differentiation. (Q) Percentage of wells that contain neurons, glia, or both. Data presented as mean ± SD.
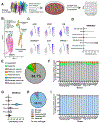
Figure 3:
Figure 3:. SNaPs resemble in vivo fetal dorsal telencephalic NPCs.
A, Cell village workflow. Multiple donor lines were induced to SNaPs individually before pooling. Donor re-identified gene expression matrix was used for cell type comparisons. B, UMAP cluster plot of Village-21 SNaPs and reference fetal and adult brain cells. C, NPC marker expression limited to SNaP/Fetal NPC cluster. Excitatory neuron (NEUROD1), inhibitory neuron (DLX1), and astrocyte (SPARCL1) markers are enriched in non-SNaP/Fetal NPC clusters. D, Representative data (GENEA43 line) showing high fetal NPC cell identity scores for SNaPs. E-F, Quantification of computed cell type classification. (E) Seurat 3.0 computed cell type classification for all SNaPs in Village-21 and (F) on a per donor basis. G-I, Comparison to in vivo fetal NPC cell types. (G) Representative data (GENEA43) showing high “RG-early” cell identity scores for SNaPs. (H) Seurat 3.0 computed NPC subtype classification for all cells (5,053 total) in Village-21 and (I) on a per donor basis.
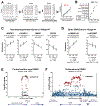
Figure 4:
Figure 4:. eQTL discovery in SNaP villages.
A, eQTL detection workflow. scRNA-seq measurements for individual cells are summed into meta-cells and cross-referenced to SNP genotypes for eQTL analysis. B, Village SNaP-44 eQTLs show high concordance by sign test with fetal and adult brain eQTLs. Concordance rates are lower for certain non-brain tissue types. C, SNaP village eQTLs detected in neurodevelopmental genes. D-F, Overlap with brain GWAS results. (D) Village eQTLs rs79600142 and rs4523957 are in vivo GWAS hits for (E) cortical surface area and (F) schizophrenia.
Figure 5:
Figure 5:. CRISPR screen identifies potential genetic contributors to ZIKV infectivity variation across donors.
A, Immunostaining of ZIKV 4G2 envelope protein at 54 hpi. B, Quantification of SNaP infections with ZIKV-Ug and ZIKV-PR at 54 hpi. C, Quantification of arrayed immunocytochemistry-based infectivity assays across donors (ZIKV-Ug, MOI = 1) at 54 hpi. D, Design of whole-genome CRISPR-Cas9 screens. E-F, RSA plots depicting gene level results of the enriched host factor genes from (E) ZIKV-PR and (F) ZIKV-Ug screens. G-H, RSA plots depicting gene level results of the depleted restriction factor genes from (G) ZIKV-PR and (H) ZIKV-Ug screens. I-J, Screen validation. H1-Cas9 SNaPs were transduced with individual gRNAs and exposed to ZIKV-Ug (MOI = 1). (I) Representative images and (J) quantification at 54 hpi. Dashed line denotes adjusted p-value < 0.05 (E-H) or infectivity levels for non-targeting gRNA controls (J). Oneway ANOVA with Dunnett’s test for multiple comparisons. Data presented as mean ± SD. N.S. = not significant, ****p<0.0001.
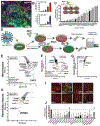
Figure 6:
Figure 6:. SNaP sensitivity to ZIKV associates to a common SNP in IFITM3.
A, Workflow combining Village-44 eQTL analysis with CRISPR screen results. B, IFITM3 expression levels in SNaP Village-44 donors harboring reference and alternate alleles at SNP rs34481144. C, Schematic model of hypothesis in which decreased expression levels of IFITM3 result in increased ZIKV infectivity in SNaPs. D, SNaP Village-44 was infected with ZIKV-Ug (MOI = 1) or mock media. E, At 54 hpi, cells were FAC sorted based on 4G2 signal intensity. F, Donor representation in each FACS fraction was measured by Census-seq. Association between genotype for rs34481144 and the distribution of different donors’ cells between the aggregated ZIKV-positive relative to ZIKV-negative fractions. All values were normalized to mock to control for donor differences in growth rates. G-I, Arrayed infectivity assays (ZIKV-Ug, MOI = 1). (G) Representative images from 24 hESC-derived SNaP lines. (H) Quantification of G. (I) Quantification of 36 hiPSC-derived SNaPs. J, Genome-wide association analysis of arrayed ZIKV-Ug infectivity (n = 36 donors). Red line denotes genome-wide significance. Linear regression line in black with shaded error in gray (B, F, H-I).
Figure 7:
Figure 7:. CACHD1 regulates organoid neurogenesis.
A, RSA analysis of genome-wide CRISPR fitness screen. Dashed line denotes adjusted p-value < 0.05. B, Summary of disease gene enrichment analysis. Red dots denote gene lists with significant overlap with SNaP proliferation hits. C-D, Increased size of CACHD1-depleted cerebral organoids. (C) Quantification of 2D size over 28 days. (D) Representative brightfield images. E-J, Organoid immunohistochemistry. (E) Representative confocal images of sectioned controls and CACHD1-edited Day 28 cerebral organoids stained with NPC marker SOX2 and proliferative cell marker KI67. Quantification of (F) NPCs and (G) cycling NPCs. (H) Representative SOX2 and newborn neuron marker TBR1 immunostains. Quantification of (I) TBR1+ neurons and (J) neuron-to-NPC ratio. Fisher’s exact test (B), repeated measures two-way ANOVA with Dunnett’s tests for multiple comparisons (C), and one-way ANOVA with Dunnett’s tests for multiple comparisons (F-G, I-J) were used for statistical analysis. Data presented as mean ± SD. *p<0.05, **p<0.01, *** p < 0.001, ****p < 0.0001, N.S. = not significant.

Comment in

References

    1. Hemmati HD, Nakano I, Lazareff JA, Masterman-Smith M, Geschwind DH, Bronner-Fraser M, and Kornblum HI (2003). Cancerous stem cells can arise from pediatric brain tumors. Proceedings of the National Academy of Sciences 100, 15178–15183. 10.1073/pnas.2036535100. - DOI - PMC - PubMed
    1. Tang H, Hammack C, Ogden SC, Wen Z, Qian X, Li Y, Yao B, Shin J, Zhang F, Lee EM, et al. (2016). Zika virus infects human cortical neural progenitors and attenuates their growth. Cell Stem Cell 18, 587–590. 10.1016/j.stem.2016.02.016. - DOI - PMC - PubMed
    1. Belmont JW, Boudreau A, Leal SM, Hardenbol P, Pasternak S, Wheeler DA, Willis TD, Yu F, Yang H, Gao Y, et al. (2005). A haplotype map of the human genome. Nature 437, 1299–1320. 10.1038/nature04226. - DOI - PMC - PubMed
    1. Auton A, Abecasis GR, Altshuler DM, Durbin RM, Abecasis GR, Bentley DR, Chakravarti A, Clark AG, Donnelly P, Eichler EE, et al. (2015). A global reference for human genetic variation. Nature 526, 68–74. 10.1038/nature15393. - DOI - PMC - PubMed
    1. Aguet F, Brown AA, Castel SE, Davis JR, He Y, Jo B, Mohammadi P, Park Y, Parsana P, Segrè AV, et al. (2017). Genetic effects on gene expression across human tissues. Nature 550, 204–213. 10.1038/nature24277. - DOI - PMC - PubMed

Publication types