. 2023 Mar 21;4(3):100939.
doi: 10.1016/j.xcrm.2023.100939. Epub 2023 Feb 15.

OX40 agonism enhances PD-L1 checkpoint blockade by shifting the cytotoxic T cell differentiation spectrum

Affiliations

OX40 agonism enhances PD-L1 checkpoint blockade by shifting the cytotoxic T cell differentiation spectrum

Tetje C van der Sluis et al. Cell Rep Med. .

Abstract

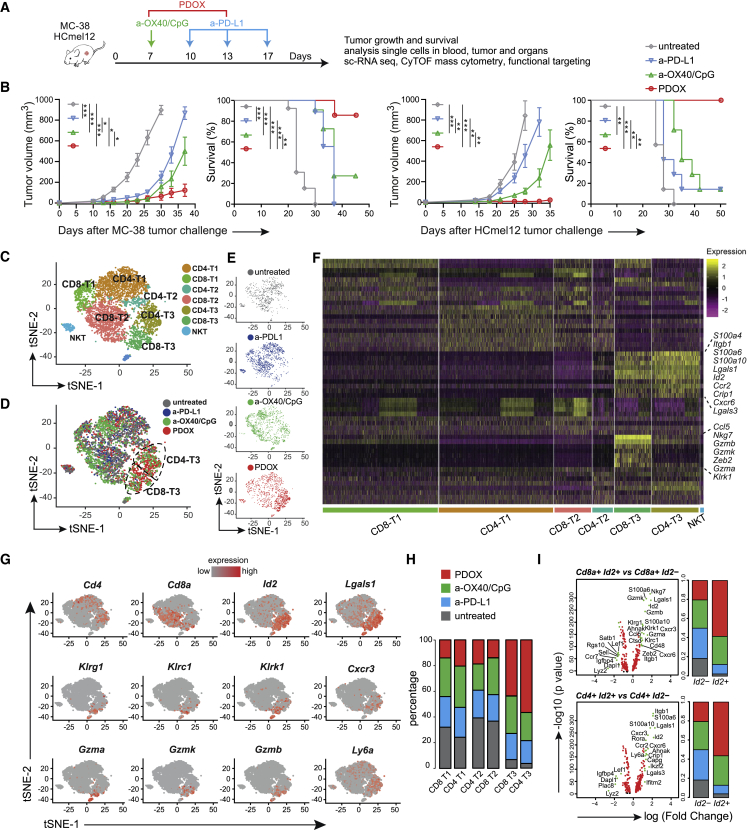
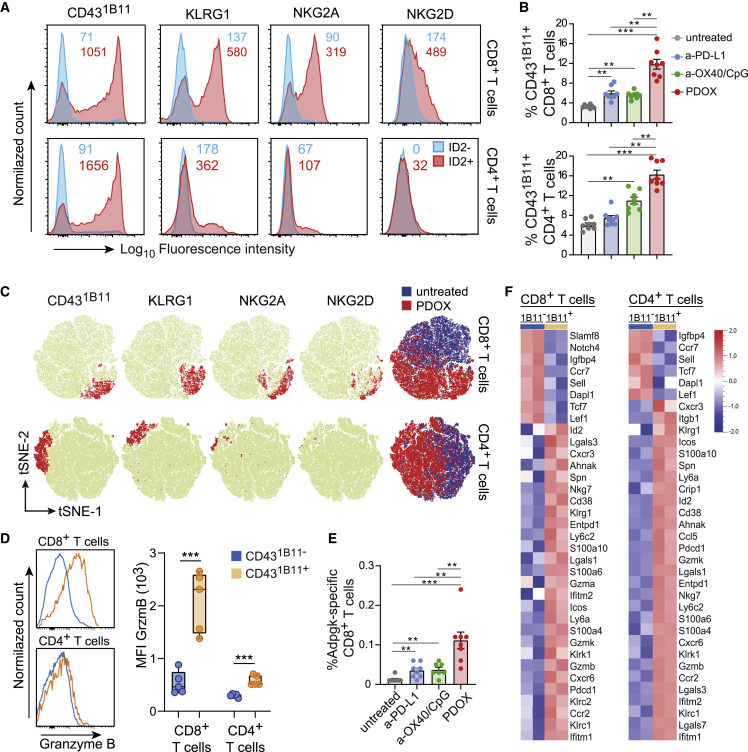
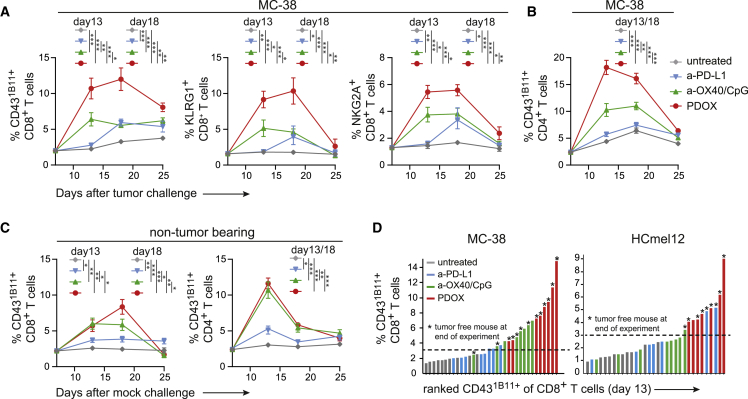
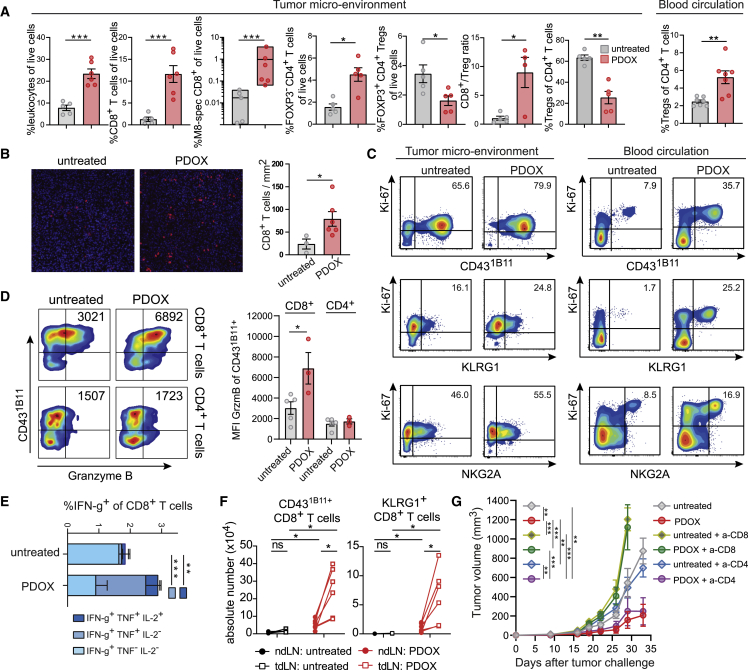
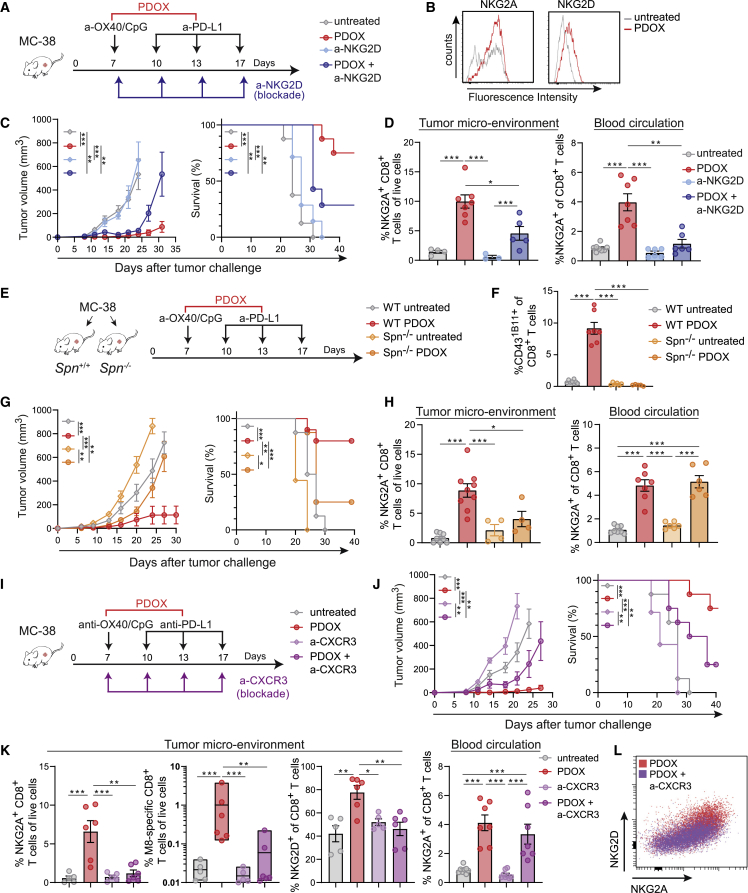
Immune checkpoint therapy (ICT) has the power to eradicate cancer, but the mechanisms that determine effective therapy-induced immune responses are not fully understood. Here, using high-dimensional single-cell profiling, we interrogate whether the landscape of T cell states in the peripheral blood predict responses to combinatorial targeting of the OX40 costimulatory and PD-1 inhibitory pathways. Single-cell RNA sequencing and mass cytometry expose systemic and dynamic activation states of therapy-responsive CD4+ and CD8+ T cells in tumor-bearing mice with expression of distinct natural killer (NK) cell receptors, granzymes, and chemokines/chemokine receptors. Moreover, similar NK cell receptor-expressing CD8+ T cells are also detected in the blood of immunotherapy-responsive cancer patients. Targeting the NK cell and chemokine receptors in tumor-bearing mice shows the functional importance of these receptors for therapy-induced anti-tumor immunity. These findings provide a better understanding of ICT and highlight the use and targeting of dynamic biomarkers on T cells to improve cancer immunotherapy.

Keywords: T cells; immune checkpoint therapy; immunotherapy; mass cytometry; predictive biomarkers; single-cell RNA sequencing; systemic immune activation.


Conflict of interest statement

Declaration of interests The authors declare no competing interests.

Figures

None
Graphical abstract
Figure 1
Figure 1
Transcriptional profiling identifies therapy-responsive T cell subsets in the blood circulation (A) Schematic of the immune checkpoint therapy (ICT) regimen strategy. Mice were challenged s.c. with MC-38 or HCmel12 syngenic tumors and treated with different ICTs. (B) MC-38 and HCmel12 tumor growth (mean ± SEM) and survival curves of untreated and anti-OX40/CpG-, anti-PD-L1-, and anti-OX40/CpG plus anti-PD-L1 (PDOX)-treated wild-type mice. Data were combined from two replicate experiments (n = 8–16 mice per group). ∗p < 0.05, ∗∗p < 0.01, ∗∗∗p < 0.001. (C) tSNE scRNA-seq plot visualizing six transcriptional clusters of blood T cells from day 18 tumor-bearing mice that were untreated or received ICT. (D) Combined t-SNE scRNA-seq plot of blood T cells color coded for the untreated and ICT groups. (E) tSNE scRNA-seq plots of blood T cells color coded for the untreated group and each ICT group individually. (F) Heatmap displaying scaled expression values of discriminative genes per cluster. (G) tSNE scRNA-seq plots displaying gene expression of Cd4, Cd8, Id2, Lgals1, Klrg1, Klrc1, Klrk1, Cxcr3, Gzma, Gzmk, Gzmb, and Ly6a. (H) Stacked bar graphs representing the percentage of cells from the untreated and ICT groups present in the six transcriptional clusters. (I) Volcano plots showing significant gene expression related to Id2 expression in CD4+ and CD8+ T cells. Stacked bar graphs indicate the percentage of the cell origin according to their treatment. See also Figure S1.
Figure 2
Figure 2
Circulating therapy-responsive T cell subsets display effector cell properties with increased cytotoxic and migratory capacity (A) Representative histogram plots of NKG2A, NKG2D, KLRG1, and CD431B11 expression on gated ID2CD8+ or ID2+CD8+ and gated ID2CD4+ or ID2+CD4+ T cell populations residing in the blood circulation of MC-38-challenged PDOX-treated mice. Numbers indicate average mean fluorescence intensity. (B) Percentage of CD431B11+ cells within the total CD8+ and CD4+ T cell population in the blood of untreated and ICT-treated groups. (C) tSNE plots of flow cytometric data visualizing NKG2A, NKG2D, KLRG1, and CD431B11 expression (red) on CD8+ and CD4+ T cells in the blood from untreated and PDOX-treated groups. The blue/red tSNE plot indicates cell origin for CD8+ and CD4+ T cells of the untreated and PDOX-treated group, respectively. (D) Representative histograms (left) and quantification of fluorescence intensity (right) of granzyme B expression in blood circulating CD431B11−CD8+ and CD431B11+CD8+ and CD431B11−CD4+ and CD431B11+CD4+ T cell populations of MC-38-challenged PDOX-treated mice. (E) Percentage of Adpgk-specific CD8+ T cells in the blood of untreated and ICT-treated groups. (F) Heatmaps of RNA-seq data of sorted CD431B11−CD8+ and CD431B11+CD8+ and CD431B11−CD4+and CD431B11+CD4+ T cells (n = 2 individual mice per subset) from spleens isolated from wild-type mice challenged with MC-38 and treated with PDOX. Scaled expression values of discriminating genes are displayed. Data (A)–(F) are were collected from mice on day 18 post tumor challenge. The p values in (B) and (E) were calculated by ANOVA and in (D) by unpaired Student’s t test; ∗p < 0.05, ∗∗p < 0.01, ∗∗∗p < 0.001. Data in (B) and (E) are presented as mean ± SEM, and each dot in (B), (D), and (E) represents an individual mouse. Data (A)–(E) are representative of 2–3 independent experiments. See also Figure S2.
Figure 3
Figure 3
Dynamic induction of therapy-responsive T cell subsets in the blood circulation (A and B) Kinetics of the CD431B11+, NKG2A+, and KLRG1+ cells of CD8+ T cells (A) and CD431B11+ cells of CD4+ T cells (B) in the blood circulation after challenge with MC-38 tumor cells and treated or not treated with different ICTs (anti-PD-L1, anti-OX40, or PDOX). (C) Kinetics of the CD431B11+ cells of CD8+ and CD4+ T cells after mock challenge (saline) and treated similarly as in (A) and (B). (D) Ranking of the percentage CD431B11+ cells of CD8+ T cells in blood (on day 13 post tumor challenge) for each individual MC-38-bearing mouse (left panel) or HCmel12-bearing mouse (right panel). An asterisk indicates correlation with tumor-free mice. The p values in (A–C) were calculated by ANOVA; ∗p < 0.05, ∗∗p < 0.01, ∗∗∗p < 0.001. Data in (A)–(C) are presented as mean ± SEM Data shown in (A)–(D) are representative of 2–3 independent experiments.
Figure 4
Figure 4
Systemic induction of therapy-responsive T cell subsets upon effective ICT (A) Schematic of the mass cytometry analysis of blood lymphocytes and lymphoid tissues. (B) tSNE plots of blood T cells isolated from tumor-bearing untreated and ICT-treated (anti-PD-L1, anti-OX40/CpG, PDOX) mice, visualizing the expression intensity of cell-surface markers measured by CyTOF mass cytometry. (C) Heatmaps of selected T cell clusters in the blood, bone marrow, spleen, and lymph nodes of untreated and ICT-treated mice. The level of ArcSinh5-transformed marker expression is displayed by a rainbow scale. Bar graphs indicate the abundance and significant differences of the selected T cell clusters. Data are represented as mean ± SEM, and each dot represents an individual mouse. The p values were calculated by ANOVA; ∗p < 0.05, ∗∗p < 0.01, ∗∗∗p < 0.001. (D) Network graph showing interconnectivity between CD4 (circle) and CD8 (square) T cell clusters in different compartments: blood (blue), spleen (orange), lymph nodes (red), and bone marrow (green). Highly correlated clusters (Pearson rho >0.8) are connected by lines, and cluster IDs are indicated. Data shown in (B)–(D) were collected from mice on day 18 post tumor challenge. See also Figure S3.
Figure 5
Figure 5
Identification of NK cell receptor-expressing CD8+ T cell subsets in the blood circulation of PD-1 therapy-responsive patients (A) Data-level tSNE plots of CD8+ T cells showing sample origin (left, including responding patients [red] and non-responding patients [blue]), a density map (center), and cluster partitions with numbering (right). See also Figures S4 and S5. (B) Expression intensity of specific cell surface markers. Color indication: blue, low expression; yellow, high expression. (C) Heatmaps of clusters 2, 7, and 8 displaying median marker expression values of a selection of markers. Color indication: blue, low expression; red, high expression. (D) Percentage of cells in clusters 2, 7, and 8 within the total CD8+ T cell pool. Data are from samples collected 2 week post PD-1 therapy and represented as mean ± SEM. Circles represent individual samples of non-responder melanoma (light gray), responder melanoma (light blue), non-responder lung cancer (dark gray), and responder lung cancer (dark blue) patients. The p values were calculated by Mann-Whitney U test. (E) Overall survival plots for high versus low gene signature expression of clusters 2, 7, and 8 for skin cutaneous melanoma (SKCM). Log rank p values are indicated. (F) Spearman correlation analysis of therapy-responsive marker genes for SKCM. Spearman correlation coefficient and p values are indicated. (G) Protein network analysis of the markers expressed by therapy-responsive T cells. Line thickness indicates strength of support for interaction.
Figure 6
Figure 6
Expansion of the therapy-responsive CD8+ T cell subset in the blood circulation, TME, and draining lymph nodes (A) TME: percentage of leukocytes, CD8+ T cells, M8-specific CD8+ T cells, FOXP3CD4+ T cells, and FOXP3+CD4+ Treg cell among live cells; CD8+ T cell/Treg cell ratio and percentage of Treg cells among total CD4+ T cells in the MC-38 tumor microenvironment (TME) of untreated and PDOX treated mice. Blood circulation: percentage of FoxP3+CD4+Treg cells among total CD4+ T cells in the blood of untreated and PDOX-treated mice. (B) Representative immunofluorescence images of MC-38 tumor-infiltrating CD8+ T cells (red) of untreated and PDOX-treated mice. The bar graph indicates absolute CD8+ T cell count per square millimeter. (C) Ki-67 expression versus CD431B11, KLRG1, or NKG2A of CD8+ T cells in the TME and blood of untreated and PDOX-treated mice. Numbers indicate the average percentage of double-positive cells. (D) Left: representative flow cytometry plots indicating CD431B11 versus granzyme B expression of MC-38 tumor-infiltrating CD8+ and CD4+ T cells. Numbers indicate the fluorescence intensity of granzyme B expression in CD431B11+ T cells. Right: median fluorescence intensity of granzyme B expression in CD431B11+CD8+ and CD431B11+CD4+ T cells of untreated and PDOX-treated animals. (E) The proportion of single-, double-, and triple-cytokine-producing cells within the tumor-infiltrating CD8+ T cells of untreated and PDOX MC-38 tumor-challenged mice treated or not treated with PDOX. (F) Total numbers of CD431B11 and KLRG1-positive CD8+ T cells in non-draining lymph nodes (ndLNs; closed circles) and tumor-draining lymph nodes (tdLNs; open squares). Lines connect ndLNs and tdLNs from the same mouse. (G) MC-38 tumor growth of untreated and PDOX-treated wild-type mice receiving CD8-depleting (yellow/green) and CD4-depleting (blue/purple) antibodies or mock. Data shown in (A)–(F) were collected from mice on day 20 post tumor challenge (PDOX treatment started on day 10). The p values in (A), (B), and (D)–(F) were calculated by unpaired Student’s t test and in (G) by ANOVA; ∗p < 0.05, ∗∗p < 0.01, ∗∗∗p < 0.001. Data in (A), (B), (D), (E), and (G) are presented as mean ± SEM, and each dot in (A), (B), and (D) represents an individual mouse. Data shown are representative of 2 independent experiments. See also Figure S6.
Figure 7
Figure 7
Functional expression of NKG2D, CD43, and CXCR3 on therapy-responsive T cell subsets affects expansion and tumor infiltration (A) Schematic of the strategy. Mice were challenged s.c. with MC-38 tumors and left untreated or treated with PDOX in combination with blocking NKG2D antibodies. (B) Representative histograms showing NKG2A and NKG2D expression on MC-38 tumor-infiltrating CD8+ T cells of PDOX-treated and untreated mice. (C) MC-38 tumor growth and survival curves of untreated and PDOX-treated mice in combination with blocking anti-NKG2D antibodies. (D) Percentage of NKG2A+ cells among blood CD8+ T cells and percentage of NKG2A+CD8+ T cells among live cells in the TME of untreated and PDOX-treated mice in combination with blocking NKG2D antibodies. (E) Schematic of the strategy. Wild-type and Spn−/− mice were challenged s.c. with MC-38 tumors and left untreated or treated with PDOX. (F) Percentage CD431B11+ cells among blood CD8+ T cells of untreated and PDOX-treated wild-type (WT) and Spn−/− mice. (G) MC-38 tumor growth and survival curves of untreated and PDOX-treated WT and Spn−/− mice. (H) Percentage of NKG2A+ cells among blood CD8+ T cells and percentage of NKG2A+CD8+ T cells among live cells in the TME of untreated and PDOX-treated WT and Spn−/− mice. (I) Schematic of the strategy. WT mice were challenged s.c. with MC-38 tumors and left untreated or treated with PDOX in combination with blocking CXCR3 antibodies. (J) MC-38 tumor growth and survival curves of untreated and PDOX-treated mice in combination with CXCR3-blocking antibodies. (K) Left plots: percentage of NKG2A+ CD8+ T cells among live cells and percentage of M8-specific CD8+ T cells and percentage of NKG2D+ cells among CD8+ T cells in the TME of untreated and PDOX-treated mice in combination with blocking CXCR3 antibodies. Right plot: percentage of NKG2A+ cells among CD8+ T cells in the blood of untreated and PDOX-treated mice in combination with blocking CXCR3 antibodies. See also Figure S7. (L) Representative flow cytometry plot of NKG2A versus NKG2D expression of tumor-infiltrating CD8+ T cells in PDOX-treated mice in combination with blocking CXCR3 antibodies. Data shown in (B), (D), (F), (H), (K), and (L) were collected from mice on day 18 post tumor challenge. The p values in (C), (D), (F)–(H), (J), and (K) were calculated by ANOVA or log rank (survival); ∗p < 0.05, ∗∗p < 0.01, ∗∗∗p < 0.001. Data in (C), (D), (F)–(H), (J), and (K) are presented as mean ± SEM, and each dot in (D), (F), (H), and (K) represents an individual mouse. Data shown are representative of 2 independent experiments.

References

    1. Sharma P., Siddiqui B.A., Anandhan S., Yadav S.S., Subudhi S.K., Gao J., Goswami S., Allison J.P. The next decade of immune checkpoint therapy. Cancer Discov. 2021;11:838–857. doi: 10.1158/2159-8290.Cd-20-1680. - DOI - PubMed
    1. van der Leun A.M., Thommen D.S., Schumacher T.N. CD8(+) T cell states in human cancer: insights from single-cell analysis. Nat. Rev. Cancer. 2020;20:218–232. doi: 10.1038/s41568-019-0235-4. - DOI - PMC - PubMed
    1. Hiam-Galvez K.J., Allen B.M., Spitzer M.H. Systemic immunity in cancer. Nat. Rev. Cancer. 2021;21:345–359. doi: 10.1038/s41568-021-00347-z. - DOI - PMC - PubMed
    1. Galon J., Costes A., Sanchez-Cabo F., Kirilovsky A., Mlecnik B., Lagorce-Pagès C., Tosolini M., Camus M., Berger A., Wind P., et al. Type, density, and location of immune cells within human colorectal tumors predict clinical outcome. Science. 2006;313:1960–1964. doi: 10.1126/science.1129139. - DOI - PubMed
    1. Pardoll D.M. The blockade of immune checkpoints in cancer immunotherapy. Nat. Rev. Cancer. 2012;12:252–264. doi: 10.1038/nrc3239. - DOI - PMC - PubMed

Publication types