. 2023 Apr;22(4):100506.
doi: 10.1016/j.mcpro.2023.100506. Epub 2023 Feb 14.

Precision Neoantigen Discovery Using Large-Scale Immunopeptidomes and Composite Modeling of MHC Peptide Presentation

Affiliations

Precision Neoantigen Discovery Using Large-Scale Immunopeptidomes and Composite Modeling of MHC Peptide Presentation

Rachel Marty Pyke et al. Mol Cell Proteomics. 2023 Apr.

Abstract

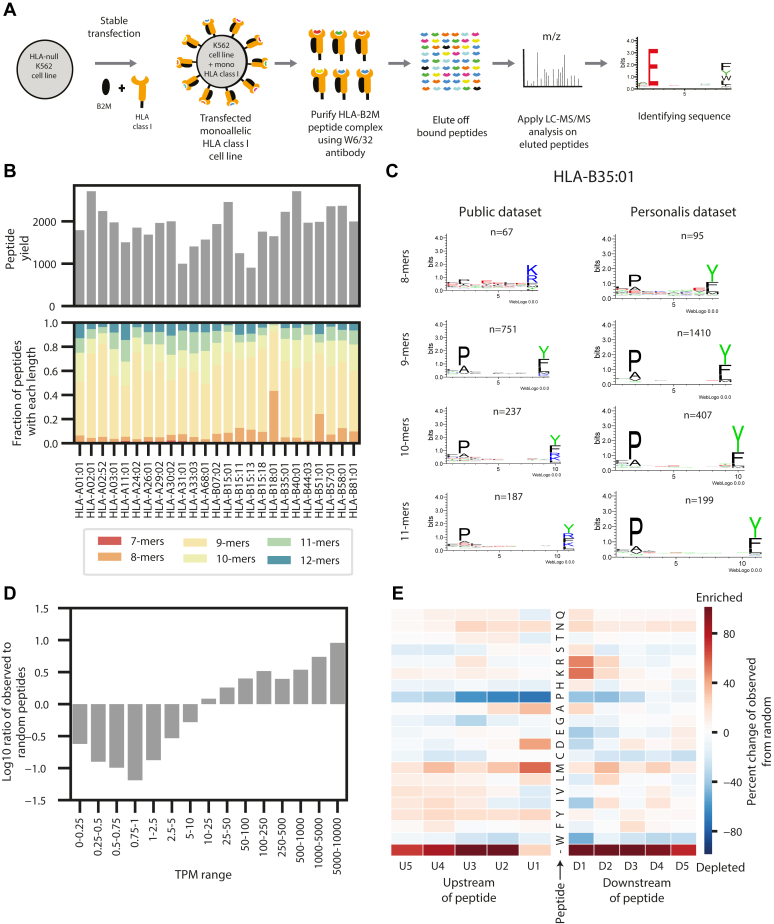
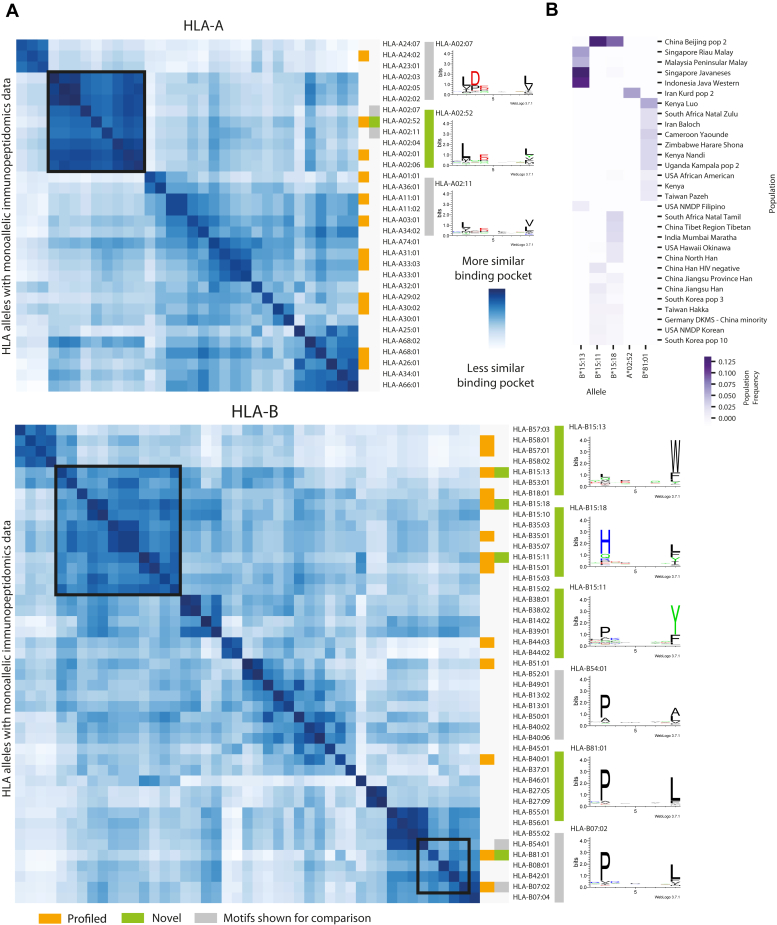
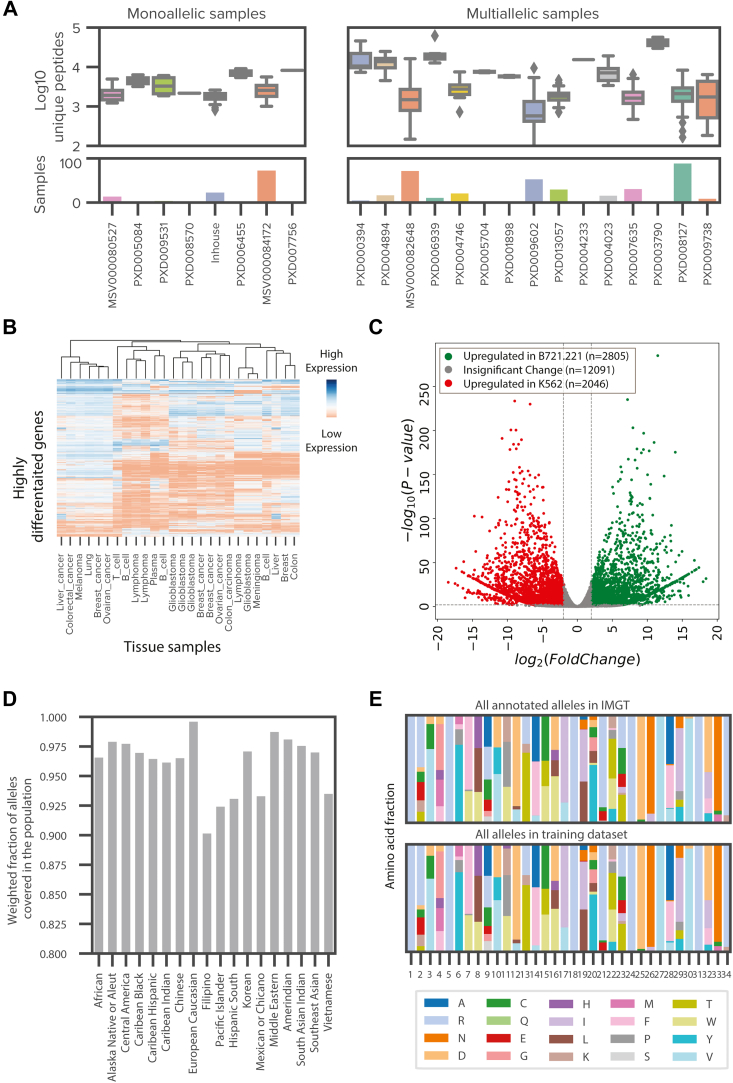
Major histocompatibility complex (MHC)-bound peptides that originate from tumor-specific genetic alterations, known as neoantigens, are an important class of anticancer therapeutic targets. Accurately predicting peptide presentation by MHC complexes is a key aspect of discovering therapeutically relevant neoantigens. Technological improvements in mass spectrometry-based immunopeptidomics and advanced modeling techniques have vastly improved MHC presentation prediction over the past 2 decades. However, improvement in the accuracy of prediction algorithms is needed for clinical applications like the development of personalized cancer vaccines, the discovery of biomarkers for response to immunotherapies, and the quantification of autoimmune risk in gene therapies. Toward this end, we generated allele-specific immunopeptidomics data using 25 monoallelic cell lines and created Systematic Human Leukocyte Antigen (HLA) Epitope Ranking Pan Algorithm (SHERPA), a pan-allelic MHC-peptide algorithm for predicting MHC-peptide binding and presentation. In contrast to previously published large-scale monoallelic data, we used an HLA-null K562 parental cell line and a stable transfection of HLA allele to better emulate native presentation. Our dataset includes five previously unprofiled alleles that expand MHC diversity in the training data and extend allelic coverage in underprofiled populations. To improve generalizability, SHERPA systematically integrates 128 monoallelic and 384 multiallelic samples with publicly available immunoproteomics data and binding assay data. Using this dataset, we developed two features that empirically estimate the propensities of genes and specific regions within gene bodies to engender immunopeptides to represent antigen processing. Using a composite model constructed with gradient boosting decision trees, multiallelic deconvolution, and 2.15 million peptides encompassing 167 alleles, we achieved a 1.44-fold improvement of positive predictive value compared with existing tools when evaluated on independent monoallelic datasets and a 1.17-fold improvement when evaluating on tumor samples. With a high degree of accuracy, SHERPA has the potential to enable precision neoantigen discovery for future clinical applications.

Keywords: MHC; cancer; cancer vaccines; immunology; immunopeptidomics; machine learning; major histocompatibility complex; neoantigen prediction; neoantigens; next-generation sequencing.


Conflict of interest statement

Conflict of interest R. M. P., D. M., Steven Dea, C. A., S. V. Z., N. A. P., J. H., G. B., Sejal Desai, R. M., J. W., R. C., and S. M. B. are full-time employees of Personalis. M. P. S. cofounded Personalis. Personalis Inc provided the funding for this project.

Figures

None
Graphical abstract
Fig. 1
Fig. 1
Generation and overview of the monoallelic data.A, a schematic of the experimental procedure to generate the monoallelic training data. A human leukocyte antigen (HLA) allele and beta 2 microglobulin (B2M) were stably transfected into an HLA-null K562 parental cell line. The major histocompatibility complex (MHC)–peptide complex was purified using a w6/32 antibody, and the peptides were gently eluted off the complexes. The peptides were sequenced with LC–MS/MS and identified with a database search. B, bar plots showing the peptide yields and distribution of peptide lengths for each of the 25 monoallelic cell lines. C, a comparison between motifs of peptides generated from our monoallelic cell line with HLA-B35:01 and a publicly available dataset for the same allele. Motifs are shown for peptides of length 8, 9, 10, and 11. See supplemental Fig. S1 for motifs from all 25 cells. See supplemental Fig. S2 for comparisons with other public datasets. D, a bar plot showing the distribution of the ratio of observed peptides from the monoallelic cell lines compared with random expectation across several transcript per million (TPM) ranges. Values are shown with a log10 transformation. E, a heatmap showing the enrichment and depletion of five amino acids upstream and downstream of the peptides identified from the monoallelic cell lines compared with a random expectation. Red denotes the enrichment of amino acids, and blue denotes the depletion of them. The C and N terminus of the protein are denoted with “-.”
Fig. 2
Fig. 2
Binding pocket diversity and population frequencies of novel alleles.A, heatmaps for human leukocyte antigen (HLA)-A and HLA-B that represent the binding pocket similarity between alleles with monoallelic immunopeptidomics data. Dark blue squares represent alleles that have very similar binding pockets, whereas white squares represent alleles with divergent binding pockets. The 25 alleles profiled with our monoallelic system are denoted in orange. The five alleles that have not previously been profiled are denoted in green. Motifs for these novel alleles are shown alongside motifs for related alleles in gray. Black boxes deonte the cluster of alleles containing the newly profiled alleles. B, a heatmap showing the frequencies of the five novel alleles in several populations of diverse world ethnicities. Dark purple denotes high population frequencies of the alleles, and light purple denotes low population frequencies.
Fig. 3
Fig. 3
Systematic expansion of human leukocyte antigen (HLA) ligandome through the incorporation of publicly available data.A, box plots representing the number of unique peptides per sample from monoallelic and multiallelic immunopeptidomics samples that were reprocessed through our pipeline. Bar plot showing the number of samples for each project. Samples are colored according to their project. Peptide yields are log10 transformed. See supplemental Table S2 for additional details. B, a heatmap of expression values (transcript per million [TPM]) of highly differentiated genes between tissue and tumor types of publicly available multiallelic immunopeptidomics data. Low expression is shown in red, and high expression is shown in blue. C, a volcano plot denoting the differential gene expression between the monoallelic parental cell lines, B721.221 and K562. Gene transcripts with significant upregulation in B721.221 compared with K562 are shown in green, whereas gene transcripts with significant upregulation in K562 compared with B721.221 are shown in red. Gene transcripts with no significant upregulation or downregulation are shown in gray. D, a bar plot denoting the weighted fraction of alleles in 18 ethnicity populations from the National Marrow Donor Program within the expanded training dataset, including monoallelic cell lines profiled in house, public monoallelic data, public multiallelic, data and binding assay data from Immune Epitope Database (IEDB). E, two stacked bar plots showing the frequencies of amino acids at each position in the pseudo binding pocket for all annotated alleles in IMGT (top) and all alleles from the expanded training dataset, including monoallelic cell lines profiled in house, public monoallelic data, public multiallelic data, and binding assay data from IEDB.
Fig. 4
Fig. 4
Modeling binding and presentation.A, a schematic showing the difference between major histocompatibility complex (MHC) binding and MHC presentation. MHC binding involves the ability of an MHC allele to bind to a paired peptide and is modeled with the peptide (P), allele binding pocket (B), and peptide length (L). MHC presentation involves all steps in the antigen-processing pathway in addition to MHC binding and is modeled with the peptide (P), allele binding pocket (B), peptide length (L), gene expression (T), flanking regions around the peptide (F), propensity of the gene to engender peptides (G), and propensity of the region within the gene to engender peptides (H). B, boxplots representing the distribution of peptides per transcript observed in the reprocessed multiallelic immunopeptidomics data across transcript deciles. The peptides observed are normalized by transcript length. Red boxes denote the transcripts that generate many observed peptides despite low expression levels and transcripts that generate few observed peptides despite high expression levels. C, the distributions of expected and observed peptides from across the ACTB protein. Expected peptides, shown in gray, are generated by summing the number of frequent alleles predicted to bind each peptide (rank <2 by netMHCpan4.0). The 30 most frequent alleles in the reprocessed multiallelic immunopeptidomics dataset were used for the analysis. Observed peptides are measured from the reprocessed multiallelic immunopeptidomics data and are shown in green.
Fig. 5
Fig. 5
Overview of composite modeling approach and model performance.A, a schematic of the composite modeling approach. Inhouse monoallelic immunopeptidomics data, public monoallelic immunopeptidomics data, and Immune Epitope Database (IEDB) data are used to train MONO-Binding. MONO-Binding is used to deconvolute the multiallelic immunopeptidomics data to create pseudo monoallelic data. All monoallelic and pseudomonoallelic data are combined to train the Systematic Human Leukocyte Antigen Epitope Ranking Pan Algorithm (SHERPA) (SHERPA)-Binding model. The SHERPA-Binding model is used as a feature along with other presentation features to train the SHERPA-Presentation model on monoallelic immunopeptidomics data. B, a precision-recall curve demonstrating the predicted pan-performance on unseen alleles (MONO-Binding-LOO) compared with MONO-Binding and NetMHCpan4.1-BA, NetMHCpan-4.1-EL, MHCFlurry-2.0-BA. A model was trained for each allele with the data for that allele excluded from the training dataset. The MONO-Binding-LOO curve represents the predictions from each of the models on the test data of the allele excluded from the training data. C and D, boxplots denoting the distributions of positive predictive values (top 0.1%) across alleles within the monoallelic immunopeptidomics held-out test data. Distributions are shown for (C) NetMHCpan4.1-BA, NetMHCpan-4.1-EL, MHCFlurry-2.0-BA, MONO-Binding, SHERPA-Binding, and SHERPA-Presentation and (D) SHERPA-Binding, SHERPA-Binding + F, SHERPA-Binding + FT, SHERPA-Binding + TTG, and SHERPA-Presentation. E, boxplots showing the distribution of precision and recall values across alleles in the monoallelic immunopeptidomics data for SHERPA-Presentation across several percentile rank thresholds. A percentile rank of 0.1 is selected as the optimal threshold.
Fig. 6
Fig. 6
Performance of Systematic Human Leukocyte Antigen Epitope Ranking Pan Algorithm (SHERPA) on tissue samples and immunogenic epitopes. Boxplots showing the distribution of prediction performance across (A) tumors profiled with immunopeptidomics in-house (lung and colorectal, left), (B) by Schuster et al. (ovarian, middle) and (C) Loffler et al. (colorectal, right). Performance is defined as the fraction of peptides observed with immunopeptidomics that are predicted to bind in the top 0.1% of all peptides percentile rank ≤0.1). Performance is shown for the following models: NetMHCpan4.1-BA, NetMHCpan-4.1-EL, MHCFlurry-2.0-BA, MONO-Binding, SHERPA-Binding, and SHERPA-Presentation. D and E, bar plots showing the sensitivity of NetMHCpan4.1-BA, NetMHCpan-4.1-EL, MHCFlurry-2.0-BA, MONO-Binding, and SHERPA-Binding on the Chowell et al. immunogenicity dataset: (D) performance across all epitopes and (E) performance across high frequency alleles.

Corrected and republished from

References

    1. Wells D.K., van Buuren M.M., Dang K.K., Hubbard-Lucey V.M., Sheehan K.C.F., Campbell K.M., et al. Key parameters of tumor epitope immunogenicity revealed through a consortium approach improve neoantigen prediction. Cell. 2020;183:818–834. - PMC - PubMed
    1. Yadav M., Jhunjhunwala S., Phung Q.T., Lupardus P., Tanguay J., Bumbaca S., et al. Predicting immunogenic tumour mutations by combining mass spectrometry and exome sequencing. Nature. 2014;515:572–576. - PubMed
    1. Schumacher T.N., Schreiber R.D. Neoantigens in cancer immunotherapy. Science. 2015;348:69–74. - PubMed
    1. Sette A., Vitiello A., Reherman B., Fowler P., Nayersina R., Kast W.M., et al. The relationship between class I binding affinity and immunogenicity of potential cytotoxic T cell epitopes. J. Immunol. 1994;153:5586–5592. - PubMed
    1. Hunt D.F., Henderson R.A., Shabanowitz J., Sakaguchi K., Michel H., Sevilir N., et al. Characterization of peptides bound to the class I MHC molecule HLA-A2.1 by mass spectrometry. Science. 1992;255:1261–1263. - PubMed

Publication types

MeSH terms