

Sex-specific transcriptional signatures in the medial prefrontal cortex underlying sexually dimorphic behavioural responses to stress in rats
- PMID: 36796857
- PMCID: PMC9943549
- DOI: 10.1503/jpn.220147
Sex-specific transcriptional signatures in the medial prefrontal cortex underlying sexually dimorphic behavioural responses to stress in rats
Abstract
Background: Converging evidence suggests that stress alters behavioural responses in a sex-specific manner; however, the underlying molecular mechanisms of stress remain largely unknown.
Methods: We adapted unpredictable maternal separation (UMS) and adult restraint stress (RS) paradigms to mimic stress in rats in early life or adulthood, respectively. The sexual dimorphism of the prefrontal cortex was noted, and we performed RNA sequencing (RNA-Seq) to identify specific genes or pathways responsible for sexually dimorphic responses to stress. We then performed quantitative reverse transcription polymerase chain reaction (qRT-PCR) to verify the results of RNA-Seq.
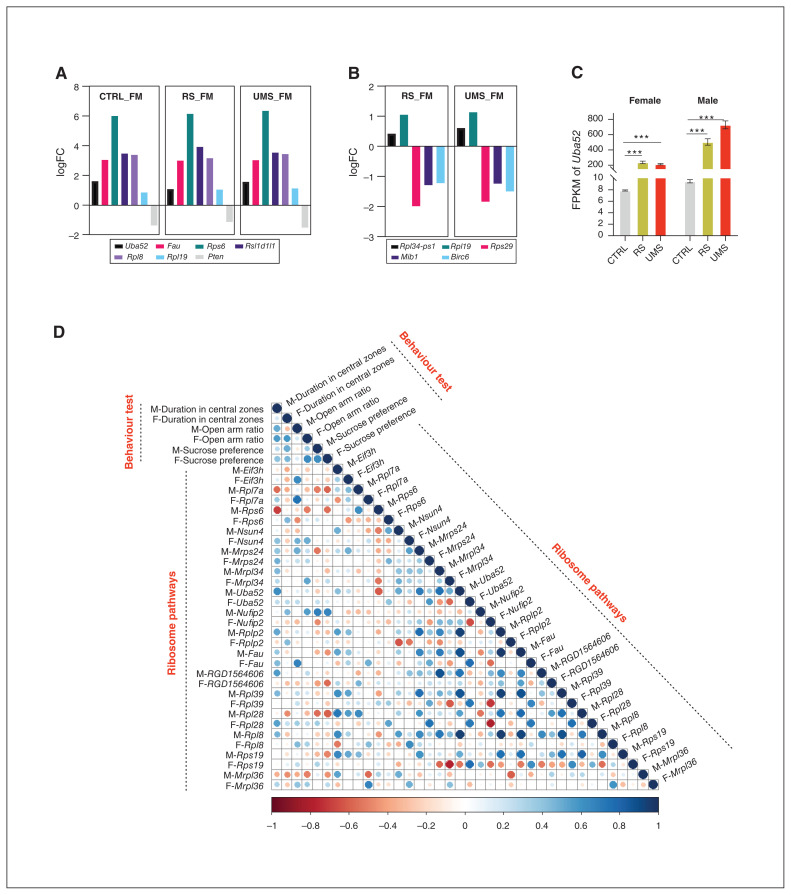
Results: Female rats exposed to either UMS or RS showed no negative effects on anxiety-like behaviours, whereas the emotional functions of the PFC were impaired markedly in stressed male rats. Leveraging differentially expressed genes (DEG) analyses, we identified sex-specific transcriptional profiles associated with stress. There were many overlapping DEGs between UMS and RS transcriptional data sets, where 1406 DEGs were associated with both biological sex and stress, while only 117 DEGs were related to stress. Notably, Uba52 and Rpl34-ps1 were the first-ranked hub gene in 1406 and 117 DEGs respectively, and Uba52 was higher than Rp134-ps1, suggesting that stress may have led to a more pronounced effect on the set of 1406 DEGs. Pathway analysis revealed that 1406 DEGs were primarily enriched in ribosomal pathway. These results were confirmed by qRT-PCR.
Limitations: Sex-specific transcriptional profiles associated with stress were identified in this study, but more in-depth experiments, such as single-cell sequencing and manipulation of male and female gene networks in vivo, are needed to verify our findings.
Conclusion: Our findings show sex-specific behavioural responses to stress and highlight sexual dimorphism at the transcriptional level, shedding light on developing sex-specific therapeutic strategies for stress-related psychiatric disorders.
© 2023 CMA Impact Inc. or its licensors.
Conflict of interest statement
Competing interests: None declared.
Figures


Similar articles
-
Predictable maternal separation confers adult stress resilience via the medial prefrontal cortex oxytocin signaling pathway in rats.Mol Psychiatry. 2021 Dec;26(12):7296-7307. doi: 10.1038/s41380-021-01293-w. Epub 2021 Sep 24. Mol Psychiatry. 2021. PMID: 34561611
-
Sex-specific transcriptional signatures in human depression.Nat Med. 2017 Sep;23(9):1102-1111. doi: 10.1038/nm.4386. Epub 2017 Aug 21. Nat Med. 2017. PMID: 28825715 Free PMC article.
-
Sexual dimorphic effects of restraint stress on prefrontal cortical function are mediated by glucocorticoid receptor activation.Eur J Neurosci. 2022 May;55(9-10):2754-2765. doi: 10.1111/ejn.15203. Epub 2021 Apr 5. Eur J Neurosci. 2022. PMID: 33759255
-
Postnatal serotonin type 2 receptor blockade prevents the emergence of anxiety behavior, dysregulated stress-induced immediate early gene responses, and specific transcriptional changes that arise following early life stress.Biol Psychiatry. 2011 Dec 1;70(11):1024-32. doi: 10.1016/j.biopsych.2011.08.005. Epub 2011 Sep 28. Biol Psychiatry. 2011. PMID: 21959103 Free PMC article.
-
Investigating transcriptome-wide sex dimorphism by multi-level analysis of single-cell RNA sequencing data in ten mouse cell types.Biol Sex Differ. 2020 Nov 5;11(1):61. doi: 10.1186/s13293-020-00335-2. Biol Sex Differ. 2020. PMID: 33153500 Free PMC article.
Cited by
-
Sex-Specific Effects of Early-Life Stress Exposure on Memory Performance and the Medial Prefrontal Cortex Transcriptomic Pattern in Adolescent Mice.Mol Neurobiol. 2025 Jul;62(7):8728-8737. doi: 10.1007/s12035-025-04803-x. Epub 2025 Mar 4. Mol Neurobiol. 2025. PMID: 40038196 Free PMC article.
-
ESA VIVALDI Dry Immersion Microgravity Simulations Induce Increases in Immune Biomarkers Associated With Physical and Psychological Stress, and Sex-Specific Factors.FASEB J. 2025 Sep 15;39(17):e70993. doi: 10.1096/fj.202502198R. FASEB J. 2025. PMID: 40892712 Free PMC article. Clinical Trial.
-
Sex-differences in proteasome-dependent K48-polyubiquitin signaling in the amygdala are developmentally regulated in rats.Biol Sex Differ. 2023 Nov 10;14(1):80. doi: 10.1186/s13293-023-00566-z. Biol Sex Differ. 2023. PMID: 37950270 Free PMC article.
-
Is there something sexual in the ventral midline thalamus?Brain Struct Funct. 2025 Jan 6;230(1):26. doi: 10.1007/s00429-024-02869-2. Brain Struct Funct. 2025. PMID: 39760747 Review.
-
Transcriptomic analysis of rat prefrontal cortex following chronic stress induced by social isolation - Relevance to psychiatric and neurodevelopmental illness, and implications for treatment.Neurobiol Stress. 2024 Oct 17;33:100679. doi: 10.1016/j.ynstr.2024.100679. eCollection 2024 Nov. Neurobiol Stress. 2024. PMID: 39502833 Free PMC article.
References
-
- Wei J, Yuen EY, Liu W, et al. . Estrogen protects against the detrimental effects of repeated stress on glutamatergic transmission and cognition. Mol Psychiatry 2014;19:588–98. - PubMed
-
- Zeanah CH, Egger HL, Smyke AT, et al. . Institutional rearing and psychiatric disorders in Romanian preschool children. Am J Psychiatry 2009;166:777–85. - PubMed
Publication types
MeSH terms
LinkOut - more resources
Full Text Sources
Miscellaneous