Resistance and endurance exercise training improves muscle mass and the inflammatory/fibrotic transcriptome in a rhabdomyosarcoma model
- PMID: 36797054
- PMCID: PMC10067492
- DOI: 10.1002/jcsm.13185
Resistance and endurance exercise training improves muscle mass and the inflammatory/fibrotic transcriptome in a rhabdomyosarcoma model
Abstract
Background: Rhabdomyosarcoma (RMS) is an aggressive soft tissue sarcoma that most often develops in children. Chemoradiation therapy is a standard treatment modality; however, the detrimental long-term skeletal muscle consequences of this therapy in juvenile cancer survivors include muscle atrophy and fibrosis resulting in decreased physical performance. Using a novel model of murine resistance and endurance exercise training, we investigate its role in preventing the long-term effects of juvenile RMS plus therapy.
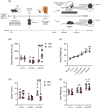
Methods: Four-week-old male (n = 10) and female (n = 10) C57Bl/6J mice were injected with M3-9-M RMS cell into the left gastrocnemius with the right limb serving as an internal control (CON). Mice received a systemic vincristine injection and then five doses of 4.8 Gy of gamma radiation localized to the left hindlimb (RMS + Tx). Mice were then randomly divided into either sedentary (SED) or resistance and endurance exercise training (RET) groups. Changes in exercise performance, body composition, myocellular adaptations and the inflammatory/fibrotic transcriptome were assessed.
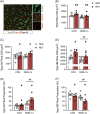
Results: RET improved endurance performance (P < 0.0001) and body composition (P = 0.0004) compared to SED. RMS + Tx resulted in significantly lower muscle weight (P = 0.015) and significantly smaller myofibre cross-sectional area (CSA) (P = 0.014). Conversely, RET resulted in significantly higher muscle weight (P = 0.030) and significantly larger Type IIA (P = 0.014) and IIB (P = 0.015) fibre CSA. RMS + Tx resulted in significantly more muscle fibrosis (P = 0.028), which was not prevented by RET. RMS + Tx resulted in significantly fewer mononuclear cells (P < 0.05) and muscle satellite (stem) cells (MuSCs) (P < 0.05) and significantly more immune cells (P < 0.05) than CON. RET resulted in significantly more fibro-adipogenic progenitors (P < 0.05), a trend for more MuSCs (P = 0.076) than SED and significantly more endothelial cells specifically in the RMS + Tx limb. Transcriptomic changes revealed significantly higher expression of inflammatory and fibrotic genes in RMS + Tx, which was prevented by RET. In the RMS + Tx model, RET also significantly altered expression of genes involved in extracellular matrix turnover.
Conclusions: Our study suggests that RET preserves muscle mass and performance in a model of juvenile RMS survivorship while partially restoring cellular dynamics and the inflammatory and fibrotic transcriptome.
Keywords: cachexia; cancer; chemotherapy; exercise; fibro-adipogenic progenitors; fibrosis; inflammation; muscle satellite cells; radiation.
© 2023 The Authors. Journal of Cachexia, Sarcopenia and Muscle published by John Wiley & Sons Ltd on behalf of Society on Sarcopenia, Cachexia and Wasting Disorders.
Conflict of interest statement
The authors declare no conflicts of interest.
Figures


Similar articles
-
Radiation induces long-term muscle fibrosis and promotes a fibrotic phenotype in fibro-adipogenic progenitors.J Cachexia Sarcopenia Muscle. 2023 Oct;14(5):2335-2349. doi: 10.1002/jcsm.13320. Epub 2023 Sep 6. J Cachexia Sarcopenia Muscle. 2023. PMID: 37671686 Free PMC article.
-
Single-cell transcriptomic analysis reveals alterations to cellular dynamics and paracrine signaling in radiation-induced muscle pathology.Am J Physiol Cell Physiol. 2025 Jun 1;328(6):C1995-C2012. doi: 10.1152/ajpcell.00115.2025. Epub 2025 May 2. Am J Physiol Cell Physiol. 2025. PMID: 40316295
-
Muscle-specific functional deficits and lifelong fibrosis in response to paediatric radiotherapy and tumour elimination.J Cachexia Sarcopenia Muscle. 2022 Feb;13(1):296-310. doi: 10.1002/jcsm.12902. Epub 2022 Jan 8. J Cachexia Sarcopenia Muscle. 2022. PMID: 34997696 Free PMC article.
-
Chronic inflammation in skeletal muscle impairs satellite cells function during regeneration: can physical exercise restore the satellite cell niche?FEBS J. 2018 Jun;285(11):1973-1984. doi: 10.1111/febs.14417. Epub 2018 Mar 8. FEBS J. 2018. PMID: 29473995 Review.
-
Nutritional Regulation of Muscle Stem Cells in Exercise and Disease: The Role of Protein and Amino Acid Dietary Supplementation.Front Physiol. 2022 Jul 7;13:915390. doi: 10.3389/fphys.2022.915390. eCollection 2022. Front Physiol. 2022. PMID: 35874517 Free PMC article. Review.
Cited by
-
Stuart has got the PoWeR! Skeletal muscle adaptations to a novel heavy progressive weighted wheel running exercise model in C57BL/6 mice.Exp Physiol. 2024 Feb;109(2):271-282. doi: 10.1113/EP091494. Epub 2023 Nov 16. Exp Physiol. 2024. PMID: 37974360 Free PMC article.
-
Exercise and survival benefit in cancer patients: evidence from a comprehensive meta-analysis.Geroscience. 2025 Jun;47(3):5235-5255. doi: 10.1007/s11357-025-01647-0. Epub 2025 Apr 12. Geroscience. 2025. PMID: 40220151 Free PMC article.
-
Explainable machine learning model for predicting skeletal muscle loss during surgery and adjuvant chemotherapy in ovarian cancer.J Cachexia Sarcopenia Muscle. 2023 Oct;14(5):2044-2053. doi: 10.1002/jcsm.13282. Epub 2023 Jul 12. J Cachexia Sarcopenia Muscle. 2023. PMID: 37435785 Free PMC article.
-
Contemporary preclinical mouse models for pediatric rhabdomyosarcoma: from bedside to bench to bedside.Front Oncol. 2024 Feb 2;14:1333129. doi: 10.3389/fonc.2024.1333129. eCollection 2024. Front Oncol. 2024. PMID: 38371622 Free PMC article.
-
Radiomics for preoperative pancreatic ductal adenocarcinoma risk stratification: Cross-population validation, multidimensional integration, challenges, and future directions.World J Radiol. 2025 Jul 28;17(7):110048. doi: 10.4329/wjr.v17.i7.110048. World J Radiol. 2025. PMID: 40746518 Free PMC article.
References
-
- Amer KM, Thomson JE, Congiusta D, Dobitsch A, Chaudhry A, Li M, et al. Epidemiology, incidence, and survival of rhabdomyosarcoma subtypes: SEER and ICES database analysis. J Orthop Res 2019;37:2226–2230. - PubMed
-
- Paulino AC. Late effects of radiotherapy for pediatric extremity sarcomas. Int J Radiat Oncol Biol Phys 2004;60:265–274. - PubMed
-
- Stubblefield MD. Radiation fibrosis syndrome: neuromuscular and musculoskeletal complications in cancer survivors. PM R 2011;3:1041–1054. - PubMed
Publication types
MeSH terms
Grants and funding
LinkOut - more resources
Full Text Sources

