. 2023 Feb 16;14(1):887.
doi: 10.1038/s41467-023-36410-6.

The ULK3 kinase is a determinant of keratinocyte self-renewal and tumorigenesis targeting the arginine methylome

Affiliations

The ULK3 kinase is a determinant of keratinocyte self-renewal and tumorigenesis targeting the arginine methylome

Sandro Goruppi et al. Nat Commun. .

Abstract

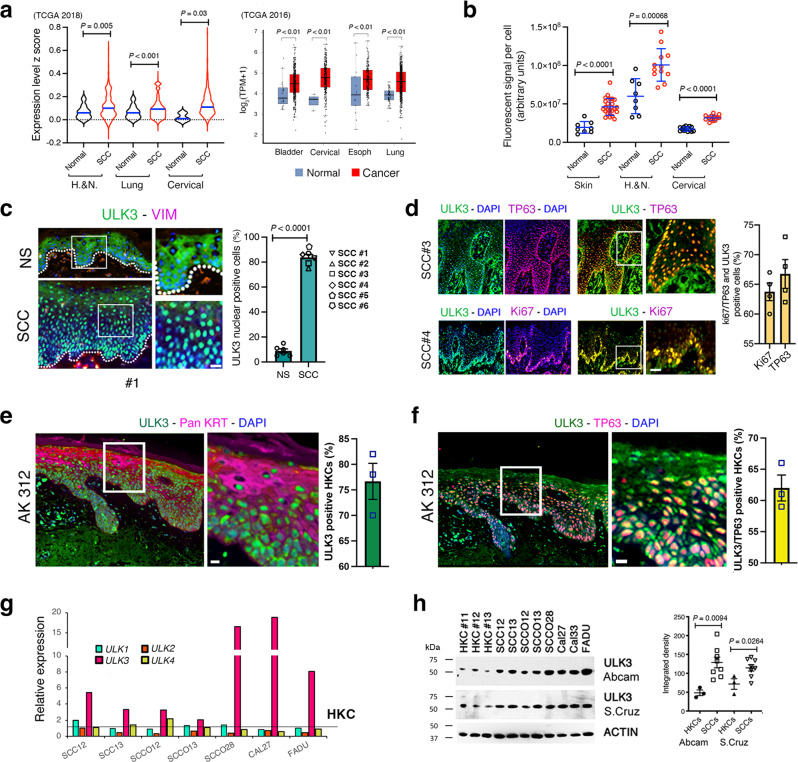
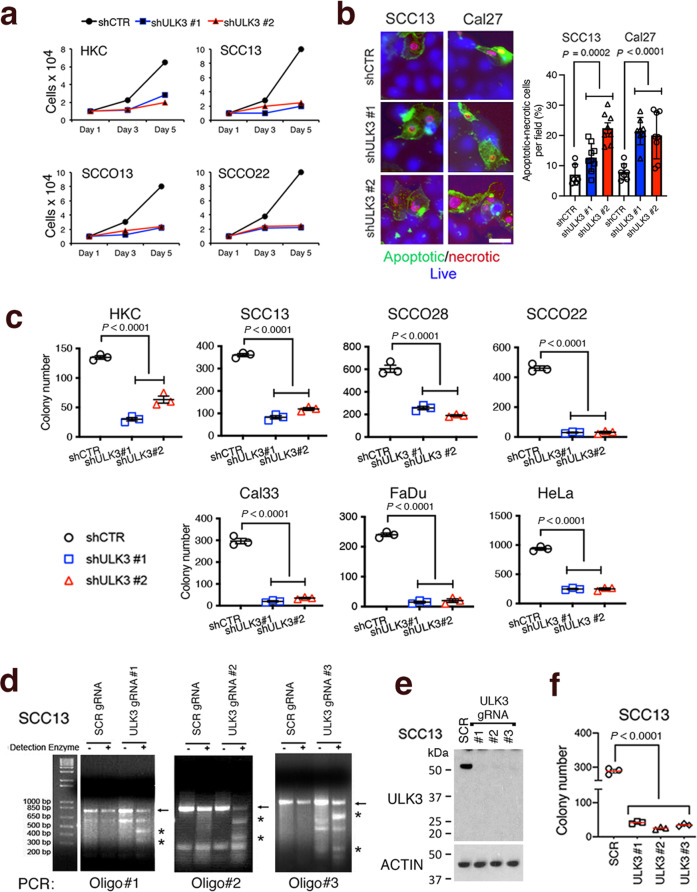
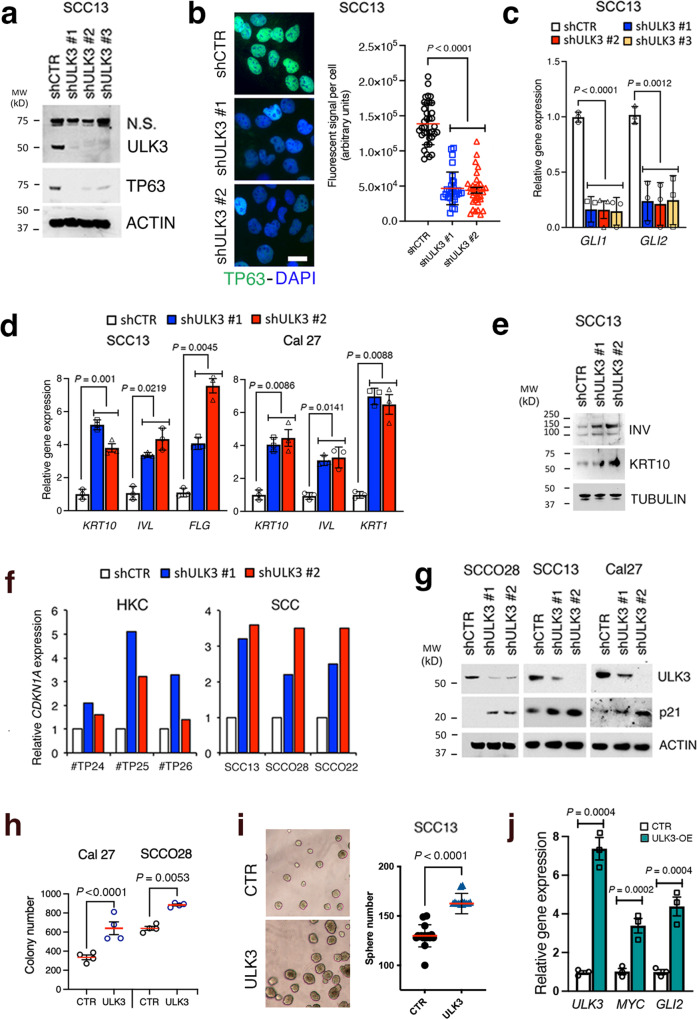
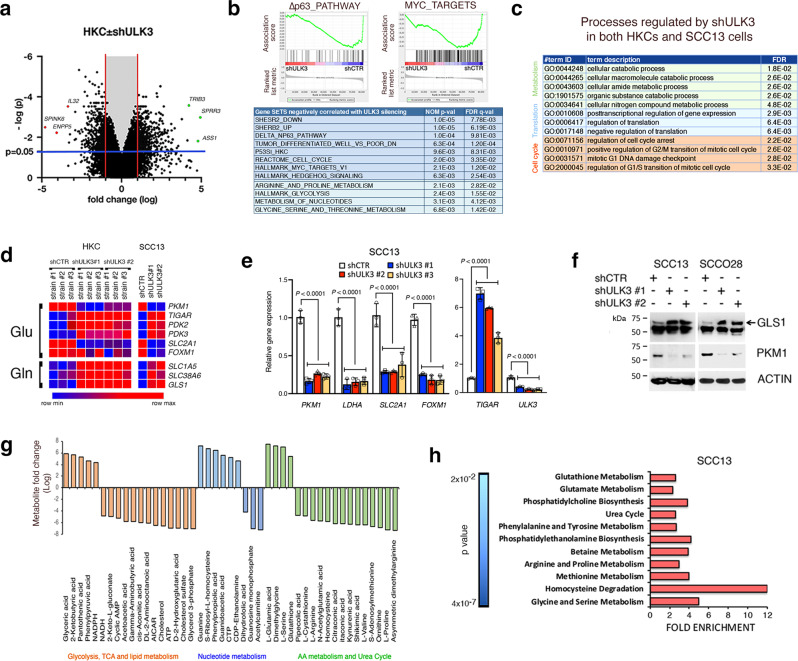
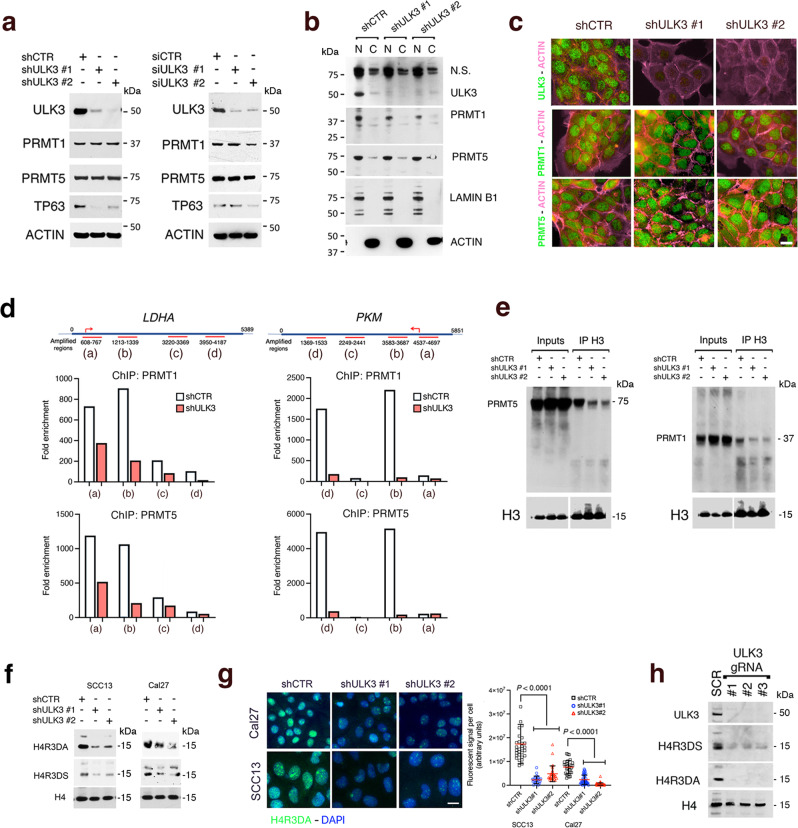
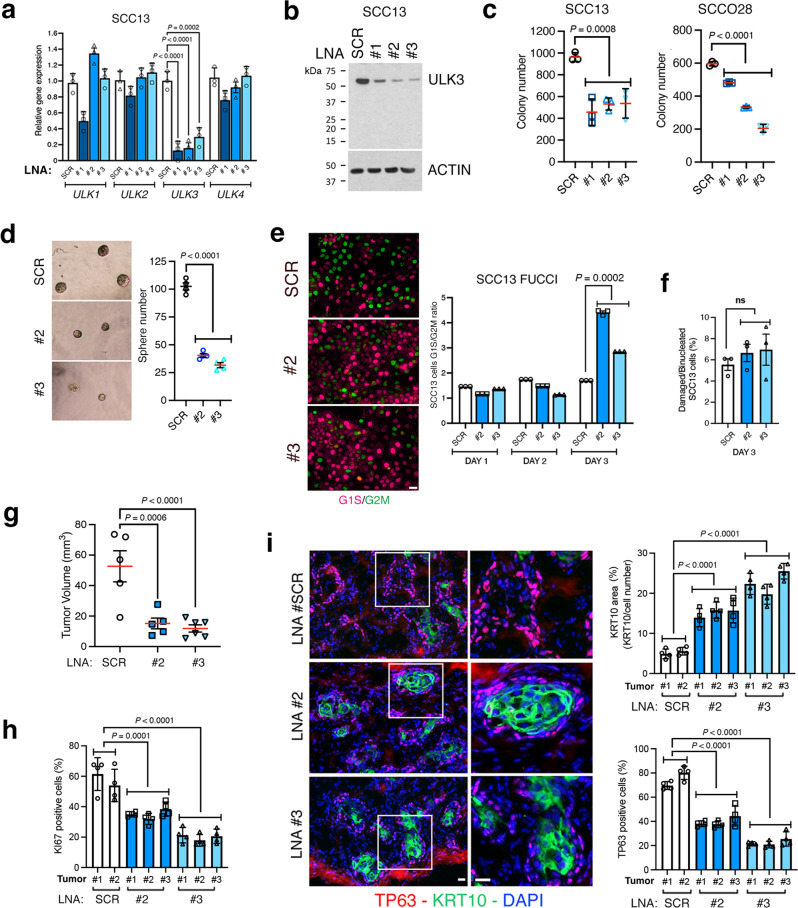
Epigenetic mechanisms oversee epidermal homeostasis and oncogenesis. The identification of kinases controlling these processes has direct therapeutic implications. We show that ULK3 is a nuclear kinase with elevated expression levels in squamous cell carcinomas (SCCs) arising in multiple body sites, including skin and Head/Neck. ULK3 loss by gene silencing or deletion reduces proliferation and clonogenicity of human keratinocytes and SCC-derived cells and affects transcription impinging on stem cell-related and metabolism programs. Mechanistically, ULK3 directly binds and regulates the activity of two histone arginine methyltransferases, PRMT1 and PRMT5 (PRMT1/5), with ULK3 loss compromising PRMT1/5 chromatin association to specific genes and overall methylation of histone H4, a shared target of these enzymes. These findings are of translational significance, as downmodulating ULK3 by RNA interference or locked antisense nucleic acids (LNAs) blunts the proliferation and tumorigenic potential of SCC cells and promotes differentiation in two orthotopic models of skin cancer.


Conflict of interest statement

The authors declare no competing interests.

Figures

Fig. 1
Fig. 1. ULK3 is upregulated in clinical SCC samples and SCC cells.
a ULK3 expression in TCGA profiles of Head/Neck (H&N), Lung, and Cervical Squamous Cell Carcinomas (SCCs) versus matched normal tissues updated to 2018. Individual z-scores values, mean ± SEM, P < 0.01, two-tailed unpaired t-test. Box plots show ULK3 levels in the indicated SCCs versus normal tissues in TCGA datasets updated to 2016 as in ref. . GEPIA-generated median, box (25–75%) and whiskers (5–95%), log(transcript per million+1), value cutoff P < 0.01. b Quantification of Skin, H&N and Cervical SCCs tissue arrays ULK3 immunostaining with unmatched (Skin and H&N) or matched (Cervical) non-affected tissues. Skin: n(Normal = 8, SCC = 24); H&N: n(Normal = 8, SCC = 26); Cervical: n(Normal = 14, SCC = 14), mean ± SEM, P < 0.001, two-tailed unpaired t-test. c ULK3 (green) and VIMENTIN (magenta) immunofluorescence and quantification of nuclear ULK3 in normal skin (NS) and skin SCC. Representative low and high magnifications, n(NSs/SCCs) = 6, mean ± SEM, P < 0.0001, two-tailed unpaired t-test. Scale bar 10 µm. ULK3 immunofluorescence of additional NSs/SCCs is in Supplementary Fig. 1a. d ULK3 (green) and Ki67 (magenta) or TP63 (magenta) immunofuorescence of skin SCCs (SCC#3 and SCC#4). Representative low and high magnifications with quantification of double nuclear ULK3/TP63 (yellow) or ULK3/Ki67 (yellow) positivity. n(SCCs) = 4, mean ± SEM, Scale bar 20 µm. e ULK3 (green) and pankeratin (magenta) immunostaining with quantification of ULK3 in actinic keratosis lesions (AKs). Representative low and high magnifications, n(AKs) = 3, mean ± SEM. Scale bar 5 µm. f ULK3 (green) and TP63 (magenta) immunostaining with quantification of ULK3/TP63 positive cells (yellow) in AKs. Representative low and high magnifications, n(AKs) = 3, mean ± SEM. Scale Bar 5 µm. Additional AK ULK3/TP63 immunostaining is in Supplementary Fig. 1b, c. g RT-qPCR analysis of ULK family members (ULK1-4), normalized to 36β4, in SCC cells versus average level (solid line) in human keratinocytes (HKCs) (strains #GB2- #GB10). n(HKCs) = 9, n(SCCs) = 7. Representative experiment of two independent biological replicates. RT-qPCR of ULK1-4 in each HKCs and SCCs are in Supplementary Fig. 1d. h Immunoblot and densitometric quantification of ULK3 in HKCs (#GB11- #GB13) and SCC cells (normalized to ß-ACTIN). n(HKCs) = 3, n(SCCs) = 8, mean ± SEM, P < 0.05, two-tailed unpaired t-test. The researcher’s initials and a number identify each primary HKC strain. A number identifies patient-derived SCC samples.
Fig. 2
Fig. 2. The proliferative potential of HKCs and SCC cells is suppressed by ULK3 downmodulation.
a Cell growth on days 3 and 5 of HKC (strain #TP26) and of three SCC cell lines infected with two ULK3 silencing lentiviruses (shULK3 #1, #2) versus empty control vector (shCTR) plated in triplicate at low-density. Representative experiment of two independent biological replicates. The efficient downregulation of ULK3 in HKCs and SCC cells is in Supplementary Fig. 2a, b. b Live fluorescence images of SCC13 and Cal27 cells infected with two ULK3 silencing lentiviruses, or control virus, and stained for early- (phosphatidylserine-FITC, green), late- apoptosis (7-aminoactinomycin D, magenta) and for all viable cells (CytoCalcein, violet-blue). Quantification, in duplicate cultures, SCC13 n(fields/shCTR) = 6, n(fields/shULK3) = 25; Cal27 n(fields/shCTR) = 7, n(fields/shULK3) = 24, n(cells/field) > 90, mean ± SEM, P < 0.001 or P < 0.0001 one-way ANOVA. Scale bar 10 µm. c Colony formation of HKCs (strain # TP26), five SCC cell lines and HeLa cells infected with two ULK3 silencing lentiviruses, or a control virus, and plated at limited cell density for one week. Crystal violet stained dishes were quantified using ImageJ. n(dishes) = 3, mean ± SEM, P < 0.0001, one-way ANOVA. Representative images of the stained colonies are in Supplementary Fig. 2c. Supplementary Fig. 2d-e show similar assays with SCC cells treated with the ULK3 inhibitor SU6668. d Surveyor Assay of SCC13 cells one week after the infection with lentiviruses co-expressing the Cas9 enzyme and one of the three RNA guides targeting ULK3 (gRNA ULK3 #1-3), or a scrambled control gRNA (SCR gRNA). Each targeted genomic region (amplified using corresponding oligo pairs (#1-3) (-)) was tested for DNA mismatch by PCR by incubation with single-strand DNAse. (+). In control reactions, we used genomic DNA from SCR-infected SCC13 cells. The arrows indicate the amplified region and the asterisks the DNAase cleavage products. e ULK3 and ß-ACTIN immunoblotting of SCC13 cells one week after the infection with ULK3 gRNA (#1-3), versus a scrambled gRNA (SCR) lentiviruses. f Colony formation of SCC13 cells, plus/minus ULK3 deletion as above, plated at limited dilution for six days. n(dishes) = 3, mean ± SEM, P < 0.0001, one-way ANOVA.
Fig. 3
Fig. 3. ULK3 silencing downmodulates proliferation/stem markers while upregulating differentiation genes and cell cycle inhibitor p21.
a ULK3, TP63 and ß−ACTIN immunoblotting of SCC13 cells infected with three ULK3 silencing lentiviruses (shULK3#1-3), or an empty vector (shCTR), for one week. b TP63 (green) immunostaining and quantification of fluorescence signal intensity of SCC13 cells infected with two ULK3-silencing (shULK3 #1 and #2) versus a control (shCTR) lentivirus for one week. Individual cell values and mean ± SD, n(cells) > 40, P < 0.0001, one-way ANOVA. Scale bar 7 µm. c RT-qPCR analysis of GLI1 and GLI2 expression, normalized to 36β4, in SCC13 cells plus/minus infection with ULK3 silencing or control lentiviruses as in panel (a). n(dishes) = 3, mean ± SEM, P < 0.01, one-way ANOVA. d RT-qPCR analysis of the indicated genes, normalized to 36β4, in SCC cells infected with two ULK3 silencing lentiviruses or a control virus. n(dishes) = 3, mean ± SEM, P < 0.001, one-way ANOVA. e Keratin 10 (KRT10), INVOLUCRIN (INV) and ß−ACTIN (ACTIN) immunoblotting of SCC13 cells with two ULK3 silencing lentiviruses for one week versus a control virus. f RT-qPCR analysis of CDKN1A, normalized to 36ß4, of HKCs (strains # TP24, # TP25, # TP26) and three SCC cell lines plus/minus ULK3 silencing for one week. n(HKCs) = 3, n(SCCs) = 3. g p21, ULK3 and ß−ACTIN immunoblotting of three SCC cell lines plus/minus ULK3 silencing for one week. n(SCC lines) = 3. h Colony formation assays of SCC cell lines infected with a ULK3 overexpressing lentivirus (ULK3), or an empty virus (CTR), and plated at low density for one week. n(dishes) = 4, mean ± SEM, P < 0.001, two-tailed unpaired t-test. i Sphere-forming capability of SCC13 cells infected with a ULK3 overexpressing virus (ULK3) or a control virus (CTR) and cultured for one week in Matrigel suspension as in. Representative phase contrast images and quantification of the number of spheres in four fields per dish. n(dishes/condition) = 4, mean ± SEM, P < 0.0001, two-tailed unpaired t-test. j RT-qPCR analysis of the indicated genes, normalized to 36β4, in SCC13 cells plus/minus ULK3 overexpression (white and green respectively) as tested in panel (i). n(dishes) = 3, mean ± SEM, P < 0.001, two-tailed unpaired t-test.
Fig. 4
Fig. 4. ULK3 controls gene expression and cellular metabolism.
a Volcano plot of genes regulated in HKCs (strains #TP24, #TP25, #TP31) infected with two ULK3 -silencing versus control lentiviruses (GSE: 183084). Marked are among most downregulated (magenta) and upregulated (green) genes. Clariom D analysis chip was made with Transcriptomic Analysis Console software (TAC) and plotted using Prism. Blue and red lines indicate the threshold of significance and ±1 fold change respectively, n(HKCs) = 3, P = 0.05, two-tailed t-test. b Gene set enrichment analysis (GSEA) of HKCs profiles with ULK3 gene silencing versus control as in (a). Enrichment plots of ∆Np63 and MYC -related signatures, and list of most significant signatures negatively associated with profiles of ULK3-silenced HKCs, divided as related to growth/differentiation (blue) or cellular metabolism (green). n(strains) = 3, P < 0.001, permutation-based p values. c Gene ontology (GO) analysis, by database for annotation, visualization and integrated discovery (DAVID), of the processes consistently regulated by ULK3 silencing in HKCs and SCC13 cells (GSE: 183084 and 183085), divided as pertinent to cell cycle (orange), translation (blue) and metabolism (green). d Heat map of expression values for components of Glycolytic (Glu) or Glutaminolytic (Gln) pathways, from the profiles of HKCs and SCC13 cells plus/minus ULK3 downregulation. Values visualized with Morpheus software. e RT-qPCR analysis of the indicated genes, normalized to 36β4, in SCC13 cells with or without ULK3 silencing. n(dishes) = 3, mean ± SEM, P < 0.0001, one-way ANOVA. f Glutaminase 1 (GLS1), Pyruvate Kinase M1 (PKM1) and ß−ACTIN immunoblots of SCC cells infected with two ULK3 (shULK3 #1, #2) versus control silencing (shCTR) lentiviruses. The arrow indicates upregulated GLS1. g Steady-state metabolite profile of SCC13 infected with two ULK3- versus control- silencing lentiviruses (MTBL S5155). After MetaboAnalyst software analysis, significantly modulated metabolites were grouped according to metabolic processes, ranked by fold changes (logFC). The values and the statistical analysis for glutathione and glutamate are in Supplementary Fig. 4. h Pathways affected by ULK3 downregulation in SCC13 cells as identified by metabolite set enrichment analysis. Fold enrichment of the top 11 most significantly affected pathways ranked according to p values. n(samples/condition) = 3, P < 0.0, two-tailed t-test.
Fig. 5
Fig. 5. ULK3 associates to chromatin regulatory regions of genes of functional significance.
a ULK3-bound peaks distribution as found by ChIP seq (chromatin immunoprecipitation followed by DNA sequencing) analysis of SCC13 cells with anti-ULK3 antibodies (GSE: 183933). Peaks number (count) per distance (bp) from the Transcriptional Start Site (TSS) of genes. Supplementary Fig. 5a shows the GO using DAVID software of biological processes related to the ULK3-bound genes. b Peaks distribution as found by ChIP-seq analysis with antibodies against acetylated lysine 27 of histone 3 (H3K27ac) in SCC13 cells plus/minus ULK3 silencing (GSE: 183933). Peaks number (count) per distance (bp) from the Transcriptional Start Site (TSS) of genes. ChIP-seq analysis was made using the Galaxy web platform. The magenta dashed lines indicate as a reference between control versus ULK3 silenced (shRNA) cells the 10-peaks value. c GO using DAVID software of most significant processes of ULK3-bound genes having downregulated H3K27ac peaks upon ULK3 silencing in SCC13 cells, as determined by ChIP seq analysis (GSE: 183933), P < 0.01, Fisher’s exact test. Supplementary Fig. 5b shows the Venn diagram of ULK3-bound genes having downregulated H3K27ac peaks upon ULK3 silencing. df Graphic illustration of ULK3- and H3K27ac -binding peaks localization on two metabolic genes (LDHA and PKM) and a transcription factor (FOXM1) in SCC13 cells infected with control versus ULK3 silencing lentiviruses, aligned using the integrative genomic viewer software (IGV). Position of the TSS, exons (boxes) and introns-transcribed regions from ENCODE. Blue squares mark the main areas with H3K27ac down-modulation upon ULK3 silencing. Supplementary Fig. 5c shows a similar analysis made on EP300 promoter. ChIP with antibodies against the indicated proteins of SCC13 cells infected with two ULK3 silencing (red and blue) versus control (white) lentiviruses, followed by qPCR amplification of the two regions indicated in the scheme of the PKM, LDHA and FOXM1 genes, to which ULK3 was found to bind by CHIP-seq analysis. Results are expressed as enrichment fold relative to non-immune antibodies, n(experiments) = 2. Supplementary Fig. 5d provides a similar analysis for the specificity control gene TUBA1A.
Fig. 6
Fig. 6. ULK3 associates with the arginine methylases PRMT1 and PRMT5.
a GSEA of HKCs profiles with PRMT1 silencing by siRNA versus up- or down- regulated signatures from HKCs with ULK3 silencing, P < 0.001, permutation-based p. The Venn diagram of genes modulated by ULK3 silencing and bound by ULK3 in ChIP-seq in SCC13 cells is in Supplementary Fig. 6a. The list of the genes modulated by siPRMT1 and shULK3 in HKCs is in Supplementary Fig. 6b. b Proximity ligation assays (PLA) of two SCC cell lines with anti -ULK3 and -PRMT1 or -PRMT5 antibodies, with anti-ULK3 alone or IgG as controls. Representative images and quantification of the magenta puncta from the juxtaposition of ULK3 and PRMT1 or PRMT5 antibodies, n(cells/condition) =  75, mean ± SEM, P < 0.01, two-tailed unpaired t-test. Scale bar 5 µm. c Immunoprecipitations (IP) with anti -ULK3 (ULK3) or IgG antibodies from SCC13 cells followed by PRMT1 and PRMT5 immunoblotting (left), and IPs with anti -PRMT1, -PRMT5, or IgG antibodies followed by ULK3 immunoblotting (right). Inputs were run on the same gel. d ULK3 protein map with indicated the kinase and the microtubule-interacting (MIT1/2) domains, the positions of inactivating mutations (K139R and K44H),, C-terminus truncation (∆C) and epitope tags (FLAG or V5). Analysis of HEK293T cells transfected with the indicated expression vectors followed by IP with anti-epitope antibodies (IP TAG) and immunoblotting with the indicated antibodies. e Analysis of HeLa cells mock-transfected or transfected with the indicated vectors followed by IP with FLAG antibodies (IP FLAG) and immunoblotting with the indicated antibodies. f PLA with anti -PRMT1 or -PRMT5 and anti -phosphorylated Ser/Thr (P-S/T) antibodies in HeLa cells infected with an ULK3-silencing (shULK3#1) versus control (shCTRL) lentivirus. IgGs and anti-PRMT antibodies alone served as controls. Representative images and quantification of the magenta puncta from the juxtaposition of the antibodies. n(fields/condition) =  6, mean ± SEM, P < 0.01, two-tailed unpaired t-test. Scale bar 10 µm. g HeLa cells were either mock transfected (M) or transfected with expression vectors for FLAG-PRMT1 or FLAG-PRMT5 alone or in combination with wild-type ULK3 (ULK3 + PRMT1 and ULK3 + PRMT5). Total extracts (Inputs) and the proteins eluted (fractions E1–E3) from a phosphoprotein-binding resin (Talon), were analyzed by FLAG immunoblotting and quantified.
Fig. 7
Fig. 7. ULK3 binds directly to PRMT1 and PRMT5 and controls their activity.
a Immunoblot analysis of recombinant FLAG-tagged -PRMT1 (200 ng) or -PRMT5 (200 ng) admixed with His-tagged ULK3 (200 ng) and pulled-down with a Ni-NTA resin (NTA). The same amounts of proteins were incubated with the resin singularly as controls. Sequential FLAG and ULK3 immunoblots. b Recombinant PRMT1 and PRMT5 were incubated with ULK3 as above before PRMT pull-down with anti-FLAG antibodies. Immunoblots were probed as indicated. c Recombinant PRMT1 and PRMT5 plus/minus heating for 20 min at 90 °C (h) before incubation with ULK3, NTA pull-down, and sequential immunoblot analysis as in (a). d Recombinant PRMT1 and PRMT5 were incubated with recombinant ULK3 for 30 minutes at 37°C in kinase buffer containing 200 µM ATP. Proteins were separated on a Phos-TAG gel, which delays the migration of phosphorylated proteins, followed by immunoblot analysis with the indicated antibodies. Parallel kinase reactions contained 1 and 10 µM ULK3 inhibitor SU6668. The immunoblot analysis of the same samples in Fig. 7d separated by SDS-PAGE is in Supplementary Fig. 7a. A kinase assay with PRMT1 plus/minus heat treatment prior to ULK3 kinase assay is in Supplementary Fig. 7b. e In vitro ULK3 kinase assay using recombinant GFP as substrate. Proteins were admixed as in (d) before western blot analysis using the indicated antibodies. f, g Impact of ULK3 on PRTM1 and PRMT5 activity. Increasing amounts of PRMT1 or PRMT5 (0, 50, 100, 200, 400 ng) were incubated with (red bars) or without ULK3 (white bars) as in (d), followed by the methylation reaction (with 50µM S-adenosyl-methionine) of recombinant histone 4 (H4) (0.5 µg). Quantification of H4 arginine 3 asymmetric-, for PRMT1 activity (f), or symmetric-, for PRMT5 activity (g), dimethylation by dot blots analysis with antibodies specific for these epigenetic modifications. Mean ± SD, n(dot blot/condition) = 3, P < 0.001, two-tailed unpaired t-test. Supplementary Fig. 7c shows symmetric and asymmetric dimethylated arginine immunoblottings of methylation assays using ULK3 as a substrate. Supplementary Fig. 7d shows an immunoblot with the same antibodies of ULK3 and truncated ULK3 IP from transfected HEK293 cells.
Fig. 8
Fig. 8. ULK3 loss impairs PRMT1/5 chromatin association and function.
a Immunoblots against the indicated proteins of SCC13 cells with ULK3 silencing by two shRNAs (shULK3 #1, #2) for 1 week or with two siRNAs (siULK3#1, 2) for 48 h, with corresponding controls. b Immunoblots of nuclear (N) and cytosolic (C) fractions from SCC13 cells with ULK3 silencing by two shRNA-specific versus control lentiviruses. The blots were sequentially probed with the indicated antibodies. c PRMT1, PRMT5 and ULK3 immunostaining (green) of SCC13 cells plus/minus ULK3 silencing with two lentiviruses versus control virus. Phalloidin labeled actin cytoskeleton (magenta). Scale bar 5 µm. d ChIP with anti -PRMT1 and -PRMT5 antibodies from SCC13 cells plus/minus ULK3 silencing followed by qPCR amplification of four regions of the PKM and LDHA genes. The position of amplified regions (magenta lines) and TSS (arrow) are shown. Results are expressed as enrichment fold relative to IgGs as in. e ChIPs with anti-histone 3 (H3) antibodies followed by PRMT1, PRMT5 and H3 immunoblotting from SCC13 cells plus/minus ULK3 silencing. For H3, the immunoblots of inputs and immunoprecipitations are shown at different exposure times. f Asymmetrically (H4R3DA) and symmetrically (H4R3DS) dimethylated arginine 3 of histone 4 immunoblotting in SCC cells plus/minus ULK3 silencing for one week, with anti-histone H4 as a loading control. An additional H4R3DS and H4R3DA immunoblot upon ULK3 silencing is in Supplementary Fig. 8a. g H4R3DA (green) immunofluorescence of two SCC cell lines plus/minus ULK3 silencing, with DAPI (blue) as nuclear staining. Representative images and quantification of individual cells fluorescence signal, Cal27: n(cell/condition) = 35; SCC13: n(cells/condition) = 30, mean ± SD, P < 0.0001, one-way ANOVA. Scale bar 5 µm. An additional experiment is in Supplementary Fig. 8b. Supplementary Fig. 8c, d show immunoblot and immunostaining with anti -H4R3DS, -H4R3DA, and H4 antibodies of HeLa cells plus/minus ULK3 silencing. h H4R3DA, H4R3DS, total H4 and ULK3 immunoblotting of SCC13 cells with CRISPR/Cas9-mediated ULK3 gene deletion with three guide RNA (gRNA) versus control (SCR), as in Fig. 2d. A similar analysis of HEK293T cells plus/minus CRISPR/Cas9-mediated ULK3 gene deletion is in Supplementary Fig. 8e.
Fig. 9
Fig. 9. ULK3 downregulation suppresses SCC growth in vivo.
a, b Ear injection skin SCC model. SCC13 (a) and SCCO28 (b) cells expressing an enhanced green fluorescence protein (EGFP) were infected with two ULK3-silencing or control lentiviruses. Mice (NOD/SCID-Prkdcscid; CB-17) received contralateral ear injections of either ULK3- or control- silenced cells. Representative fluorescence with phase-contrast image superimposition of two ear pairs three weeks after injection and quantification of all tumor volumes (V = (length × width2) × 0.5)) for SCC13 cells (a). For SCCO28 cells (b) the quantification of all tumor volumes was as (integrated density × area of GFP fluorescence, normalized to Day 1). n(mice/SCC cell line) = 20, mean ± SEM, P < 0.01, two-tailed unpaired t-test. Green histograms show the number of tumors obtained with each lentivirus after three weeks. c-g Intradermal backskin injection SCC model. Cal27 and SCC13 cells plus/minus ULK3-silencing were injected (8/condition) with Matrigel in contralateral back sites of mice (NOD/SCID IL2Rγ−/−). c Tumor volumes were measured as in (a). Mean ± SEM, SCC13 n(tumors/shCTR) =  7, n(tumors/shULK3) = 7; Cal27 n(tumors/shCTR) =  8, n(tumors/shULK3) = 5, P < 0.001, two-tailed unpaired t-test. d Quantification of Ki67 immunofluorescence of tumors formed by SCC cells plus/minus ULK3 silencing. Anti-pankeratin (panKRT) antibodies identified injected cells and DAPI stained the nuclei. Mean ± SEM, three fields per tumor, n(tumors/condition) = 4, P < 0.001, two-tailed unpaired t-test. Scale bar 30 µm. e Keratin 10 (KRT10, green) and panKRT (magenta) immunofluorescence of the SCC tumors as above. Representative images and quantification of fluorescence signal (area (%)/field), mean ± SEM, three fields per tumor, SCC13: n(tumors/condition) = 5, Cal27: n(tumors/condition) = 3, P < 0.001, two-tailed unpaired t-test. Scale bar 30 µm. f TP63 (magenta) and panKRT (green) immunofluorescence of tumors formed by SCC13 cells plus/minus ULK3 silencing. Representative images and quantification of fluorescence signal (% TP63 + panKRT positive cells/section), mean ± SEM, four fields per tumor, n(tumors/condition) = 3, P < 0.001, two-tailed unpaired t-test. Scale bar 30 µm. g H4R3DA (green) and panKRT (magenta) immunofluorescence, with DAPI nuclear staining, of SCC13 cell tumors plus/minus ULK3 silencing. Representative images and quantification of single cell nuclear fluorescent signal, shCTR: n(cells/ tumor #1) = 66, n(cells/ tumor #2) = 72; shULK3#1: n(cells/ tumor #1) = 72, n(cells/ tumor #2) = 58, n(cells/ tumor #3) = 66; shULK3#2: n(cells/ tumor)#1 = 68, n(cells/ tumor #2) = 58, n(cells/ tumor #3) = 67, mean ± SEM, P < 0.001, one-way ANOVA. Scale bar 5 µm.
Fig. 10
Fig. 10. ULK3 targeting with locked nucleic acid (LNAs) suppresses SCC self-renewal and tumorigenicity.
a RT-qPCR analysis of ULK family members (ULK1-4) in SCC13 cells 72 h after transfection with three locked antisense nucleic acids (LNAs) targeting ULK3 (#1-3) or scrambled control (SCR). Mean ± SEM, n(experiments) = 3, P < 0.001, P < 0.0001, two-tailed unpaired t-test. b ULK3 and ß-ACTIN immunoblots of SCC13 cells treated as in (a). c Colony forming assays of SCC cell lines transfected as in (a) and plated at low-density for one week, n(dishes) = 3, mean ± SEM, P < 0.0001, one-way ANOVA. d Sphere-forming capability of SCC13 cells transfected with ULK3-targeting LNAs (#2, #3) or control (SCR), grown one week on Matrigel. Representative phase-contrast images and quantification of sphere number, n(dishes) = 4, mean ± SEM, P < 0.0001, one-way ANOVA. e Cell cycle distribution of SCC13 cells expressing fluorescence ubiquitin cell cycle indicators (FUCCI) after transfection with ULK3-targeting LNAs (#2, #3) or scrambled control (SCR). Day 3 representative images and quantification of G1/S (magenta) versus G2/M (green) reporter ratio over time (days). Mean ± SEM, n(dishes) = 3. Day 1: n(cells SCR) = 1405: n(cells LNA#2) = 1099, n(cells LNA#3) = 1551; Day 2: n(cells SCR) = 2205, n(cells LNA#2) = 2667, n(cells LNA#3) = 1266; Day3: n(cells SCR) = 1215, n(cells LNA#2) = 940, n(cells LNA#3) = 1726, P < 0.0001, one-way ANOVA. Scale bar 5 µm. f Percentage of cells treated as in (e) with nuclear damages (cytosolic DNA) or multinucleated, as detected by DAPI staining. Mean ± SEM, n(dishes/condition) = 3, n(cells SCR) = 860, n(cells LNA#2) = 906, n(cells LNA#3) = 911, ns: not significant, one-way ANOVA. g SCC13 cells 24 h after transfection with ULK3-targeting LNAs (#2, #3) or scrambled control were injected with Matrigel intradermally into the back of NOD/SCID (IL2Rγ-/-) mice for 10 days. Tumor size was calculated as (V = (length × width2) × 0.5)). Mean ± SEM, n(tumors/SCR) = 5, n(tumors/LNA) = 6, P < 0.001, and P < 0.0001, two-tailed unpaired t-test. h Ki67 and panKRT (to identify SCC cells) immunofluorescence of tumors described in (g), and DAPI staining. Percentage of Ki67 positive SCC13 cells, 4 fields/tumor, n(tumors/SCR) = 2, n(tumors/LNA) = 3, mean ± SEM, P < 0.01, P < 0.001, one-way ANOVA. i TP63 (magenta) and KRT10 (green) immunostaining of tumors described in (g). Low and high magnification representative images and quantification of TP63-positive cells and KRT10 area (%), normalized to the number of cells, 4 fields/tumor, n(tumors/SCR) = 2, n(tumors/LNA) = 3, mean ± SEM, P < 0.0001, one-way ANOVA. Scale bar 30 µm.

References

    1. Thompson AK, Kelley BF, Prokop LJ, Murad MH, Baum CL. Risk factors for cutaneous squamous cell carcinoma recurrence, metastasis, and disease-specific death: a systematic review and meta-analysis. JAMA Dermatol. 2016;152:419–428. doi: 10.1001/jamadermatol.2015.4994. - DOI - PMC - PubMed
    1. Campbell JD, et al. Genomic, pathway network, and immunologic features distinguishing squamous carcinomas. Cell Rep. 2018;23:194–212.e196. doi: 10.1016/j.celrep.2018.03.063. - DOI - PMC - PubMed
    1. Dotto GP, Rustgi AK. Squamous cell cancers: a unified perspective on biology and genetics. Cancer Cell. 2016;29:622–637. doi: 10.1016/j.ccell.2016.04.004. - DOI - PMC - PubMed
    1. Dotto GP. Crosstalk of Notch with p53 and p63 in cancer growth control. Nat. Rev. Cancer. 2009;9:587–595. doi: 10.1038/nrc2675. - DOI - PMC - PubMed
    1. Nguyen BC, et al. Cross-regulation between Notch and p63 in keratinocyte commitment to differentiation. Genes Dev. 2006;20:1028–1042. doi: 10.1101/gad.1406006. - DOI - PMC - PubMed

Publication types

MeSH terms