. 2023 Feb 16;14(1):872.
doi: 10.1038/s41467-023-36522-z.

Oxidized mitochondrial DNA induces gasdermin D oligomerization in systemic lupus erythematosus

Affiliations

Oxidized mitochondrial DNA induces gasdermin D oligomerization in systemic lupus erythematosus

Naijun Miao et al. Nat Commun. .

Abstract

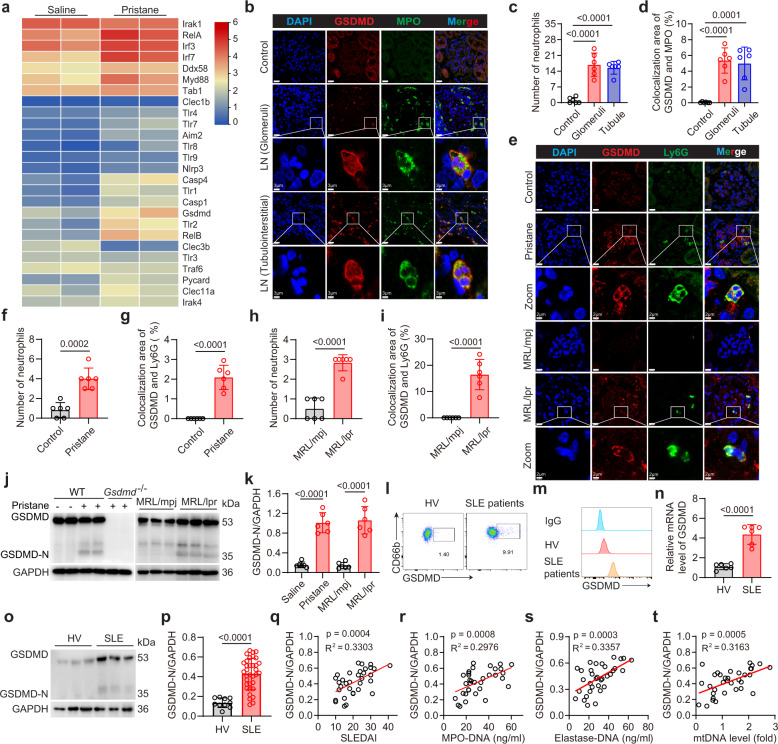
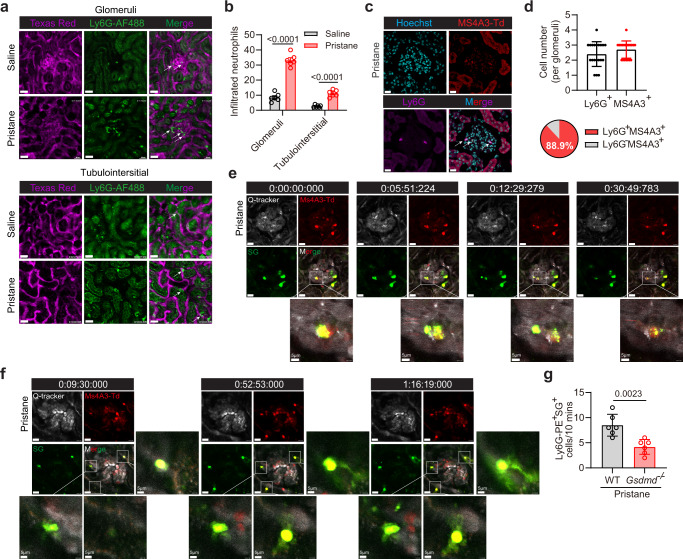
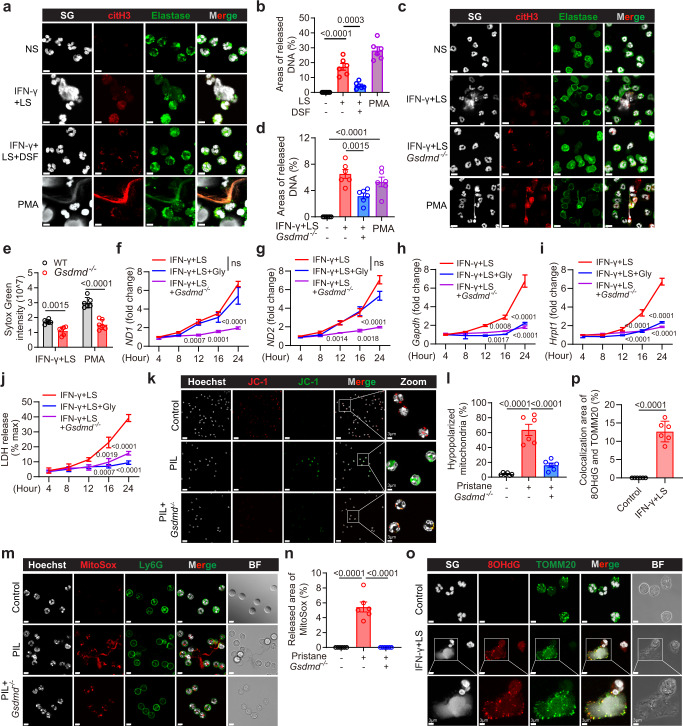
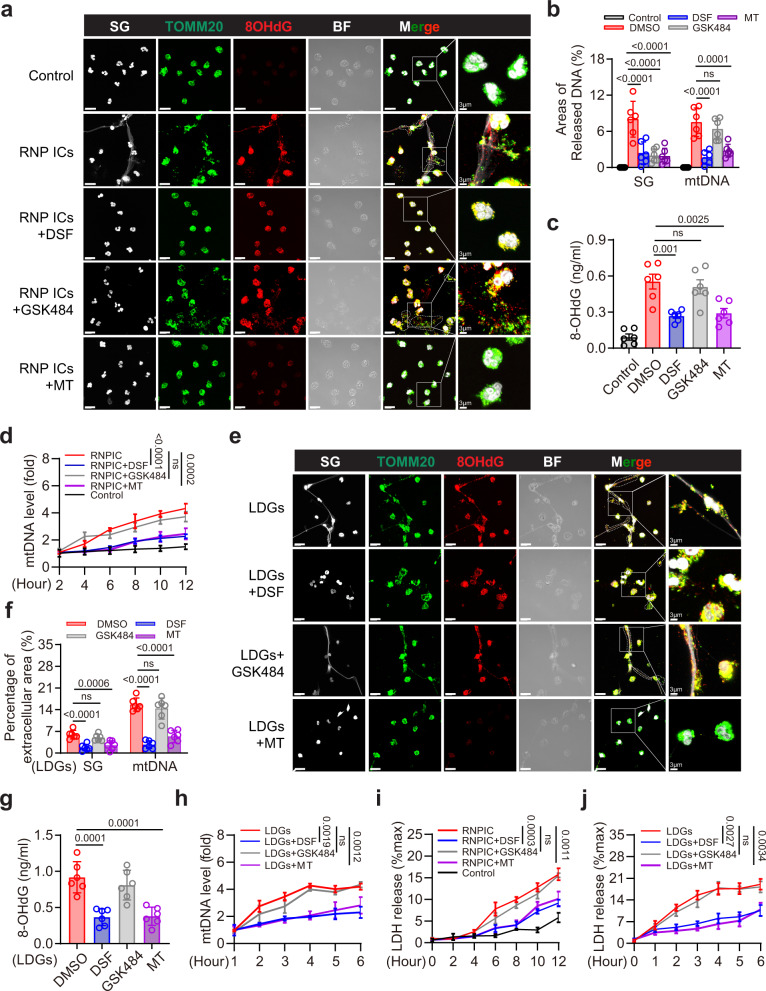
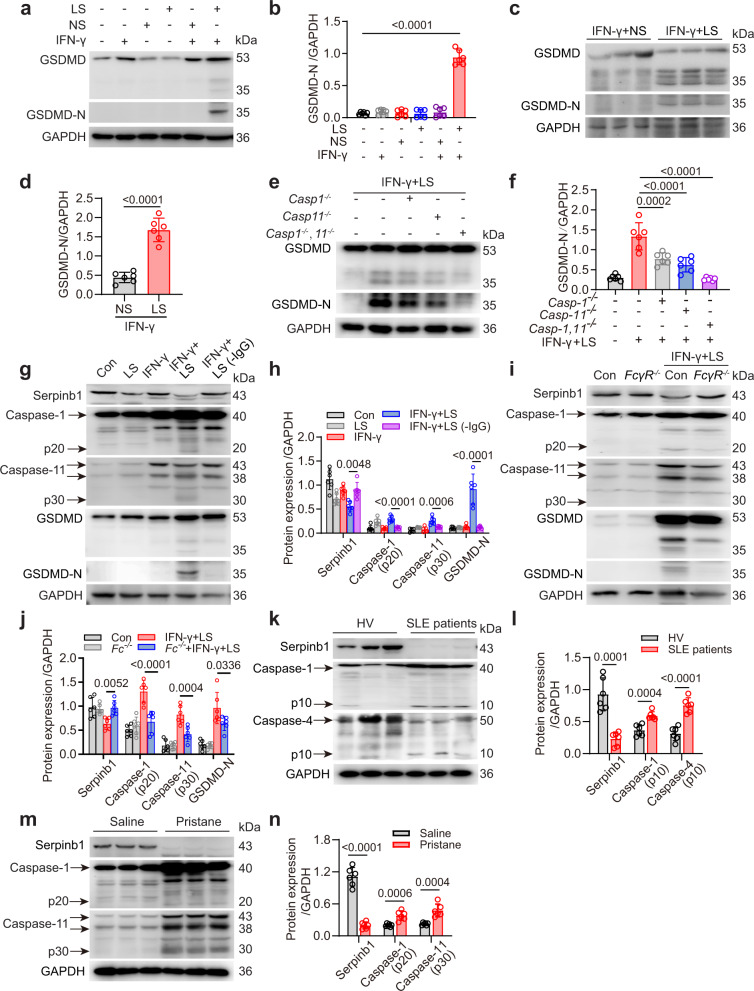
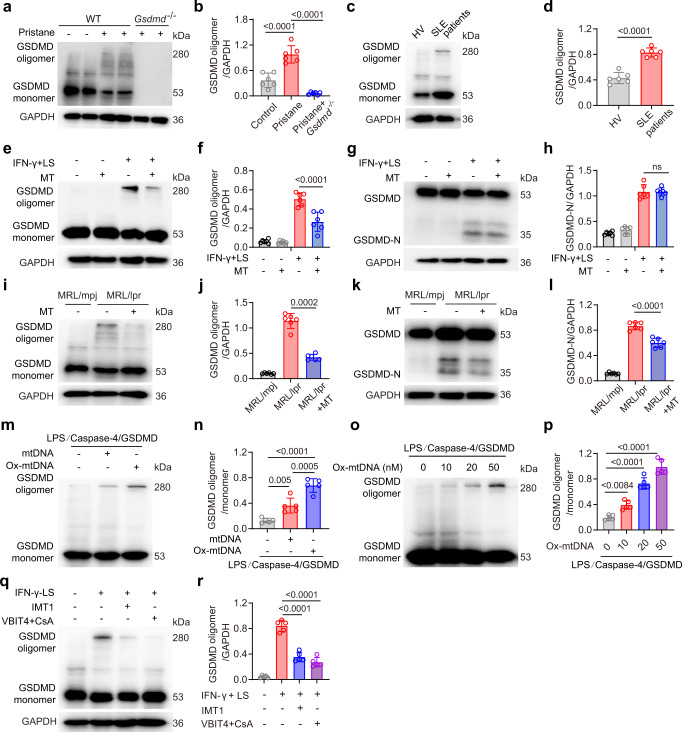
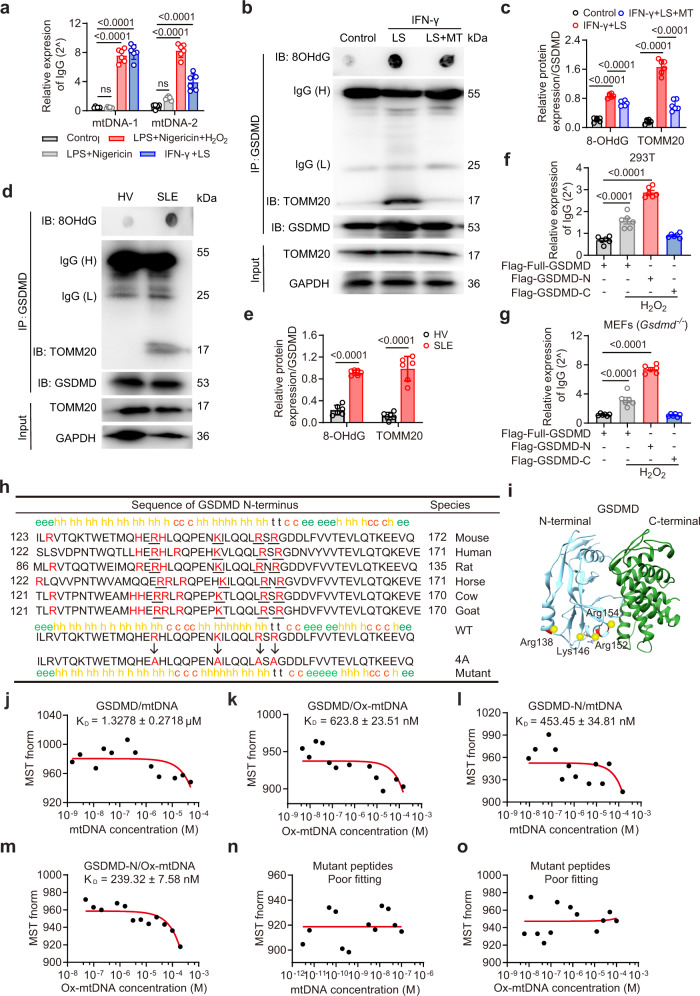
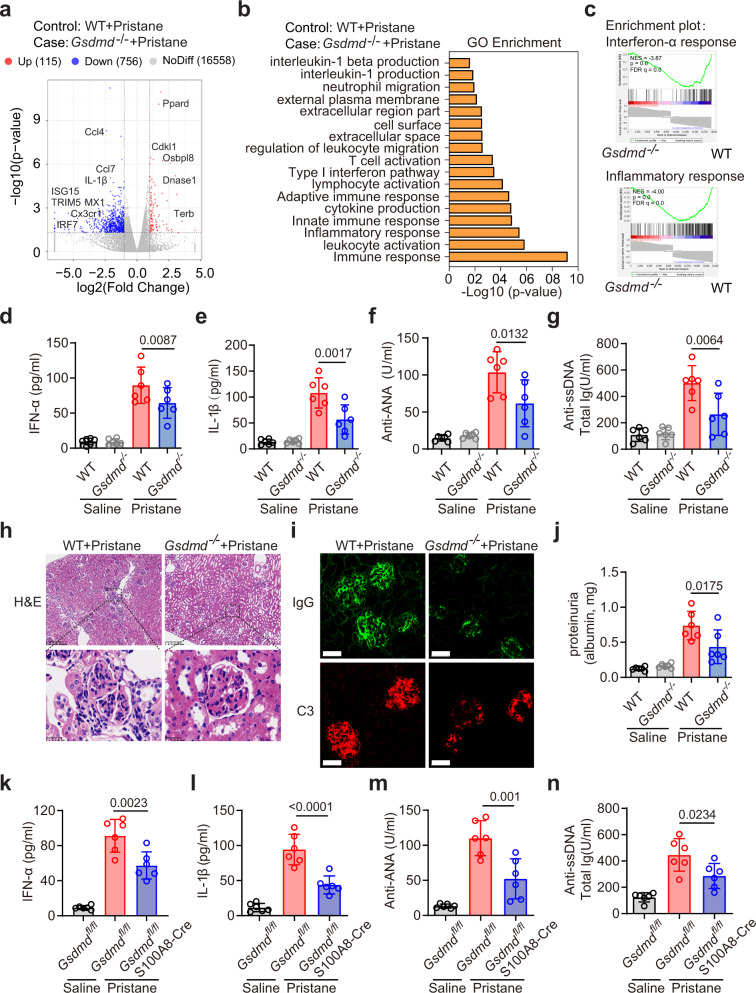
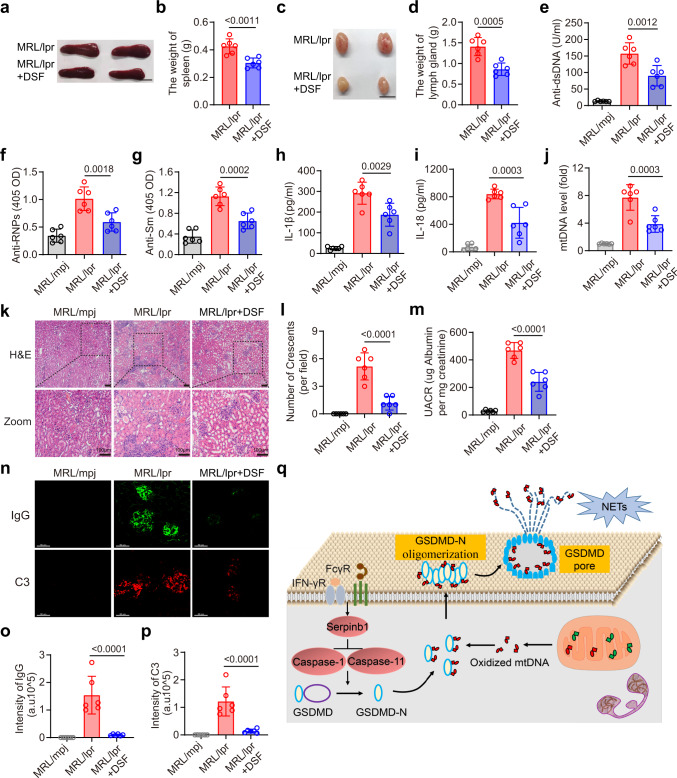
Although extracellular DNA is known to form immune complexes (ICs) with autoantibodies in systemic lupus erythematosus (SLE), the mechanisms leading to the release of DNA from cells remain poorly characterized. Here, we show that the pore-forming protein, gasdermin D (GSDMD), is required for nuclear DNA and mitochondrial DNA (mtDNA) release from neutrophils and lytic cell death following ex vivo stimulation with serum from patients with SLE and IFN-γ. Mechanistically, the activation of FcγR downregulated Serpinb1 following ex vivo stimulation with serum from patients with SLE, leading to spontaneous activation of both caspase-1/caspase-11 and cleavage of GSDMD into GSDMD-N. Furthermore, mtDNA oxidization promoted GSDMD-N oligomerization and cell death. In addition, GSDMD, but not peptidyl arginine deiminase 4 is necessary for extracellular mtDNA release from low-density granulocytes from SLE patients or healthy human neutrophils following incubation with ICs. Using the pristane-induced lupus model, we show that disease severity is significantly reduced in mice with neutrophil-specific Gsdmd deficiency or following treatment with the GSDMD inhibitor, disulfiram. Altogether, our study highlights an important role for oxidized mtDNA in inducing GSDMD oligomerization and pore formation. These findings also suggest that GSDMD might represent a possible therapeutic target in SLE.


Conflict of interest statement

The authors declare no competing interests.

Figures

Fig. 1
Fig. 1. GSDMD is activated in neutrophils from lupus mice and SLE patients.
a Heatmap of genes involved in DAMP sensing pathways that are differentially expressed between the kidneys of mice treated with saline and pristane. b Immunofluorescence staining for GSDMD and MPO in glomeruli and tubulointerstitial of renal biopsy from lupus nephritis (LN) patients. Scale bar, 20 μm, 3 μm (enlarged). c, d Quantitative analysis of numbers of neutrophils per field of view (FOV) or co-localization area of GSDMD and MPO in FOV. Tumor-adjacent normal tissue samples of 3 renal carcinoma patients or renal biopsies from 3 LN patients. The results are pooled from two independent experiments. e Immunofluorescence staining for GSDMD and Ly6G in kidney from PIL and MRL/lpr mice. Scale bar, 10 μm. 2 μm (enlarged). fi Numbers of neutrophils or co-localization area of GSDMD and Ly6G per FOV. n = 6 mice. j Immunoblotting of GSDMD and GSDMD-N in bone marrow (BM) neutrophils from wide-type (WT), PIL, pristane-treated Gsdmd/, MRL/mpj and MRL/lpr mice. k Quantitative analysis of GSDMD-N/GAPDH. n = 6 mice. The samples shown are from the same experiment. Three blots (PIL group) and two blots (MRL/lpr group) were processed in parallel. l Flow cytometry plots for GSDMD in peripheral blood neutrophils from HV and SLE patients. m Fluorescence intensity of GSDMD from the isotype, HV and SLE groups. n mRNA levels of GSDMD in HV and SLE patients. n = 6 HVs or SLE patients. o Immunoblotting for GSDMD and GSDMD-N protein in peripheral blood neutrophils from HV and SLE patients. p Quantitative analysis of GSDMD-N/GAPDH. n = 10 HVs and n = 34 SLE patients. The samples shown are from the same experiment. Three blots were processed in parallel. Correlation of relative expression of GSDMD-N (the ratio of GSDMD-N to GAPDH from immunoblotting analysis) on neutrophils from SLE patients with SLEDAI (q), MPO-DNA complexes (r) elastase-DNA complexes (s) and mtDNA levels (t) in serum. Data are representative of two (b) or three (a, e, l, m, n) independent experiments. Data are presented as mean ± SD. Significance was examined by unpaired two-sided Student’s t test (fi, k, n, p) or one-way ANOVA (c, d). Spearman’s nonparametric test for (qt).
Fig. 2
Fig. 2. Intravital renal microscopy reveals neutrophil cell death in live lupus mice.
a Two photon intravital imaging analysis of infiltrated neutrophils (Ly6G-AF488) in renal blood vessels (Texas Red) of live mice (glomeruli and tubulointerstitial) after saline or pristane treatment. Scale bar, 30 μm. b Quantitative analysis of infiltrated neutrophils in glomeruli and tubulointerstitial of mice after saline or pristane treatment. n = 6 mice. c Immunofluorescence staining of Ly6G in glomeruli from Ms4a3-tdTomato (Ms4a3-Td) mice after pristane treatment. Scale bar, 30 μm. d Quantitative analysis of Ly6G+ and Ms4a3-tdTomato+ cell numbers in each glomerulus and percentage of Ms4a3-tdTomato+ Cells. Representative of three independent experiments, and each point represents one glomerulus with the mean being represented by a horizontal line. e, f Intravital imaging of the kidneys from pristane-treated Ms4a3-Td mice revealing the release of DNA (Sytox Green, green) from tdTomato+ cells (Red). Time-lapse images are shown of DNA that was released in the form of punctate particles (e) or mesh-like structures (f). Scale bar, 20 μm. 5 μm (enlarged). Representative of two independent experiments. g Quantitative analysis of PE-Ly6G+SG+ cells/10 min in kidney of PIL and Gsdmd/ mice by intravital imaging. n = 6 mice. Representative of three independent experiments. Data are presented as mean ± SD. Significance was examined with unpaired two-sided Student’s t test (b, d, g).
Fig. 3
Fig. 3. GSDMD is required for the release of NET-associated DNA and mtDNA following lupus serum treatment.
a Immunofluorescence staining of citH3, elastase, and Sytox Green (SG). Cells were treated with normal serum (NS) from HV, LS from SLE patients plus IFN-γ, pretreated with DSF, or PMA. Scale bar, 5 µm. b Quantitative analysis of areas of released DNA in (a). Symbols represent the percentage of extracellular DNA area as compared to the entire FOV. Two healthy donors were used in one experiment, plots were pooled from three independent experiments using cells from 6 healthy donors. c Immunofluorescence staining of SG, citH3 and Ly6G. scale bar, 15 µm. d Quantitative analysis of areas of released DNA in (c). Symbols represent the area percentage of extracellular DNA relative to the entire FOV. e Quantitative analysis of SG intensity in the supernatant collected from WT and Gsdmd/ BM neutrophils following stimulation with LS plus IFN-γ or PMA. qPCR analysis of mitochondrial-encoded gene ND1 (f) and ND2 (g), nuclear-encoded gene, Gapdh (h) and Hrpt1 (i) in the supernatant. n = 3 mice. j Quantification of LDH in the supernatant from the indicated treatment groups. n = 3 mice. k Immunofluorescence staining of JC-1 in neutrophils from WT, PIL mice, and Gsdmd/ mice after pristane treatment. Scale bar, 20 µm. 3 μm (enlarged). l Quantification of hypopolarized mitochondria in (k). n = 6 mice. m Immunofluorescence staining of MitoSox and Ly6G from WT, PIL mice, and Gsdmd/ mice after pristane treatment. Scale bar, 5 µm. n Quantitative analysis of areas of released MitoSox in (m). n = 6 mice. o Immunofluorescence staining of SG, 8OHdG, and TOMM20 in neutrophils stimulated with LS + IFN-γ for 8 h; scale bar, 5 µm. 3 μm (enlarged). p Quantification of co-localization area of 8OHdG and TOMM20 in o. The results are pooled from two independent experiments using cells from 6 mice (d, e, p). Three independent experiments (fj, kn). Data are shown as mean ± SD. Significance was examined by one-way ANOVA (b, d, l, n), unpaired two-sided Student’s t test (ej, p).
Fig. 4
Fig. 4. RNP ICs-induced release of extracellular mtDNA is significantly suppressed by mROS and GSDMD inhibition.
a Immunofluorescence staining of SG, TOMM20 and 8OHdG in peripheral blood neutrophils from HV after RNP ICs treatment. Cells were pretreated with DSF (5 µM), GSK484 (10 µM), or Mito-TEMPO (10 µM) for 2 h, followed by stimulation for 12 h with RNP ICs. BF: bright field; scale bar, 15 µm. 3 μm (enlarged). b Quantitative analysis of areas of extracellular SG and mtDNA in (a). Areas of released mtDNA including regions of extracellular TOMM20/8OHdG positive staining. c Quantification of 8OHdG content in culture medium after the indicated treatment. d Quantitative analysis of mtDNA into the supernatant from the indicated treatment groups at the indicated time points by qPCR. n = 3 HVs. e Immunofluorescence staining of SG, TOMM20 and 8OHdG in LDGs after 6 h. LDGs were pretreated with DSF (5 µM), GSK484 (10 µM) or Mito-TEMPO (10 µM). Scale bar, 15 µm. 3 μm (enlarged). f Quantitative analysis of areas of extracellular SG and mtDNA in (e). g Quantification of 8OHdG content in cultured medium of LDGs. h Quantification of the released mtDNA in LDGs at the indicated time points. n = 3 SLE patients. i, j Quantification of the release of LDH into the supernatant from the indicated groups at the indicated time points by ELISA. n = 3 HVs (i) and 3 SLE patients (j). The results are pooled from three independent experiments using cells from 6 HVs (b, c). Two SLE patients were used in one experiment, and plots were pooled from three independent experiments using cells from 6 SLE patients (f, g). Representative of three independent experiments (a, d, e, h, i, j). Data are presented as mean ± SD. Significance was examined by one-way AVOVA (b, c, f, g) or unpaired two-sided Student’s t test (d, h, i, j).
Fig. 5
Fig. 5. Immune complexes mediate the activation of caspase-1 and caspase-11 by downregulating Serpinb1.
a Immunoblotting of GSDMD and GSDMD-N in BM neutrophils after treatment with IFN-γ, NS from WT mice, LS from lupus mice, or IFN-γ + LS for 12 h. b Quantitative analysis of GSDMD-N/GAPDH. c Immunoblotting of GSDMD and GSDMD-N in peripheral blood neutrophils of HV. Cells were pretreated with IFN-γ. Then the cells were added with NS form HV or LS from SLE patients for 12 h. d Quantitative analysis of GSDMD-N/GAPDH levels. e Immunoblotting for GSDMD and GSDMD-N in BM neutrophils from Caspase-1/, Caspase-11/ and Caspase-1/Caspase-11/ mice treated with IFN-γ + LS. f Quantitative analysis of GSDMD-N/GAPDH levels. g Immunoblotting of Serpinb1, Caspase-1, Caspase-11, and GSDMD levels in BM neutrophils treated with IFN-γ + LS, or IgG deleted LS for 12 h. h Quantitative analysis of Serpinb1, Caspase-1, Caspase-11, and GSDMD-N levels. i Immunoblotting analysis of Serpinb1, Caspase-1, Caspase-11, and GSDMD levels in WT or FcγR/ BM neutrophils after IFN-γ + LS treatment for 12 h. j Quantitative analysis of Serpinb1, Caspase-1, and Caspase-11 levels. k Immunoblotting analysis of Serpinb1, Caspase-1, and Caspase-4 levels in neutrophils isolated from the peripheral blood of HV and SLE patients. l Quantitative analysis of Serpinb1, Caspase-1, and Caspase-4 levels. m Immunoblotting analysis of Serpinb1, Caspase-1, and Caspase-11 levels in the BM neutrophils from saline or PIL mice. n Quantitative analysis of Serpinb1, Caspase-1, and Caspase-11 levels. n = 6 mice (b, f, h, j, n) or 6 donors (d, l). The immunoblotting samples shown are from the same experiment. Two blots were processed in parallel (d, l, n). Three blots were processed in parallel (b, f, h, j). Data are shown as mean ± SD. Significance was examined by one-way ANOVA (b, f, h, j), or unpaired two-sided Student’s t test (d, l, n).
Fig. 6
Fig. 6. Oxidized mtDNA promotes GSDMD oligomerization.
a Non-reducing immunoblotting of GSDMD oligomer in BM neutrophils isolated from WT, PIL mice and Gsdmd/ mice after pristane treatment. b Quantitative analysis of GSDMD oligomer/GAPDH. c Non-reducing immunoblotting of GSDMD in neutrophils from HV and SLE patients. d Quantitative analysis of GSDMD oligomer/GAPDH. n = 6 HVs or 6 SLE patients. e Non-reducing immunoblotting of GSDMD oligomer in murine BM neutrophils. Cells were treated with IFN-γ plus LS, or pretreated with Mito-TEMPO. f Quantitative analysis of GSDMD oligomer/GAPDH. g Immunoblotting of GSDMD in murine BM neutrophils. Cells were treated with IFN-γ plus LS, or pretreated with Mito-TEMPO. h Quantitative analysis of GSDMD-N/GAPDH. i Non-reducing immunoblotting of GSDMD oligomer in BM neutrophils isolated from MRL/mpj, MRL/lpr or MRL/lpr after Mito-TEMPO treatment. j Quantitative analysis of GSDMD oligomer/GAPDH. k Immunoblotting of GSDMD in BM neutrophils isolated from MRL/mpj, MRL/lpr and MRL/lpr after Mito-TEMPO treatment. l Quantitative analysis of GSDMD-N/GAPDH. m Non-reducing immunoblotting of GSDMD oligomer. Purified GSDMD protein was incubated with purified caspase-4 protein and LPS in vitro, then added with human mtDNA or Ox-mtDNA (20 nM). n Quantitative analysis of GSDMD oligomer/GSDMD monomer. o Non-reducing immunoblotting of GSDMD oligomer. The LPS/caspase-4/GSDMD system was added with Ox-mtDNA at 0, 10, 20 and 50 nM. p Quantitative analysis of GSDMD oligomer/GSDMD monomer. q Non-reducing immunoblotting of GSDMD oligomer. Murine BM neutrophils were pretreated with IMT1 or CsA plus VBTI4 and then treated with IFN-γ plus LS. r Quantitative analysis of GSDMD oligomer/GAPDH. n = 5 (r) or 6 mice (b, d, f, h, j, l). Plots were pooled from five independent experiments (n, p). The immunoblotting samples shown are from the same experiment. Three blots were processed in parallel (b, d, f, h, j, i, r). Data are presented as mean ± SD. Significance was examined with one-way ANOVA (b, f, h, j, l, n, p, r) or unpaired two-sided Student’s t test (d).
Fig. 7
Fig. 7. MtDNA directly interacts with GSDMD-N.
a qPCR analysis of mtDNA following GSDMD pulldown under the indicated treatment. BM neutrophils were treated with LPS + Nigericin + H2O2, LPS + Nigericin, or IFN-γ + LS. n = 6 mice. b Immunoblotting of TOMM20 and GSDMD. BM neutrophils were treated with IFN-γ + LS for 12 h, or pretreated with Mito-TEMPO. Lysates were co-immunoprecipitated with anti-GSDMD, and co-immunoprecipitates were then spotted on a nitrocellulose membrane, UV crosslinked, and probed with antibodies specific for 8OHdG, or were separated via SDS-PAGE for GSDMD and TOMM20. c Quantitative analysis of 8OHdG and TOMM20. n = 5 mice. The samples shown are from the same experiment. Three blots were processed in parallel. d Immunoblotting of TOMM20 and 8OHdG in peripheral blood neutrophils from HV or SLE patients (n = 6). e Quantitative analysis of 8OHdG and TOMM20. The samples shown are from the same experiment. Three blots were processed in parallel. Relative mtDNA enrichment was assessed via qPCR in indicated cells. 293T (f) and Gsdmd/ MEF cells (g) were transfected with Flag-full-GSDMD, Flag-GSDMD-N or GSDMD-C, then treated with H2O2 (100 μM) for 4 h. n = 6 samples pooled from 6 independent experiments. h The cluster of four evolutionarily conserved, positively charged amino acids (red and underlined) in GSDMD-N were mutated to Ala. i X-ray crystal structure of the murine GSDMD (PDB: 6N9N). Dissociation constants (KD) of human GSDMD with human mtDNA (j) and Ox-mtDNA (k). KD of peptides from GSDMD-N with human mtDNA (l) and Ox-mtDNA (m). n, o Measurements of KD of mutant peptides from GSDMD-N with mtDNA (n) and Ox-mtDNA (o). The KD was derived from the binding response as a function of the His-tagged GSDMD or His-tagged peptides. Errors in KD represent fitting errors. Representative of three independent experiments (b, d, jo). Data are presented as means ± SD. Significance was examined with one-way ANOVA (a, c, f, g) or unpaired two-sided Student’s t test (e).
Fig. 8
Fig. 8. GSDMD deficiency significantly reduced disease activity in PIL mice.
a Volcano plots were prepared demonstrating the distributions of P-values [−log10 (P value)] and fold change values [log2 (fold change)]. Down- and upregulated genes are shown in blue and red respectively. b Differential gene expression in kidneys from PIL mice relative to pristane-treated Gsdmd/ mice. GO enrichment analysis demonstrating the biological processes most significantly enriched in the kidneys of WT and Gsdmd/ mice following pristane treatment. c GSEA approaches identifying genes associated with IFN-α response and inflammatory response between WT and Gsdmd/ mice following pristane treatment. ELISA analysis of serum IFN-α (d), IL-1β (e), anti-ANA (f) and anti-ssDNA (g) levels from the indicated groups. h H&E staining of glomeruli from WT and Gsdmd/ mice following pristane treatment. Scale bar, 200 μm, 25 μm (enlarged). i Immunofluorescence of IgG (green) and complement C3 (red) in kidney section from WT and Gsdmd/ mice after pristane treatment. Scale bar, 25 μm. j ELISA analysis of urine albumin levels in WT and Gsdmd/ mice after pristane treatment. ELISA analysis of IFN-α (k), IL-1β (l), anti-ANA (m) and anti-ssDNA (n) antibodies in serum from Gsdmdfl/fl or Gsdmdfl/flS100A8-Cre mice after pristane treatment for 7 months. NES normalized enrichment score, FDR false discovery rate. n = 6 mice (dg, jn) and data are representative of 2 independent experiments (dn). Data are shown as means ± SD. Significance was examined with one-way ANOVA (dg, jn).
Fig. 9
Fig. 9. GSDMD inhibition alleviates disease activity in MRL/lpr mice.
a Images of spleen from MRL/lpr mice or MRL/lpr with DSF treatment. Scale bar, 1 cm. b Quantitative analysis of spleen weight. c Images of lymph gland from MRL/lpr mice or MRL/lpr with DSF treatment. Scale bar, 1 cm. d Quantitative analysis of the weight of lymph gland (4 lymph glands). ELISA analysis of the levels of anti-dsDNA (e), anti-RNPs (f), anti-Sm (g), IL-1β (h) and IL-18 (i) in serum samples from the indicated groups. j qPCR analysis of D-loop in serum from indicated groups. k H&E staining of kidney section from indicated groups; scale bar = 100 μm. l Quantitative analysis of numbers of glomerular crescents from indicated groups. m ELISA of urine albumin-to-creatine ratio in MRL/mpj, MRL/lpr, and MRL/lpr mice treated with DSF. n Renal section from the indicated treatment groups were stained with or IgG (green) and C3 (red). Scale bar, 50 μm. o, p Quantitative analysis of the intensity of IgG and C3 per FOV. q Working model. ICs and IFN-γ in the serum of SLE patients promote the activation of GSDMD through serpinb1/caspase-1/11 pathway. Moreover, ICs also promote mitochondrial stress, which facilitates the release of Ox-mtDNA into the cytosol. Cytosolic Ox-mtDNA directly binds with GSDMD-N to promote GSDMD-N oligomerization and GSDMD pore formation. The subsequent extracellular NETs and mtDNA promote SLE pathogenesis. n = 6 mice, 2 independent experiments (b, dj, l, m, o, p). Data are shown as means ± SD. Significance was examined with unpaired two-sided Student’s t test (b, d) one-way ANOVA (ej, l, m, o, p).

Similar articles

Cited by

References

    1. Arbuckle MR, et al. Development of autoantibodies before the clinical onset of systemic lupus erythematosus. N. Engl. J. Med. 2003;349:1526–1533. doi: 10.1056/NEJMoa021933. - DOI - PubMed
    1. Elkon KB, Wiedeman A. Type I IFN system in the development and manifestations of SLE. Curr. Opin. Rheumatol. 2012;24:499–505. doi: 10.1097/BOR.0b013e3283562c3e. - DOI - PubMed
    1. Burgener SS, et al. Cathepsin G inhibition by Serpinb1 and Serpinb6 prevents programmed necrosis in neutrophils and monocytes and reduces GSDMD-driven inflammation. Cell Rep. 2019;27:3646–3656.e3645. doi: 10.1016/j.celrep.2019.05.065. - DOI - PMC - PubMed
    1. Mistry P, Kaplan MJ. Cell death in the pathogenesis of systemic lupus erythematosus and lupus nephritis. Clin. Immunol. 2017;185:59–73. doi: 10.1016/j.clim.2016.08.010. - DOI - PMC - PubMed
    1. Fenton K. The effect of cell death in the initiation of lupus nephritis. Clin. Exp. Immunol. 2015;179:11–16. doi: 10.1111/cei.12417. - DOI - PMC - PubMed

Publication types