. 2023 Feb 16;14(1):896.
doi: 10.1038/s41467-023-36491-3.

Genome-wide genotype-serum proteome mapping provides insights into the cross-ancestry differences in cardiometabolic disease susceptibility

Affiliations

Genome-wide genotype-serum proteome mapping provides insights into the cross-ancestry differences in cardiometabolic disease susceptibility

Fengzhe Xu et al. Nat Commun. .

Abstract

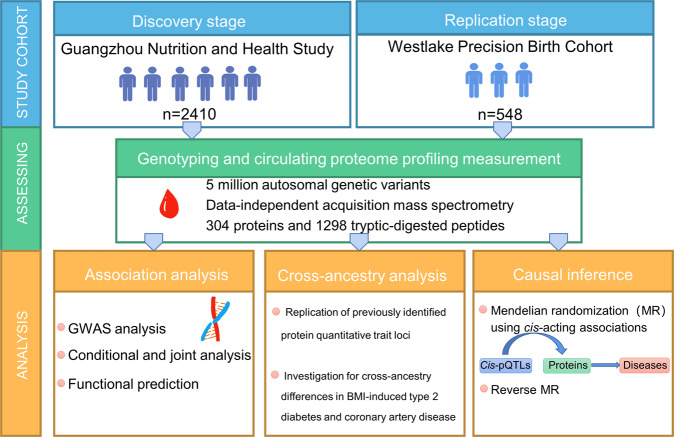
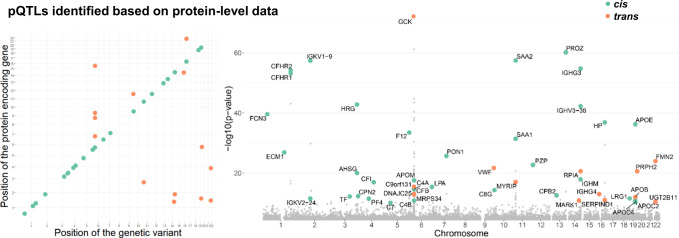
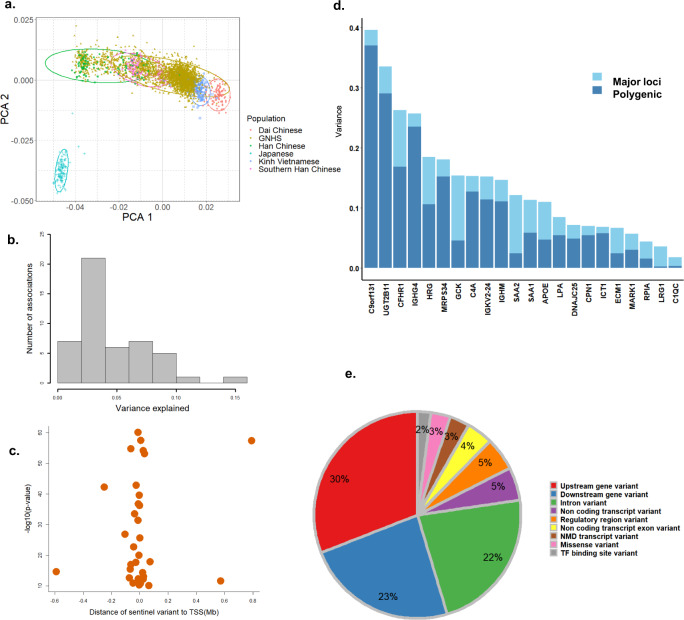
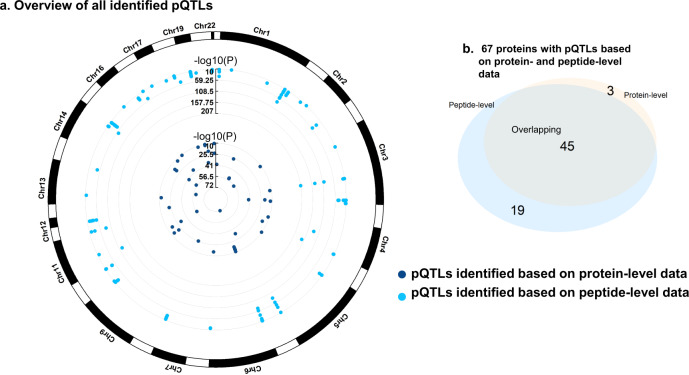
Identification of protein quantitative trait loci (pQTL) helps understand the underlying mechanisms of diseases and discover promising targets for pharmacological intervention. For most important class of drug targets, genetic evidence needs to be generalizable to diverse populations. Given that the majority of the previous studies were conducted in European ancestry populations, little is known about the protein-associated genetic variants in East Asians. Based on data-independent acquisition mass spectrometry technique, we conduct genome-wide association analyses for 304 unique proteins in 2,958 Han Chinese participants. We identify 195 genetic variant-protein associations. Colocalization and Mendelian randomization analyses highlight 60 gene-protein-phenotype associations, 45 of which (75%) have not been prioritized in Europeans previously. Further cross-ancestry analyses uncover key proteins that contributed to the differences in the obesity-induced diabetes and coronary artery disease susceptibility. These findings provide novel druggable proteins as well as a unique resource for the trans-ancestry evaluation of protein-targeted drug discovery.


Conflict of interest statement

The authors declare no competing interests.

Figures

Fig. 1
Fig. 1. Overview of the study design.
Using data-independent acquisition mass spectrometry, we measured serum proteome in up to 2410 Han Chinese participants with replication in 548 Han Chinese women. A total of 1298 tryptic-digested peptides and 304 proteins were included in the analysis. We used the colocalization of cis-pQTLs with the clinically relevant phenotypes, as well as the Mendelian randomization approach, to investigate the putative effects of the circulating proteins on complex traits/diseases. pQTL protein quantitative trait loci.
Fig. 2
Fig. 2. Gene–protein associations based on protein-level data.
The left plots show the position of genetic variants against the position of the coding gene. The Manhattan plots (right) show the sentinel pQTLs and associated proteins. The green dots represent cis-pQTLs, while the red dots represent trans-pQTLs. pQTLs, protein quantitative trait loci. The genome-wide significant associations that should have (i) meta-analysis P < 5 × 10−8/304; (ii) P < 0.05 in four sub-cohorts; (iii) consistent direction of effect across the sub-cohorts. pQTLs protein quantitative trait loci.
Fig. 3
Fig. 3. Characteristics of sentinel pQTLs.
a Genetic principal component of the GNHS study compared to the 505 East Asian participants from the 1000 Genomes Project Phase3. b Distribution of explained variance that the genetic variant contributed to the corresponding protein. c The distance of lead variant to the transcript start site. d Heritability of circulating proteins. The variance explained by the lead SNPs is shown in light blue, with the variance explained by the polygenic background shown in dark blue. e The proportion of predicted functional annotation classes of the identified genetic variants. GNHS Guangzhou Nutrition and Health Study, PCA principal component analysis, TSS transcript start site, pQTLs protein quantitative trait loci.
Fig. 4
Fig. 4. Genomic atlas of all identified pQTLs.
a Overview of all identified proteins excluding the participants with missing data in each protein or peptide. Each dot represents a protein/peptide-associated genetic variant. The genome-wide significant associations that should have (i) meta-analysis P < 5 × 10−8/n, where n is the number of proteins/peptides; (ii) P < 0.05 in four sub-cohorts; (iii) consistent direction of effect across the sub-cohorts. b Number of proteins identified by protein- or peptide-level data. We found 67 proteins with pQTLs in Han Chinese, three of which were based on protein-level data and 19 on peptide-level data. pQTLs protein quantitative trait loci.
Fig. 5
Fig. 5. Associations between proteins and clinically relevant phenotypes.
a Colocalization of cis-pQTLs and the clinical traits. The squares represent the estimated effect size from the summary-data-based Mendelian randomization analysis, and the lines represent the 95% confidence intervals. b Effect sizes from disease GWAS studies against those from pQTL summary statistics. The orange dashed lines show the estimate at the top cis-pQTL. The error bars represent the standard errors of SNP effects. c Putative causal relationships between serum proteins and clinically relevant phenotypes. The clinical traits were obtained from GWAS summary statistics of BioBank Japan. The green represents proteins with cis-instruments, while the red represents proteins with trans-instruments. Praw < 0.05; *PBonferroni < 0.05. GWAS genome-wide association analysis, SMR summary-data-based Mendelian Randomization, CAD coronary artery disease.
Fig. 6
Fig. 6. Network representation of potential gene–protein–phenotype associations.
a Associations between proteins and diseases, as well as clinically relevant traits found by Mendelian randomization analysis and colocalization analysis (P < 0.05 after Bonferroni correction). The solid line represents the gene–phenotype connections that have yet to be prioritized in Europeans, whereas the dashed lines represent those that have already been reported. The color of the line denotes the effect directions (orange, positive associations; green, negative associations). Proteins are represented by the gray dots, whereas diseases and traits are represented by the blue and red dots, respectively. b An example from the gene–protein–phenotype map. Higher hexokinase-4 (GCK) levels are associated with a lower rheumatic arthritis risk. The plot shows the consistent effect of GCK on rheumatic arthritis across two populations. The effect sizes are present as the odds ratio per higher RINT(GCK). EAS East Asian, EUR European, RINT rank-based inverse normal transformation.
Fig. 7
Fig. 7. Putative mechanism for difference in BMI-induced type 2 diabetes and coronary artery disease susceptibility between Europeans and East Asians.
The analysis comprised 41 proteins with pQTLs in two populations. a Shared genetic architecture among two populations. EAS, East Asian; EUR, European. b Effect of BMI on cardiometabolic disease risk. The effect sizes are present as odds ratios per 1 kg/m2 increase in BMI. The dots represent the estimated effect size, and the lines represent the 95% confidence intervals. c Overview of obesity-related protein patterns. The circular heatmap exhibits the effects of proteins on risk of CAD and T2D and indirect effect of the BMI on CAD and T2D via each protein. All statistical tests were two-sided. Praw < 0.05; *PBonferroni < 0.05. d Hypothetical mechanism for susceptibility differences in cardiometabolic diseases between Europeans and East Asians.

References

    1. Suhre K, McCarthy MI, Schwenk JM. Genetics meets proteomics: perspectives for large population-based studies. Nat. Rev. Genet. 2021;22:19–37. doi: 10.1038/s41576-020-0268-2. - DOI - PubMed
    1. Benson MD, et al. Genetic architecture of the cardiovascular risk proteome. Circulation. 2018;137:1158–1172. doi: 10.1161/CIRCULATIONAHA.117.029536. - DOI - PMC - PubMed
    1. Emilsson V, et al. Co-regulatory networks of human serum proteins link genetics to disease. Science. 2018;361:769–773. doi: 10.1126/science.aaq1327. - DOI - PMC - PubMed
    1. Folkersen L, et al. Mapping of 79 loci for 83 plasma protein biomarkers in cardiovascular disease. PLoS Genet. 2017;13:e1006706. doi: 10.1371/journal.pgen.1006706. - DOI - PMC - PubMed
    1. Folkersen L, et al. Genomic and drug target evaluation of 90 cardiovascular proteins in 30,931 individuals. Nat. Metab. 2020;2:1135–1148. doi: 10.1038/s42255-020-00287-2. - DOI - PMC - PubMed

Publication types