. 2023 Feb 16;14(1):871.
doi: 10.1038/s41467-023-36629-3.

A trans-kingdom T6SS effector induces the fragmentation of the mitochondrial network and activates innate immune receptor NLRX1 to promote infection

Affiliations

A trans-kingdom T6SS effector induces the fragmentation of the mitochondrial network and activates innate immune receptor NLRX1 to promote infection

Joana Sá-Pessoa et al. Nat Commun. .

Abstract

Bacteria can inhibit the growth of other bacteria by injecting effectors using a type VI secretion system (T6SS). T6SS effectors can also be injected into eukaryotic cells to facilitate bacterial survival, often by targeting the cytoskeleton. Here, we show that the trans-kingdom antimicrobial T6SS effector VgrG4 from Klebsiella pneumoniae triggers the fragmentation of the mitochondrial network. VgrG4 colocalizes with the endoplasmic reticulum (ER) protein mitofusin 2. VgrG4 induces the transfer of Ca2+ from the ER to the mitochondria, activating Drp1 (a regulator of mitochondrial fission) thus leading to mitochondrial network fragmentation. Ca2+ elevation also induces the activation of the innate immunity receptor NLRX1 to produce reactive oxygen species (ROS). NLRX1-induced ROS limits NF-κB activation by modulating the degradation of the NF-κB inhibitor IκBα. The degradation of IκBα is triggered by the ubiquitin ligase SCFβ-TrCP, which requires the modification of the cullin-1 subunit by NEDD8. VgrG4 abrogates the NEDDylation of cullin-1 by inactivation of Ubc12, the NEDD8-conjugating enzyme. Our work provides an example of T6SS manipulation of eukaryotic cells via alteration of the mitochondria.


Conflict of interest statement

The authors declare no competing interests.

Figures
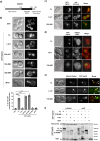
Fig. 1
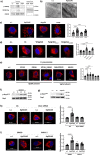
Fig. 1. K. pneumoniae VgrG4 RTD domain causes mitochondrial condensation in S. cerevisiae, whereas its VgrG domain is sufficient to drive co-localization with the mitochondrial ERMES component Mdm34.
a Scheme of the primary structure of VgrG4, depicting the domains considered in the development of truncated versions used in this work. b Yeast cells expressing the RTD domain of VgrG4 display condensed mitochondria. Cells were co-transformed with YEplac112-Ilv6-mCherry, a construct expressing a mCherry fusion to the mitochondrial Ilv6 protein, and the indicated GST-VgrG4 fusions or the empty pEG(KG) vector as a control (GST). Representative cells are shown and average percentages of cells with altered mitochondria with standard deviation error bars are shown in the graph; at least a total of 300 cells were analysed per smaple in three independent experiments. Two-tailed student’s T-test was applied for statistical significance between yeast cells harbouring the empty vector and the VgrG4 constructs with no adjustment for multiple comparison (p values indicated in the graph). c Fluorescence microscopy of co-expressed GFP-VgrG4 versions and the mitochondrial marker Ilv6-mCherry. Representative YPH499 strain transformants induced in galactose-containing media for 5 h are shown. d Co-localisation of GFP-VgrG4 spots and ER membranes. VHY87 cells, constitutively expressing the DsRed-HDEL marker, were transformed with pYES2-GFP-VgrG4 plasmids expressing the indicated versions, induced in galactose-containing media for 5 h and observed. e Bright field and fluorescence microscopy of the SLY001 strain co-transformed with the plasmids pAG424-Mdm34-DsRed (Mdm34 DsRed) and pYES2GFP-VgrG4 (FL) or pYES2GFP-VgrG4 1-517 (1-517) or pYES2GFP-VgrG4 518-899 (518-899). White arrows indicate co-localization events. Scales bars represent 5 µm in c, d, and e. f Immunoblots corresponding to a representative GST pull-down experiment on lysates from yeast cultures co-expressing Mdm34-HA. Images correspond to the same membrane hybridized with anti-HA (top panels) and anti-GST (lower panes) primary antibodies. Images are representative of three independent experiments.
Fig. 2
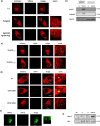
Fig. 2. VgrG4 is translocated into A549 cells in a T6SS-dependent manner and induces Drp1 dependent mitochondria fragmentation.
Translocation of VgrG4 into lung epithelial cells was analysed by immunoblot of phosphorylated GSK3β, GSK3β-tag and total GSK3β levels (a) in lysates of A549 cells infected with Kp52145 (Kp52) and the T6SS inactive clpV mutant (strain ΔclpV) for 2 hours or left uninfected (n.i.). Bacterial lysates (1 × 106 bacteria) were run for the same antibodies. Mitochondria ultrastructure was analysed by transmission electron microscopy (TEM) (b) in A549 cells infected with Kp52145 for 5 hours or left uninfected (n.i.) (magnification 20,000×, scale bar 200 nm). Mitochondria fragmentation (c) was analysed by confocal microscopy of A549 cells treated with mitotracker red (50 μM, 30 min before infection, in red) and infected for 3 h with Kp52145, the vgrG4 mutant (ΔvgrG4), or the complemented strain (comp, ΔvgrG4/pBAD30vgrG4) or left uninfected (n.i.). The number of branches/mitochondria was determined with the Mitochondria Analyzer plugin for ImageJ. The graph is the result of the analysis of twenty images per condition of three independent experiments representing average with standard deviation error bars; at least 100 cells were analysed per sample. Fragmentation was also analysed following infection with different Y. enterocolitica strains for 90 min (d) and following infection with different wild-type K. pneumoniae strains for 3 h (e); at least 100 cells were analysed per sample. Nuclei were stained with Hoechst (DAPI, in blue). All images and immunoblots are representative of three independent experiments. f Immunoblot analysis of the levels of phosphorylated Drp1 (S616) and total Drp1 in lysates of A549 cells infected with Kp52145 for the indicated times. Phosphorylation of Drp1 was also analysed in lysates of A549 cells infected with Y. enterocolitica (Ye) and YeVgrG4 for 90 min (g). h Confocal microscopy of A549 cells transfected with a non-silencing control (AS – All Stars) or with a Drp1 siRNA, and treated with mitotracker red (50 μM, 30 min, in red), and infected with Kp52145 for 3 h. To confirm further the role of Drp1 in VgrG4-induced mitochondria fragmentation, cells were treated with the Drp1 inhibitor Mdivi-1 (10 μM, 2 h before infection) or DMSO (vehicle solution) and infected with Kp52145 for 3 h (i); at least 100 cells were analysed per sample. One-way ANOVA with Tukey’s test for multiple comparison was applied for statistical significance for all the indicated comparisons (p values indicated in the graph).
Fig. 3
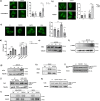
Fig. 3. VgrG4 colocalizes with the ER.
VgrG4 localisation within the cells was analysed by confocal microscopy of A549 mCherryER cells (ER in red). Cells were infected with YeVgrG4 for 90 min, or Kp52145 for 3 h, or left uninfected (n.i.) VgrG4 was stained with VSV-G or FLAG (in green) (a). b Immunoblot analysis of VgrG4-tagged with VSV-G, Calnexin (ER marker) and Tom20 (mitochondria marker) in fractionated lysates of A549 cells infected with YeVgrG4 for 90 min or left uninfected (n.i.). c Confocal microscopy of A549 mCherryER cells infected with Y. enterocolitica encoding N- and C-terminal truncated forms of VgrG4 tagged with VSV-G for 90 min. To determine the tethering protein associating with VgrG4, A549 mCherryER cells were transfected with siRNAs for VAPB or MFN2 and infected with YeVgrG4 for 90 min (d). e Confocal microscopy of A549 cells transfected with the MFN2-YFP plasmid (MFN2 in green) and infected with YeVgrG4 for 90 min. VgrG4 was stained with VSV-G. f Immunoblot analysis of VSV-G (VgrG4) and GFP (MFN2) levels in immunoprecipitates of A549. 24 h after transfection with a MFN2-YFP plasmid, cells were infected with YeVgrG4 for 90 min. Lysates were immunoprecipitated using anti-GFP antibody, and membranes were first probed with antibody against VSV-G and subsequently with antibody against GFP. Pre-immune mouse IgG served as negative control. All images and immunoblots are representative of three independent experiments.
Fig. 4
Fig. 4. VgrG4 triggers the transfer of Ca2+ from the ER to the mitochondria causing fragmentation.
a Confocal microscopy of A549 cells treated with mitotracker green (50 μM, 30 min before infection, in green) and then infected with Y. enterocolitica strains for 90 min, or with Kp52145 for 3 h. After 90 min or 3 h, Rhod2 in HBSS without calcium (50 µM, in red) was added for 30 min to stain the calcium accumulation in the mitochondria. b Rhod2 fluorescence was measured at 90 min post infection as indicated before in cells infected with Y. enterocolitica strains encoding truncated versions of VgrG4. Rhod2 accumulation was measured in cells knockdown for MFN2 (20 nM) by siRNA transfection and infected with YeVgrG4 (c). Cells were treated with ryanodine (100 nM), thapsigargin (1 μM), ruthenium red (100 μM), 2APB (10 μM) or Xestospogin C (10 μM) or treated with vehicle control (DMSO, no inhibitor) 60 min post infection. Rhod2 fluorescence was measured as previously described (d). e Rhod2 fluorescence was measured in cells transfected with siRNA for the mitochondria calcium uniporter (MCU) and infected for 2 h as described in b. f Confocal microscopy of A549 cells treated with mitotracker red (50 μM, 30 min, in red) and infected with YeVgrG4 for 90 min or Kp52145 for 3 h. Nuclei were stained with Hoechst (DAPI, in blue), and at least 100 cells were analysed per sample. Cells were treated with thapsigargin (1 μM, 30 min before end of infection) or DMSO (vehicle solution). Mitochondria fragmentation was assessed by confocal microscopy in cells transfected with siRNA for MCU (20 nM) or AS control and infected with YeVgrG4 (g); at least 100 cells were analysed per sample. The levels of S616 phosphorylated Drp1 and tubulin were determined by immunoblotting in lysates of YeVgrG4-infected A549 cells treated with thapsigargin (1 μM) or vehicle control (DMSO) for 30 min before the end of the infection (h). One-way ANOVA with Tukey’s multiple comparison test was applied for statistical significance (p values indicated in the graph). Images are representative of three independent experiments. Data in graphs are presented as the mean ± SD of five independent experiments measured in duplicate.
Fig. 5
Fig. 5. VgrG4 induces mitochondrial ROS production.
a Mitochondrial ROS (mtROS) was detected in infected A549 cells by confocal microscopy. Cells were treated with mitotracker green (50 μM, 30 min, in green), infected with YeVgrG4 for 90 min or with Kp52145 for 3 h, and treated with mitoSOX red mitochondrial superoxide indicator (10 µM for 30 min incubated in calcium free HBSS). Fluorescence was measured (b) in A549 cells upon infection with Y. enterocolitica strains for 90 min or K. pneumoniae strains for 3 h, followed by incubation with mitoSOX (10 µM incubated in calcium free HBSS for 30 min prior to measurement). c To demonstrate that VgrG4 localisation is important for ROS production, 2’,7’-dichlorofluorescein (DCF) was used to measure ROS production by A549 cells transfected with MFN2 siRNA or non-silencing (AS) control and infected with YeVgrG4 for 90 min. d DCF fluorescence was measured in A549 cells pre-treated with Mdivi-1 (10 µM, 2 h) or vehicle control (DMSO), and infected with YeVgrG4 for 90 min. Cells were treated with thapsigargin (1 μM), ruthenium red (100 μM), ryanodine (100 nM) 30 min before the end of infection. Mitochondria fragmentation was analysed by confocal microscopy of A549 cells treated with mitotracker red (50 μM, 30 min, in red) and stained with Hoechst (in blue). Cells were pre-treated with mitoTEMPO, a mitochondrial superoxide scavenger (10 μM, 2 h), and infected with Kp52145 for 3 h (e); at least 100 cells were analysed per sample. One-way ANOVA with Tukey’s multiple comparison test was applied for statistical significance (p values indicated in the graph).
Fig. 6
Fig. 6. NLRX1-mediated ROS controls NF-κB signalling and affects cullin 1 NEDDylation.
Immunofluorescence microscopy of A549 cells stained with antibody for the p65 NF-κB subunit. Cells were pre-treated with mitoTEMPO (10 μM, 2 h pre-infection), or with vehicle control (DMSO) and infected with Kp52145 for 3 h (a). b Cells were transfected with NLRX1 siRNA (50 nM) or a non-silencing control (AS) and infected with Kp52145 for 3 h. c Cells were infected with Kp52145, the vgrG4 mutant (ΔvgrG4) or the complemented strain (comp, ΔvgrG4/pBAD30vgrG4) for 3 h. The percentage of p65 NF-κB localised in the nucleus is represented on the graph in ac and it is the result of counting of minimum of hundred cells from each of three independent experiments. The total number of counted cells is indicated on top of each bar. ELISA of IL-8 secreted by A549 cells transfected with either NLRX1 siRNA (50 nM) or a non-silencing control (AS) and infected with K. pneumoniae strains. After 3 h of contact, the medium was replaced with medium containing gentamicin (100 µg/mL) to kill extracellular bacteria, and after 2 h the medium was collected (d). Images are representative of three independent experiments. Data in graphs are presented as the mean ± SD of three independent experiments. Two way-ANOVA with Holm-Sidak’s multiple comparisons test was used for statistical significance (p values indicated in the graph). e Immunoblot analysis of total IκBα and tubulin levels in lysates of A549 cells infected with Kp52145 for the indicated times. f Immunoblot analysis of phosphorylated IκBα and tubulin levels in lysates of A549 cells infected with Kp52145 for the indicated times. g Levels of phosphorylated Iκκα/β and tubulin in cells infected with Kp52145 for the indicated times. IκBα immunoprecipitation and immunoblot for K48-linkage specific polyubiquitin (Ub48) in cells treated with the proteasome inhibitor MG262 (5 μM, 2 h before infection), and infected with Kp52145 for 3 h or left uninfected (n.i.). Pre-immune mouse IgG was used as a control for immunoprecipitation (h). Immunoblot analysis of Cul-1 and tubulin levels in lysates of A549 cells infected with Kp52145 for 5 h, or treated with H2O2 (5 μM, 5 min). Cul-1 appears as a doublet, with the higher molecular band representing the NEDDylated form of Cul-1 (i). j Immunoblot analysis of Cul-1 and tubulin levels in lysates of A549 cells transfected with NLRX1 siRNA (50 nM) or a non-silencing control (AS), infected with Kp52145 for 5 h. k Cells were infected with Kp52145, the vgrG4 mutant (ΔvgrG4) or the complemented strain (comp) for 5 h, and the levels of Cul-1 and tubulin assessed by western blot. l Cells were pre-treated with mitoTEMPO (10 μM, 2 h pre-infection) or a vehicle control (DMSO), infected with Kp52145 for 5 h, and Ubc12 was immunoprecipitated followed by detection of NEDD8 and Ubc12 levels by immunoblotting. Images are representative of three independent experiments.
Fig. 7
Fig. 7. K. pneumoniae targets the mitochondria via its T6SS to promote infection.
Working model of K. pneumoniae manipulation of the mitochondria in epithelial cells by exploiting its T6SS. Kp52145 injects the trans-kingdom T6SS effector VgrG4 into epithelial in a T6SS-dependent manner. VgrG4 colocalises with the ER-mitochondria tethering protein mitofusin 2 (MFN2). The ER localization of VgrG4 results in the influx of calcium from the ER to the mitochondria via the MCU channel. Mitochondria calcium induces the activation of Drp1 leading to the fragmentation of the mitochondria network. Additionally, mitochondria calcium activates the mitochondria innate receptor NLRX1 to produce ROS. NLRX1-elicted ROS abrogates the NEDDylation of Cul-1, essential for the function of the ubiquitin ligase, E3-SCFβ−TrCP responsible for the ubiquitination of the IκBα after its phosphorylation by the Iκκα/β kinase. The degradation of IκBα by the ubiquitin proteasome allows the nuclear translation of NF-κB to launch an antimicrobial programme. Therefore, by targeting the NEDDylation of Cul-1, VgrG4 subverts the activation of host defences. Created with BioRender.com.

References

    1. Roger AJ, Munoz-Gomez SA, Kamikawa R. The Origin and Diversification of Mitochondria. Curr. Biol. 2017;27:R1177–R1192. doi: 10.1016/j.cub.2017.09.015. - DOI - PubMed
    1. Friedman JR, Nunnari J. Mitochondrial form and function. Nature. 2014;505:335–343. doi: 10.1038/nature12985. - DOI - PMC - PubMed
    1. Youle RJ, van der Bliek AM. Mitochondrial fission, fusion, and stress. Science. 2012;337:1062–1065. doi: 10.1126/science.1219855. - DOI - PMC - PubMed
    1. Spinelli JB, Haigis MC. The multifaceted contributions of mitochondria to cellular metabolism. Nat. Cell Biol. 2018;20:745–754. doi: 10.1038/s41556-018-0124-1. - DOI - PMC - PubMed
    1. Giorgi C, Marchi S, Pinton P. The machineries, regulation and cellular functions of mitochondrial calcium. Nat. Rev. Mol. Cell Biol. 2018;19:713–730. doi: 10.1038/s41580-018-0052-8. - DOI - PubMed

Publication types

MeSH terms