. 2023 Feb 17;6(1):185.
doi: 10.1038/s42003-023-04542-6.

Bidirectional alterations in brain temperature profoundly modulate spatiotemporal neurovascular responses in-vivo

Affiliations

Bidirectional alterations in brain temperature profoundly modulate spatiotemporal neurovascular responses in-vivo

Luke W Boorman et al. Commun Biol. .

Abstract

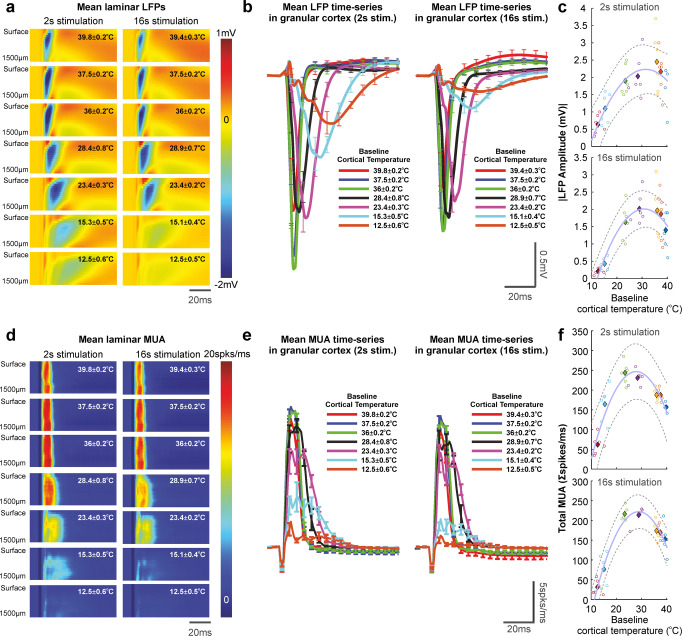
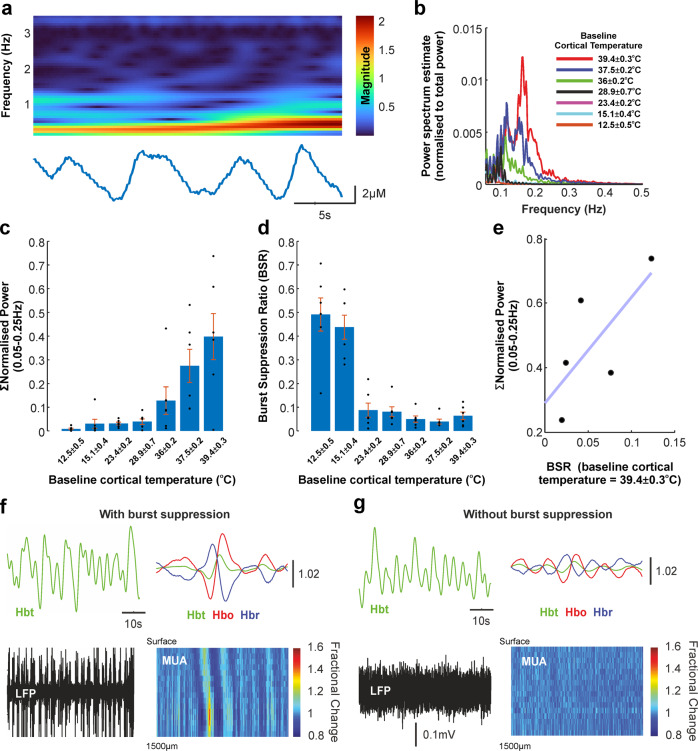
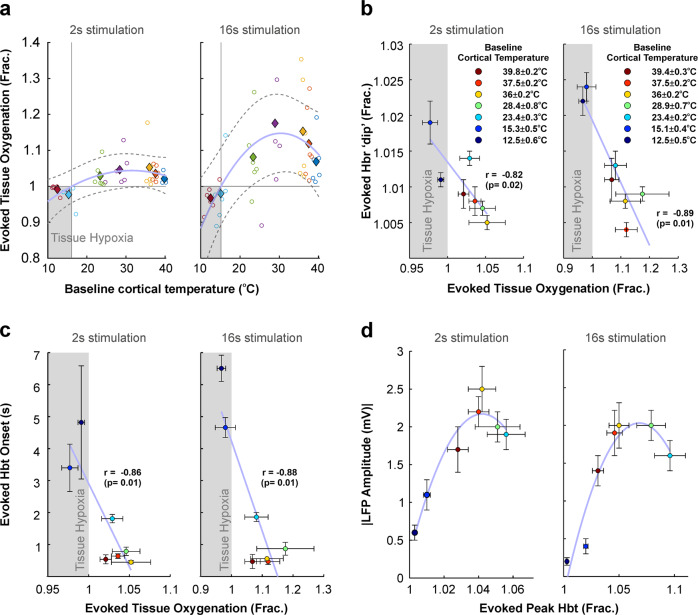
Neurovascular coupling (NVC) is a mechanism that, amongst other known and latent critical functions, ensures activated brain regions are adequately supplied with oxygen and glucose. This biological phenomenon underpins non-invasive perfusion-related neuroimaging techniques and recent reports have implicated NVC impairment in several neurodegenerative disorders. Yet, much remains unknown regarding NVC in health and disease, and only recently has there been burgeoning recognition of a close interplay with brain thermodynamics. Accordingly, we developed a novel multi-modal approach to systematically modulate cortical temperature and interrogate the spatiotemporal dynamics of sensory-evoked NVC. We show that changes in cortical temperature profoundly and intricately modulate NVC, with low temperatures associated with diminished oxygen delivery, and high temperatures inducing a distinct vascular oscillation. These observations provide novel insights into the relationship between NVC and brain thermodynamics, with important implications for brain-temperature related therapies, functional biomarkers of elevated brain temperature, and in-vivo methods to study neurovascular coupling.


Conflict of interest statement

The authors declare no competing interests.

Figures

Fig. 1
Fig. 1. A novel methodology to precisely modulate cortical temperature and monitor neurovascular responses in the rat.
a Schematic of cortical cooling approach using computer-based proportional integration and differentiation (PID) to thermally manipulate cortical regions. b Digital images of cortical surface illustrating the positioning of the multi-channel electrode and multi-sensor tissue oxygenation and temperature probe in whisker barrel cortex (top), and identification of major surface arteries and veins (bottom). c Manipulation of cortical temperature using a skull-attached fluidic chamber induced reliable and stable alterations in cortical temperature. d Changes in cortical temperature canonically altered baseline tissue oxygenation due to changes in the affinity of haemoglobin to oxygen. e 2 s and 16 s whisker stimulation-induced alterations in cortical temperature that varied as a function of baseline cortical temperature, such that influx of blood with functional hyperaemia induced a cooling effect when the cortical temperature was above core (~37oC), and the opposite warming effect when baseline cortical temperature was below core temperature. ce Open circles denote individual animal data, with each colour representing each modulated temperature condition. Filled diamonds of the same colour indicate average across animals. Dashed grey lines denote 95% confidence bounds of curve fitting (light blue in c and d, solid grey in e) to averaged data. See the main text for curve fitting and statistical details.
Fig. 2
Fig. 2. Evoked local field potential (LFP) and multi-unit activity (MUA) responses to 2 s and 16 s whisker stimulation in barrel cortex under a range of cortical temperatures.
a Example laminar profile of averaged LFP responses to whisker stimulation as a function of cortical temperature. b Mean evoked LFP timeseries in the granular cortex to whisker stimulation. c Non-linear relationship between baseline cortical temperature and evoked absolute LFP amplitude. d Laminar profile of average MUA responses to whisker stimulation as a function of cortical temperature. e Mean evoked MUA timeseries in the granular cortex to whisker stimulation. f Evoked MUA responses exhibited a non-linear relationship with baseline cortical temperature as seen in evoked LFP measures. c, f Open circles denote individual animal data, with each colour representing each modulated temperature condition. Filled diamonds of the same colour indicate average across animals. Dashed grey lines denote 95% confidence bounds of curve fitting (light blue) to averaged data. See the main text for curve fitting and statistical details.
Fig. 3
Fig. 3. Evoked haemodynamic (total haemoglobin concentration [Hbt], oxyhaemoglobin [Hbo], and deoxyhaemoglobin [Hbr]) responses to 2 s and 16 s whisker stimulation in barrel cortex under a range of cortical temperatures.
a Example spatiotemporal changes in Hbt and Hbr in a single animal during 16 s whisker stimulation. b ROI extracted mean Hbt, Hbo and Hbr timeseries during 2 s and 16 s whisker stimulation. Note middle insets indicating an early increase in Hbr (“deoxy-dip”) at cool cortical temperatures and right insets illustrating the emergence of a low-frequency oscillation at elevated cortical temperatures. c Non-linear relationship between baseline cortical temperature and peak evoked Hbt. d Non-linear monotonically decreasing relationship between baseline cortical temperature and evoked Hbt onset. e Increased presence of a rise in Hbr (‘deoxy-dip’) during 2 s and 16 s whisker stimulation with decreasing cortical temperature. ce Open circles denote individual animal data, with each colour representing each modulated temperature condition. Filled diamonds of the same colour indicate average across animals. Dashed grey lines denote 95% confidence bounds of curve fitting (light blue) to averaged data. See the main text for curve fitting and statistical details.
Fig. 4
Fig. 4. Emergence of a low-frequency oscillation at elevated cortical temperatures.
a Continuous wavelet transform of a sample inter-stimulus period in which a low-frequency oscillation with range ~0.05–0.25 Hz can be clearly discerned in the Hbt timeseries. b Normalised Welch’s power spectrum estimate (0.05–0.25 Hz) of concatenated experimental Hbt timeseries (16 s whisker stimulation condition) across the range of cortical temperatures studied (see key) averaged across animals (error bars omitted for clarity, see quantification in c). c Quantification of normalised data in (b) summed across animals (N = 6), indicating an increase in power in the frequency range 0.05–0.25 Hz with increasing cortical temperature. d Burst suppression ratio (BSR) across animals (N = 6), a measure of the prevalence of burst suppression phenomena in LFP timeseries, was found to be highest at cooler cortical temperatures (consistent with previous reports) and to decrease with increasing cortical temperature. e BSR and normalised power in the frequency range associated with the observed low-frequency oscillation at the most elevated cortical temperature studied, in 5/6 animals which displayed burst suppression, was found to be strongly correlated albeit with a positive y-axis intercept, suggesting that burst suppression does not solely underpin the emergence of the pathological oscillation. f, g Corroboration of interpretation from (e) in two contrasting example animals, in which the pathological oscillation is manifest in the presence (e) and absence (f) of burst suppression, the former being associated with an increase in infragranular MUA at physiological timescales for neurovascular coupling.
Fig. 5
Fig. 5. Evaluation of oximetry, hemodynamic responses, and neurovascular coupling to whisker stimulation under a range of cortical temperatures.
a Non-linear relationship between changes in evoked tissue oxygenation as a function of cortical temperature to 2 s and 16 s whisker stimulation. Open circles denote individual animal data, with each colour representing each modulated temperature condition. Filled diamonds of the same colour indicate average across animals. Dashed grey lines denote 95% confidence bounds of curve fitting (light blue) to averaged data. b Negative linear correlation between changes in evoked tissue oxygenation and magnitude of the increase in evoked Hbr concentration (’deoxy-dip’) across cortical temperatures. c Negative linear correlation between changes in evoked tissue oxygenation and onset time of evoked Hbt response. d Non-linear relationship between evoked LFP responses to 2 s and 16 s whisker stimulation, and magnitude of peak evoked Hbt response. ac Shaded areas indicate cool cortical temperatures during which sensory stimulation induces a transient period of hypoxia. bd Data points represent averages across animals with xy-error bars as SEM, and colour coded to each modulated temperature condition as given in key in b. See the main text for curve fitting and statistical details.

References

    1. Schaeffer S, Iadecola C. Revisiting the neurovascular unit. Nat. Neurosci. 2021;24:1198–1209. doi: 10.1038/s41593-021-00904-7. - DOI - PMC - PubMed
    1. Logothetis NK, Pauls J, Augath M, Trinath T, Oeltermann A. Neurophysiological investigation of the basis of the fMRI signal. Nature. 2001;412:150–157. doi: 10.1038/35084005. - DOI - PubMed
    1. Iturria-Medina Y, et al. Early role of vascular dysregulation on late-onset Alzheimer’s disease based on multifactorial data-driven analysis. Nat. Commun. 2016;7:11934. doi: 10.1038/ncomms11934. - DOI - PMC - PubMed
    1. Zlokovic BV. Neurovascular mechanisms of Alzheimer’s neurodegeneration. Trends Neurosci. 2005;28:202–208. doi: 10.1016/j.tins.2005.02.001. - DOI - PubMed
    1. Zlokovic BV. Neurovascular pathways to neurodegeneration in Alzheimer’s disease and other disorders. Nat. Rev. Neurosci. 2011;12:723–738. doi: 10.1038/nrn3114. - DOI - PMC - PubMed

Publication types