. 2023 Jun;19(6):740-749.
doi: 10.1038/s41589-022-01251-9. Epub 2023 Feb 16.

Site-specific encoding of photoactivity and photoreactivity into antibody fragments

Affiliations

Site-specific encoding of photoactivity and photoreactivity into antibody fragments

Thomas Bridge et al. Nat Chem Biol. 2023 Jun.

Abstract

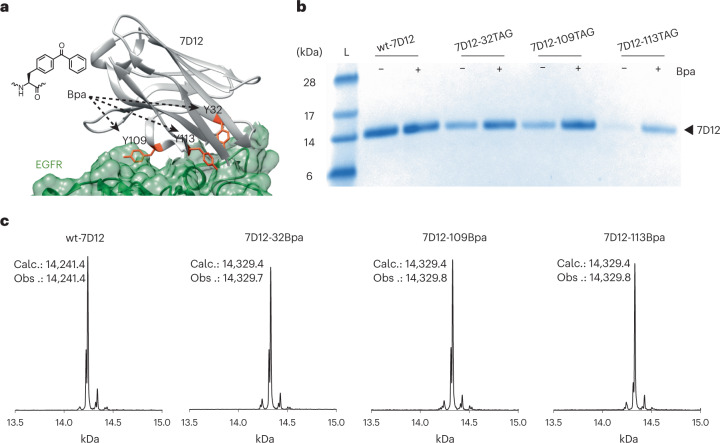
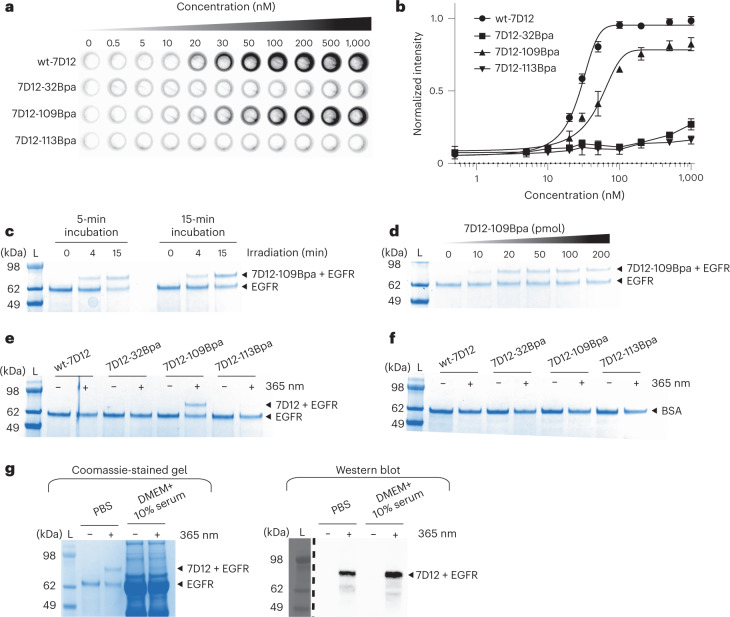
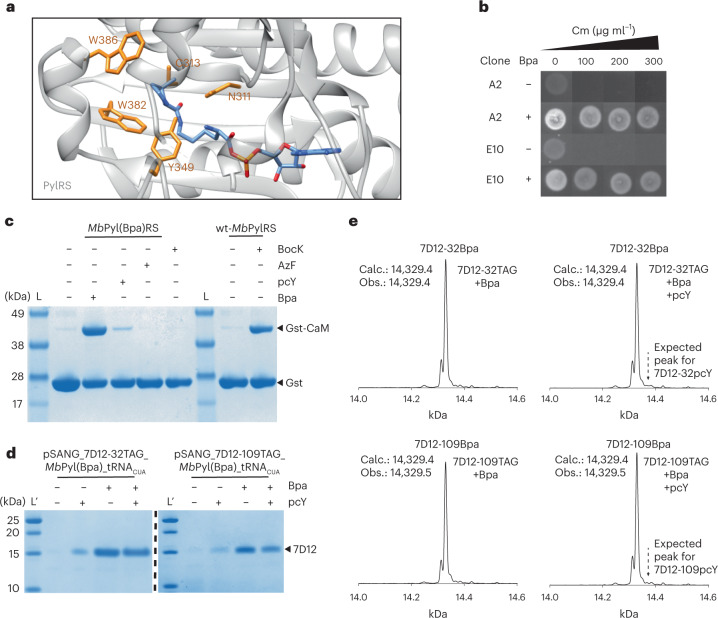
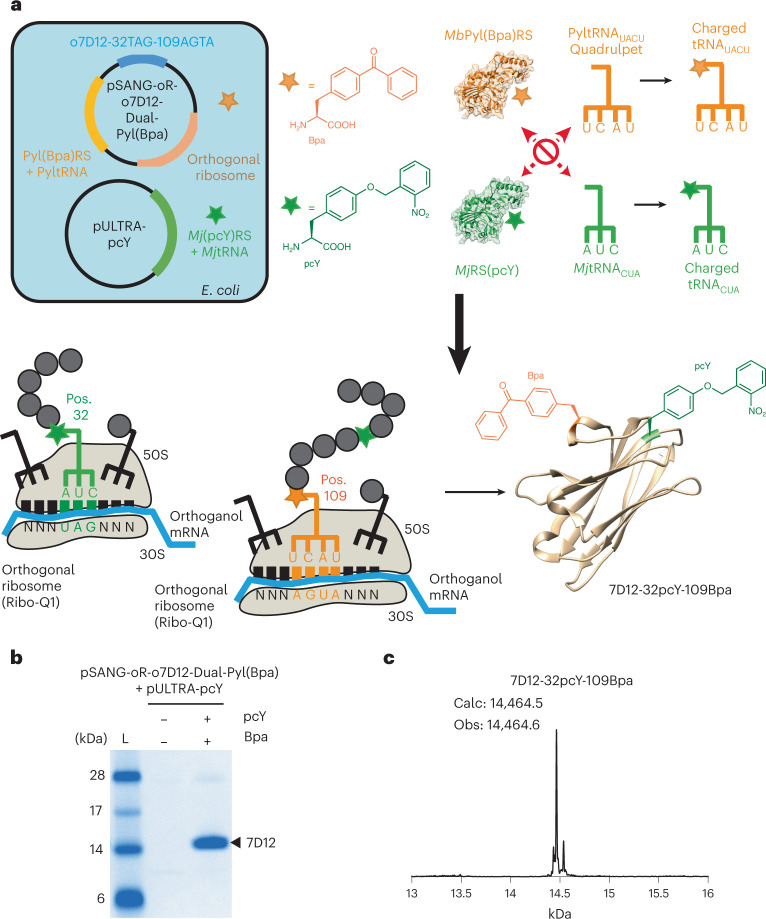
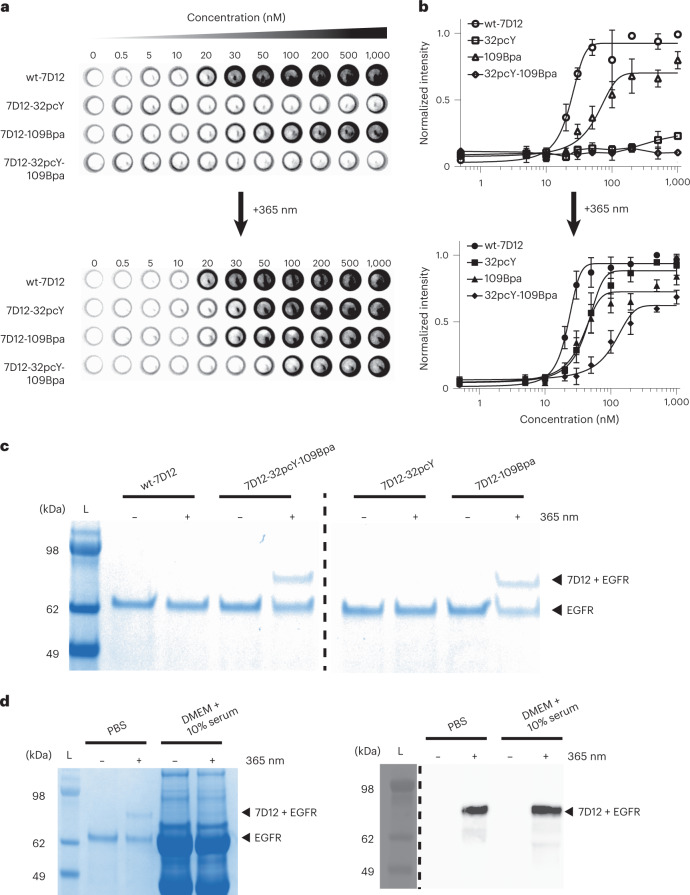
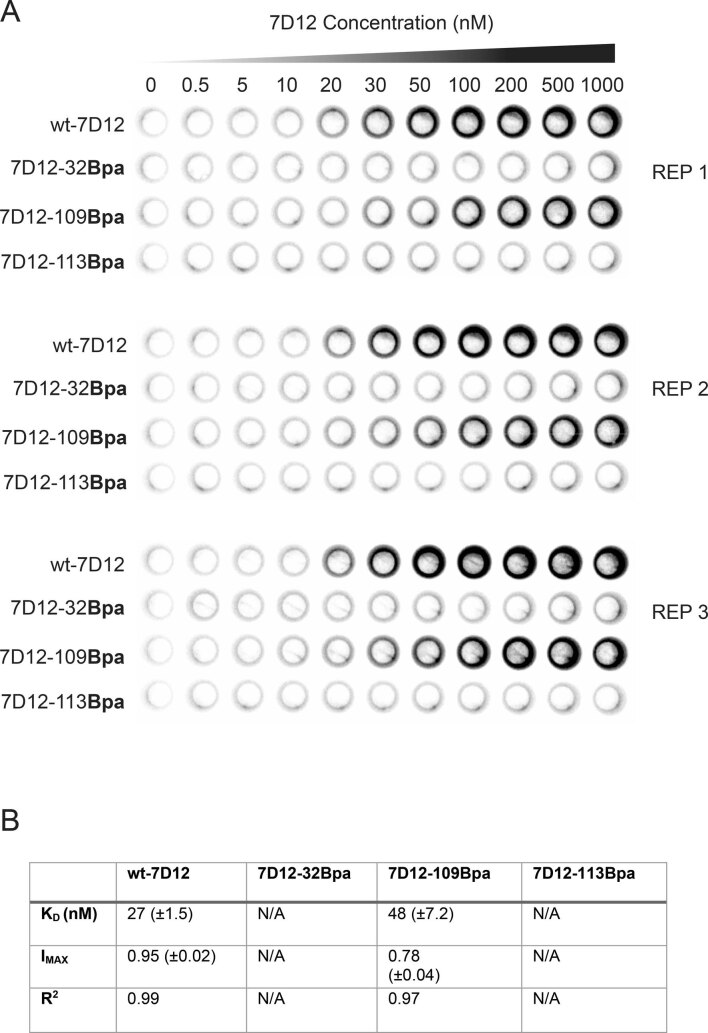
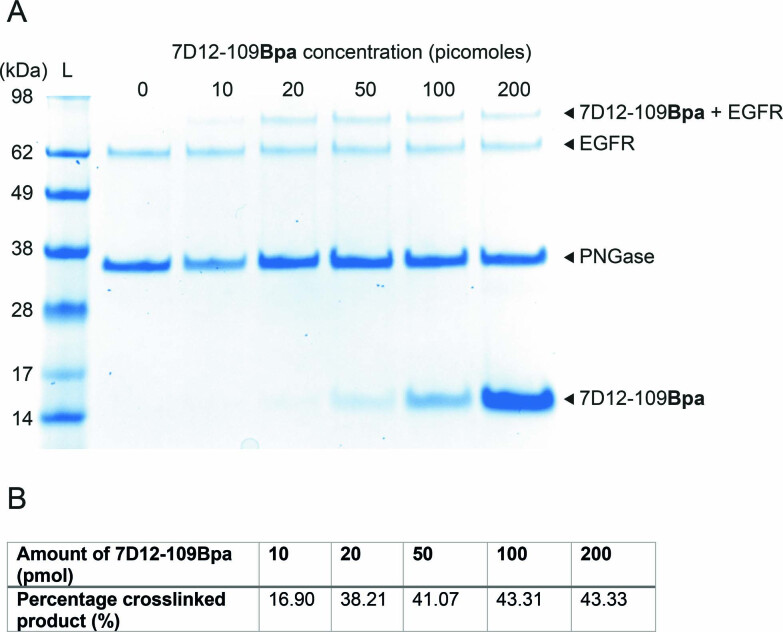
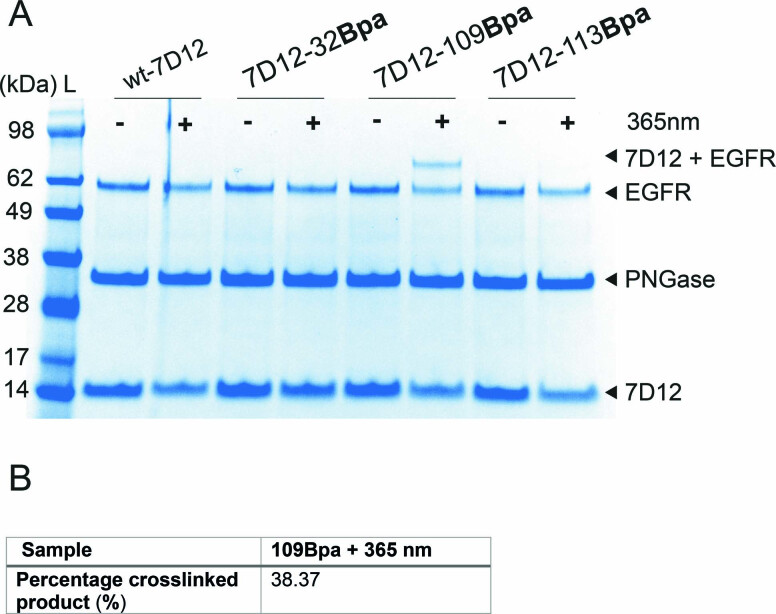
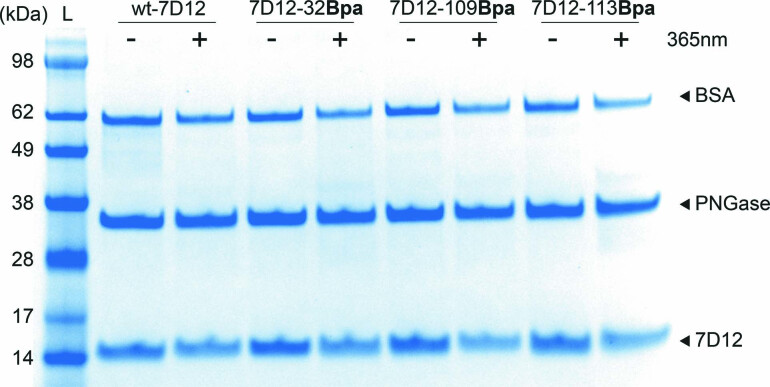
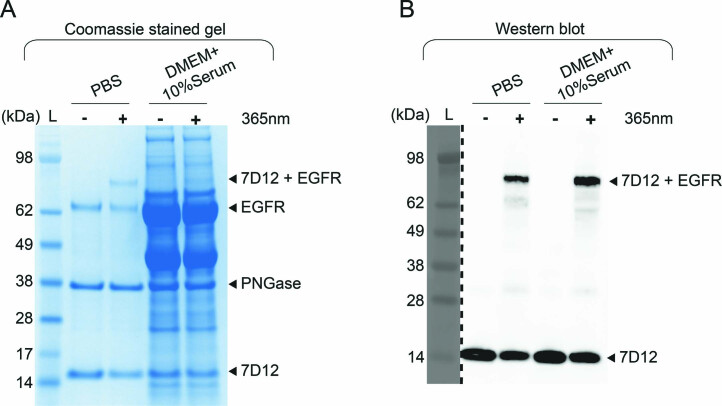
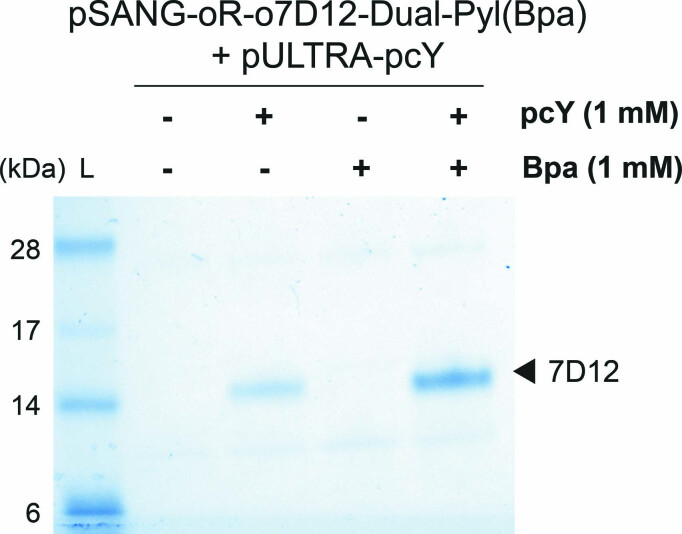
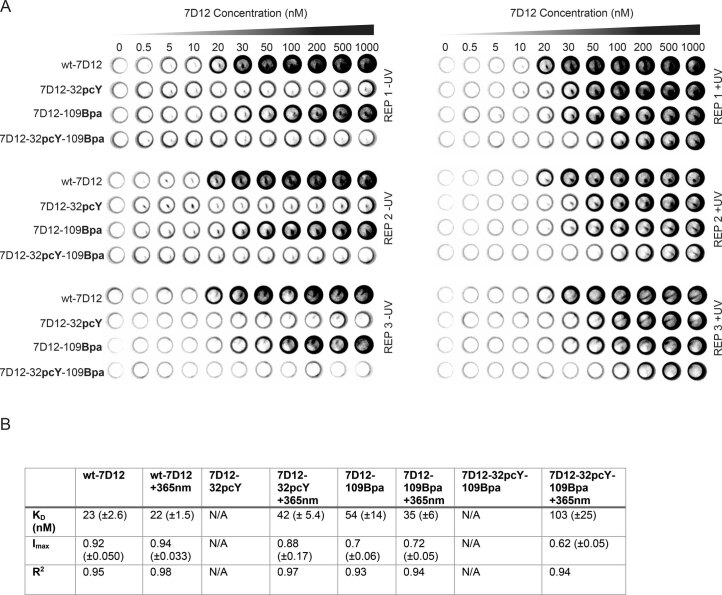
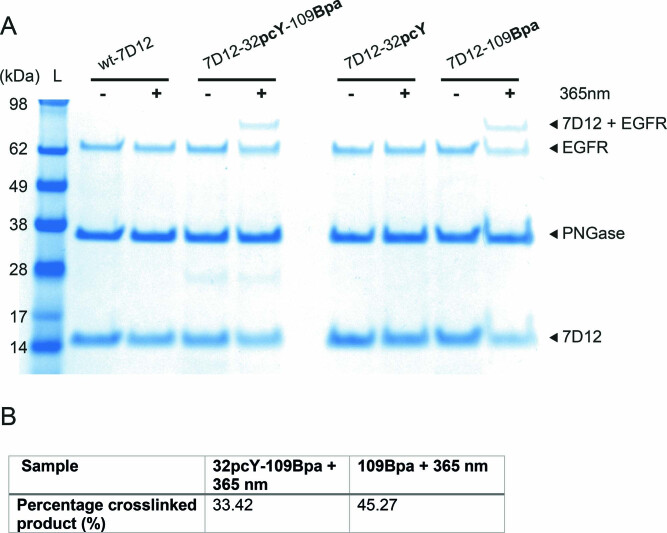
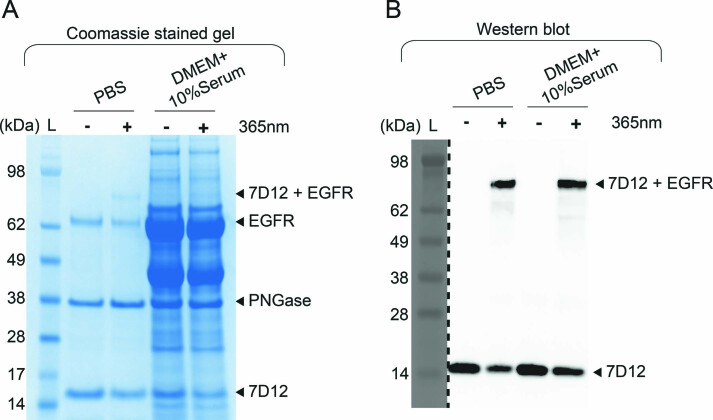
Design of biomolecules that perform two or more distinct functions in response to light remains challenging. Here, we have introduced concurrent photoactivity and photoreactivity into an epidermal growth factor receptor (EGFR)-targeting antibody fragment, 7D12. This was achieved by site-specific incorporation of photocaged tyrosine (pcY) for photoactivity and p-benzoyl-ʟ-phenylalanine (Bpa) for photoreactivity into 7D12. We identified a position for installing Bpa in 7D12 that has minimal effect on 7D12-EGFR binding affinity in the absence of light. Upon exposure to 365-nm light, this Bpa-containing 7D12 mutant forms a covalent bond with EGFR in an antigen-specific manner. We then developed a method for site-specific incorporation of pcY and Bpa at two distinct sites in 7D12. Finally, we demonstrated that in the absence of light, this pcY- and Bpa-containing mutant of 7D12 does not bind to EGFR, but irradiation with 365-nm light activates (1) specific binding and (2) covalent bond formation with EGFR.


Conflict of interest statement

T.B., U.W. and A.S. have filed a patent application related to the research described in this manuscript (Patent application no. GB 2213242.7). The other authors declare no competing interests.

Figures

Fig. 1
Fig. 1. Site-specific incorporation of Bpa in a single-chain antibody fragment, 7D12.
a, Crystal structure of 7D12 (gray)–EGFR domain III (green) complex (Protein Data Bank ID: 4KRL). Residues Y32, Y109 and Y113 (orange) in the antigen binding pocket of 7D12 were replaced with Bpa. b, Expression of wt-7D12 and its three amber mutants (viz. 32TAG, 109TAG and 113TAG) without and with Bpa. Comparison of band intensities for amber mutants with wt-7D12 shows efficient incorporation of Bpa. Full-length protein expressed for negative samples (−Bpa) indicates that MjRS(Bpa) might incorporate canonical amino acids in the absence of Bpa. The lane marked L is the Invitrogen SeeBlue Plus2 Pre-stained Protein Standard (catalog no. LC5925). These experiments were repeated three times with similar results. c, ESI-MS results for wt-7D12, 7D12-32Bpa, 7D12-109Bpa and 7D12-113Bpa demonstrate site-specific incorporation of Bpa for expression of amber mutants of 7D12 with Bpa (see Supplementary Fig. 2 for MS data before deconvolution). Calc. is the calculated average molecular mass of the protein, and Obs. is the observed molecular mass from ESI-MS. Source data
Fig. 2
Fig. 2. Development of the high-affinity photoreactive 7D12 mutant.
a, On-cell binding assay demonstrates that the 7D12-109Bpa mutant binds to EGFR, whereas 7D12-32Bpa and 7D12-113Bpa show near-background binding. These experiments were performed in triplicates (Extended Data Fig. 1). b, Chemiluminescence intensities from on-cell binding experiments were quantified using the CLARIOstar plate reader. Normalized intensities were plotted against the concentration of 7D12, where the x axis is in log10 scale. Each point in the graph represents mean values of normalized intensities ± s.d., designated as the error bar, from three replicates. Data were fitted to the sigmoidal nonlinear equation using GraphPad to obtain binding affinity values (Kd). For wt-7D12 and 7D12-109Bpa, Kd was estimated to be 27 (±1.5) nM and 48 (±7.2) nM, respectively (Extended Data Fig. 1). For wt-7D12 and 7D12-109Bpa, lines show the fitting trace. For 7D12-32Bpa and 7D12-113Bpa, lines show connection between individual points. c, Incubation time before irradiation has little effect on photocrosslinking between 7D12-109Bpa and EGFR, whereas with an increase in irradiation time, photocrosslinking efficiency increases from 17% at 5-min irradiation to 46% at 15-min irradiation (Extended Data Fig. 2). These experiments were repeated twice with similar results. d, Photocrosslinking efficiency saturates above 100 pmol of 7D12-109Bpa (Extended Data Fig. 3). These experiments were repeated twice with similar results. e, Photocrosslinked product was observed only with 7D12-109Bpa, demonstrating that photocrosslinking requires Bpa at position 109 (Extended Data Fig. 4). These experiments were repeated twice with similar results. f, No photocrosslinking was observed between BSA and Bpa-containing 7D12 mutants (Extended Data Fig. 5). These experiments were repeated twice with similar results. g, The left panel shows Coomassie-stained gel demonstrating successful photocrosslinking of 7D12-109Bpa to sEGFR in PBS. For the same reaction in serum-containing media, bands for sEGFR and photocrosslinked product are not clear due to serum proteins. The right panel shows an anti-His6 antibody western blot that detects the C-terminal His6 tag on 7D12-109Bpa. The bands show the sEGFR–7D12-109Bpa complex demonstrating successful photocrosslinking in serum-containing media (Extended Data Fig. 6). These experiments were repeated twice with similar results. For gel images, lanes marked L are the Invitrogen SeeBlue Plus2 Pre-stained Protein Standard (catalog no. LC5925). Source data
Fig. 3
Fig. 3. Development of an efficient and selective MbPylRS/tRNA pair for site-specific incorporation of Bpa.
a, Crystal structure of PylRS (gray) with adenylated pyrrolysine (blue; Protein Data Bank ID 2Q7H). Residues N311, C313, W382 and W386 (orange) in MbPylRS were randomized to all combinations of amino acids for directed evolution experiments. b, To isolate Bpa-specific mutants of MbPylRS, three rounds of directed evolution were performed, and subsequently, 192 clones were screened (Supplementary Fig. 7). Two clones, A2 and E10, survived on chloramphenicol concentration up to 300 μg ml−1 in the presence of 1 mM Bpa (A2 +Bpa and E10 +Bpa) but did not survive in the absence of Bpa on chloramphenicol concentration at and above 100 μg ml−1 (A2 −Bpa and E10 −Bpa). Both clones were the same and had the following mutations compared with the wild-type MbPylRS: N311Q, C313T and W382A, in addition to the Y349F preprogrammed mutation. c, Expression of gst-1TAG-cam using MbPyl(Bpa)RS without ncAA, with 1 mM Bpa, 1 mM pcY, 1 mM AzF or 1 mM BocK. Control expression using wt-MbPylRS that is known to efficiently incorporate BocK was also performed. Comparison of band intensities of full-length Gst-CaM demonstrates that newly evolved MbPyl(Bpa)RS is highly efficient and specific at incorporating Bpa (Supplementary Fig. 8). These experiments were repeated twice with similar results. d, Selective incorporation of Bpa at positions 32 and 109 in 7D12 using MbPyl(Bpa)RS. Comparison of band intensities for expression with Bpa (1 mM), pcY (1 mM), and both Bpa (1 mM) and pcY (1 mM) indicates selective incorporation of Bpa in the presence of pcY. These experiments were repeated twice with similar results. e, ESI-MS of amber mutants of 7D12 expressed using MbPyl(Bpa)RS in the presence of both Bpa (1 mM) and pcY (1 mM) demonstrates that Bpa is selectively incorporated. The dotted lines with arrows indicate expected molecular masses if pcY was incorporated (Supplementary Fig. 9). For gel images, lanes marked L are the Invitrogen SeeBlue Plus2 Pre-stained Protein Standard (catalog no. LC5925), and lanes marked Lʹ are the Thermo Scientific PageRuler Unstained Low Range Protein Ladder (catalog no. 26632). Source data
Fig. 4
Fig. 4. Site-specific dual incorporation of pcY and Bpa in 7D12.
a, A single plasmid containing genes to assemble the orthogonal ribosome, our newly evolved Bpa-specific MbPyl(Bpa)RS, AGTA-decoding evolved MbPyltRNAUACU, and 7D12 on orthogonal RBS was constructed. We named this plasmid pSANG-oR-o7D12-Dual-Pyl(Bpa). Cotransformation of this plasmid with pULTRA-pcY allowed for expression of 7D12-32pcY-109Bpa. mRNA, messenger RNA; Pos., position. b, Expression of 7D12-32pcY-109Bpa. Full-length 7D12 observed when expression was performed with both pcY (1 mM) and Bpa (1 mM; +pcY/+Bpa lane). See Extended Data Fig. 7 (some full-length protein also observed for expression performed with only pcY (+pcY/−Bpa lane) that might be due to incorporation of pcY by MbPyl(Bpa)RS in the absence of Bpa). These experiments were repeated twice with similar results. The lane marked L is the Invitrogen SeeBlue Plus2 Pre-stained Protein Standard (catalog no. LC5925). c, ESI-MS of 7D12-32pcY-109Bpa is consistent with site-specific incorporation of pcY and Bpa in 7D12. See Supplementary Fig. 11 for MS data before deconvolution. The ESI-MS data also show a minor peak at 14,537 Da, which is a mass gain of 72 Da on 7D12-32pcY-109Bpa. This peak cannot be explained by dual incorporation of pcY or Bpa, and we are unsure of its origin. Source data
Fig. 5
Fig. 5. Development of photoactive-photoreactive 7D12 mutant.
a, The on-cell binding assay demonstrates that 7D12-32pcY-109Bpa is a photoactive antibody. These experiments were performed in triplicate (Extended Data Fig. 8). b, The normalized intensities from the on-cell binding assay were plotted against the concentration of 7D12, where the x axis is in log10 scale. Each point in the graph represents mean values of normalized intensities ± s.d., designated as error bars, from three replicates. The data were fitted to the sigmoidal nonlinear equation using GraphPad to obtain binding affinity values (Kd). Before irradiation, the Kd values of wt-7D12 and 7D12-109Bpa were 23 (±2.6) nM and 54 (±14) nM, respectively. After irradiation, the Kd values of wt-7D12, 7D12-32Bpa, 7D12-109Bpa and 7D12-32pcY-109Bpa were 22 (±1.5) nM, 42 (±5.4) nM, 35 (±6) nM and 103 (±25) nM, respectively (Extended Data Fig. 8). For 7D12-32Bpa and 7D12-32pcY-109Bpa before irradiation, lines show connection between individual points. For all other experiments, lines show the fitting trace. c, Photocrosslinked product observed only with 7D12-109Bpa and 7D12-32pcY-109Bpa for samples irradiated with 365-nm light, demonstrating that 7D12-32pcY-109Bpa gets activated and then forms a covalent bond with EGFR upon irradiation with 365-nm light (Extended Data Fig. 9). These experiments were repeated twice with similar results. d, Photocrosslinking of 7D12-32pcY-109Bpa to sEGFR performed in DMEM containing 10% serum. The left panel shows Coomassie-stained gel demonstrating photocrosslinking of 7D12-32pcY-109Bpa to sEGFR in the control reaction performed in PBS. For the same reaction performed in serum-containing media, bands corresponding to sEGFR and photocrosslinked product are not clear on Coomassie-stained gel due to the presence of serum proteins (Extended Data Fig. 10). The right panel shows the anti-His6 western blot of the photocrosslinking reactions that detects the C-terminal His6 tag on 7D12 (Extended Data Fig. 10). The bands show the sEGFR–7D12 complex demonstrating successful photocrosslinking of 7D12-32pcY-109Bpa in serum-containing media. These experiments were repeated twice with similar results. For gel images, lanes marked L are the Invitrogen SeeBlue Plus2 Pre-stained Protein Standard (catalog no. LC5925). Source data
Extended Data Fig. 1
Extended Data Fig. 1. On-cell binding assay to measure the binding affinity of wt-7D12, 7D12-32Bpa, 7D12-109Bpa, and 7D12-113Bpa to Epidermal Growth Factor Receptor (EGFR) expressed on the surface of A431 cells.
(A) Results demonstrate that site-specially incorporated Bpa at position 109 in 7D12 has little effect on 7D12-EGFR binding affinity. To ensure reproducibility, experiments were performed in triplicates represented as REP 1, REP 2 and REP 3. (B) Quantitative assessment of binding between Bpa-containing 7D12 mutants and EGFR. Chemiluminescence intensities obtained from on-cell binding experiments for wt-7D12, 7D12-32Bpa, 7D12-109Bpa, and 7D12-113Bpa were quantified using CLARIOstar plate reader. For each plate the maximum value of intensity was normalized to 1 and the minimum normalized to zero. normalization is performed to ensure that data between replicates could be compared. The normalized intensity was plotted against concentration of 7D12. The data was fitted to sigmoidal nonlinear equation using GraphPad as shown in Fig. 2b. KD is the concentration of the 7D12, where chemiluminescence intensity is half of the maximum chemiluminescence intensity. IMAX is the normalized maximum chemiluminescence intensity at saturation. Values shown in brackets denote the standard deviation (s.d.) from the mean value of three replicates. Source data
Extended Data Fig. 2
Extended Data Fig. 2. Effect of incubation time prior to irradiation, and irradiation time on photocrosslinking efficiency between 7D12-109Bpa and EGFR assessed using denaturing SDS–PAGE.
(A) In the Coomassie stained gel image, the band higher than EGFR is photocrosslinked 7D12-109Bpa + EGFR complex. This is the full gel image for data shown in Fig. 2c. Lane marked L is the Invitrogen SeeBlue Plus2 Pre-stained Protein Standard (Catalog no. LC5925). These results demonstrate that i) incubation time prior to irradiation has little effect on photocrosslinking efficiency, and ii) irradiation time has a profound effect on photocrosslinking efficiency. (B) Percentage crosslinked product in different lanes is calculated by measuring the intensity of the band corresponding to 7D12-109Bpa + EGFR and EGFR. Source data
Extended Data Fig. 3
Extended Data Fig. 3. Effect of the amount of 7D12-109Bpa on the photocrosslinking efficiency between 7D12-109Bpa and EGFR assessed using denaturing SDS–PAGE.
For these experiments, the amount of EGFR is 10 picomoles, incubation time prior to irradiation is 5 min, irradiation time with 365 nm light is 10 min, and the amount of 7D12-109Bpa is varied from 0 to 200 picomoles. (A) In the Coomassie stained gel image, the band higher than EGFR is photocrosslinked 7D12-109Bpa + EGFR complex. This is the full gel image for data shown in Fig. 2d. Lane marked L is the Invitrogen SeeBlue Plus2 Pre-stained Protein Standard (Catalog no. LC5925). These results demonstrate that the photocrosslinking efficiency plateaus at 100 picomoles of 7D12-109Bpa. (B) Percentage crosslinked product at different amounts of 7D12-109Bpa calculated by measuring the intensity of the band corresponding to 7D12-109Bpa + EGFR and EGFR. Source data
Extended Data Fig. 4
Extended Data Fig. 4. Light dependent covalent bond formation between 7D12 and EGFR is antibody-specific.
For these experiments, the amount of EGFR is 10 picomoles, incubation time prior to irradiation is 5 min, irradiation time with 365 nm light is 10 min, and the amount of 7D12 and its Bpa-containing mutants is 100 picomoles. (A) In the Coomassie stained gel image, the band higher than EGFR is photocrosslinked 7D12-109Bpa + EGFR complex. This is the full gel image for data shown in Fig. 2e. Lane marked L is the Invitrogen SeeBlue Plus2 Pre-stained Protein Standard (Catalog no. LC5925). These results demonstrate that the photocrosslinking occurs only for 7D12-109Bpa upon irradiation with 365 nm light. (B) Percentage crosslinked product calculated by measuring the intensity of the band corresponding to 7D12-109Bpa + EGFR and EGFR. These experiments were repeated twice with similar results. Source data
Extended Data Fig. 5
Extended Data Fig. 5. Light dependent covalent bond formation between 7D12 and EGFR is antigen-specific.
No photocrosslinked product is observed when 7D12 and its Bpa-containing mutants are irradiated with 365 nm in the presence of Bovine Serum Albumin (BSA) and not with EGFR. For these experiments, the amount of BSA is 10 picomoles, incubation time prior to irradiation is 5 min, irradiation time with 365 nm light is 10 min, and the amount of 7D12 and its Bpa-containing mutants is 100 picomoles. This is the full gel image for data shown in Fig. 2 f. Lane marked L is the Invitrogen SeeBlue Plus2 Pre-stained Protein Standard (Catalog no. LC5925). These experiments were repeated twice with similar results. Source data
Extended Data Fig. 6
Extended Data Fig. 6. Photocrosslinking of 7D12-109Bpa with EGFR occurs in DMEM containing 10% serum.
(A) The Coomassie stained gel demonstrates successful photocrosslinking of 7D12-109Bpa to EGFR in phosphate buffered saline (PBS). For the same reaction performed in serum containing media, bands corresponding to EGFR and photocrosslinked product are not clear on Coomassie stained gel due to the presence of other proteins in the serum. This is the full gel image for data shown in Fig. 2 g. Lane marked L is the Invitrogen SeeBlue Plus2 Pre-stained Protein Standard (Catalog no. LC5925). This experiment was repeated twice with similar results. (B) The anti-His6 antibody western blot detects the C-terminal His6 tag on 7D12-109Bpa. The photocrosslinked product, 7D12 + EGFR (top band in the blot) appears in lanes where 7D12-109Bpa/sEGFR in PBS or in serum containing media are irradiated with 365 nm light, demonstrating successful photocrosslinking under both conditions. The lower band corresponds to 7D12-109Bpa and serves as a control demonstrating detection of 7D12-109Bpa in all samples. The image was acquired using GE ImageQuant™ LAS 4000 gel imager. This is the full gel image for data shown in Fig. 2g. Lane marked L is the Invitrogen SeeBlue Plus2 Pre-stained Protein Standard (Catalog no. LC5925). These experiments were repeated twice with similar results. Source data
Extended Data Fig. 7
Extended Data Fig. 7. Expression of 7D12 using cells containing pSANG-oR-o7D12-Dual-Pyl(Bpa) and pULTRA-pcY plasmids performed without non-canonical amino acids, with 1 mM pcY, with 1 mM Bpa, and with 1 mM each of pcY and Bpa.
Full-length protein observed for expression performed with only pcY (+pcY/ -Bpa lane) might be due to incorporation of pcY by MbPyl(Bpa)RS in the absence of Bpa. Comparison of band intensities for expression with only pcY (+pcY/ -Bpa lane), and with both pcY and Bpa (+pcY/ +Bpa lane) demonstrates that undesirable incorporation of pcY by MbPyl(Bpa)RS is an inefficient process and observed only in the absence of Bpa as confirmed by mass spectrometry data shown is Fig. 4c. This is consistent with data shown in Fig. 3c, Fig. 3d, and Fig. 3e. Lane marked L is the Invitrogen SeeBlue Plus2 Pre-stained Protein Standard (Catalog no. LC5925). These experiments were repeated twice with similar results. Source data
Extended Data Fig. 8
Extended Data Fig. 8. On-cell binding assay to measure the binding affinity of wt-7D12, 7D12-32pcY, 7D12-109Bpa, and 7D12-32pcY-109Bpa to EGFR expressed on A431 cells before and after irradiation with 365 nm light.
(A) These results demonstrate 7D12-32pcY-109Bpa does not bind to EGFR and the binding is restored after irradiation with 365 nm light. To ensure reproducibility, experiments were performed in triplicates represented as REP 1, REP 2 and REP 3. (B) Quantitative assessment of binding between 7D12 mutants, viz. wt-7D12, 7D12-32pcY, 7D12-109Bpa, or 7D12-32pcY-109Bpa and EGFR. Chemiluminescence intensities obtained from on-cell binding experiments shown in ‘(A)’ were quantified using CLARIOstar plate reader. For each plate the maximum value of intensity was normalized to 1 and the minimum normalized to zero. Normalization is performed to ensure that data between replicates could be compared. The normalized intensity was plotted against concentration of 7D12. The data was fitted to sigmoidal nonlinear equation using GraphPad as shown in Fig. 5b. The KD is the concentration of the 7D12, where chemiluminescence intensity is half of the maximum chemiluminescence intensity. Normalized IMAX is the maximum chemiluminescence intensity at saturation. Values shown in brackets denote the standard deviation (s.d.) from the mean value of three replicates. Source data
Extended Data Fig. 9
Extended Data Fig. 9. 7D12-32pcY-109Bpa forms a covalent bond with EGFR upon irradiation with 365 nm light.
(A) In the Coomassie stained gel image, the band higher than EGFR is photocrosslinked 7D12 + EGFR complex. This is the full gel image for data shown in Fig. 5c. Lane marked L is the Invitrogen SeeBlue Plus2 Pre-stained Protein Standard (Catalog no. LC5925). These results demonstrate that 7D12-32pcY-109Bpa and 7D12-109Bpa form covalent bond with EGFR upon irradiation with 365 nm light. No crosslinked product was observed for wt-7D12 or 7D12-32pcY. These experiments were repeated twice with similar results. (B) Percentage crosslinked product calculated by measuring the intensity of the band corresponding to 7D12 + EGFR and EGFR. Source data
Extended Data Fig. 10
Extended Data Fig. 10. Photocrosslinking of 7D12-32pcY-109Bpa to EGFR performed in DMEM media containing 10% serum.
(A) The Coomassie stained gel demonstrates successful photocrosslinking of 7D12-32pcY-109Bpa to EGFR in phosphate buffered saline (PBS). For the same reaction performed in serum containing media, bands corresponding to sEGFR and photocrosslinked product are not clear on Coomassie stained gel due to the presence of other proteins in the serum. This is the full gel image for data shown in Fig. 5d. Lane marked L is the Invitrogen SeeBlue Plus2 Pre-stained Protein Standard (Catalog no. LC5925). These experiments were repeated twice with similar results. (B) The anti-His6 antibody western blot detects the C-terminal His6 tag on 7D12-32pcY-109Bpa. The photocrosslinked product, 7D12+ EGFR (top band in the blot) appears in lanes where 7D12-32pcY-109Bpa/ sEGFR in PBS or in serum containing media are irradiated with 365 nm light, demonstrating successful photocrosslinking under both conditions. The lower band corresponds to 7D12-32pcY-109Bpa/ 7D12-109Bpa and serves as a control demonstrating detection 7D12-32pcY-109Bpa/ 7D12-109Bpa in all samples. The image was acquired using GE ImageQuant™ LAS 4000 gel imager. This is the full gel image for data shown in Fig. 5d. Lane marked L is the Invitrogen SeeBlue Plus2 Pre-stained Protein Standard (Catalog no. LC5925). These experiments were repeated twice with similar results. Source data

References

    1. Reverberi R, Reverberi L. Factors affecting the antigen-antibody reaction. Blood Transfus. 2007;5:227–240. - PMC - PubMed
    1. Chmura AJ, Orton MS, Meares CF. Antibodies with infinite affinity. Proc. Natl Acad. Sci. USA. 2001;98:8480–8484. doi: 10.1073/pnas.151260298. - DOI - PMC - PubMed
    1. Jovcevska I, Muyldermans S. The therapeutic potential of nanobodies. BioDrugs. 2020;34:11–26. doi: 10.1007/s40259-019-00392-z. - DOI - PMC - PubMed
    1. Scott AM, Wolchok JD, Old LJ. Antibody therapy of cancer. Nat. Rev. Cancer. 2012;12:278–287. doi: 10.1038/nrc3236. - DOI - PubMed
    1. Thurber GM, Dane K. Wittrup, a mechanistic compartmental model for total antibody uptake in tumors. J. Theor. Biol. 2012;314:57–68. doi: 10.1016/j.jtbi.2012.08.034. - DOI - PMC - PubMed

Publication types