. 2023 Mar;5(3):431-444.
doi: 10.1038/s42255-023-00736-8. Epub 2023 Feb 16.

PFKFB2-mediated glycolysis promotes lactate-driven continual efferocytosis by macrophages

Affiliations

PFKFB2-mediated glycolysis promotes lactate-driven continual efferocytosis by macrophages

Maaike Schilperoort et al. Nat Metab. 2023 Mar.

Abstract

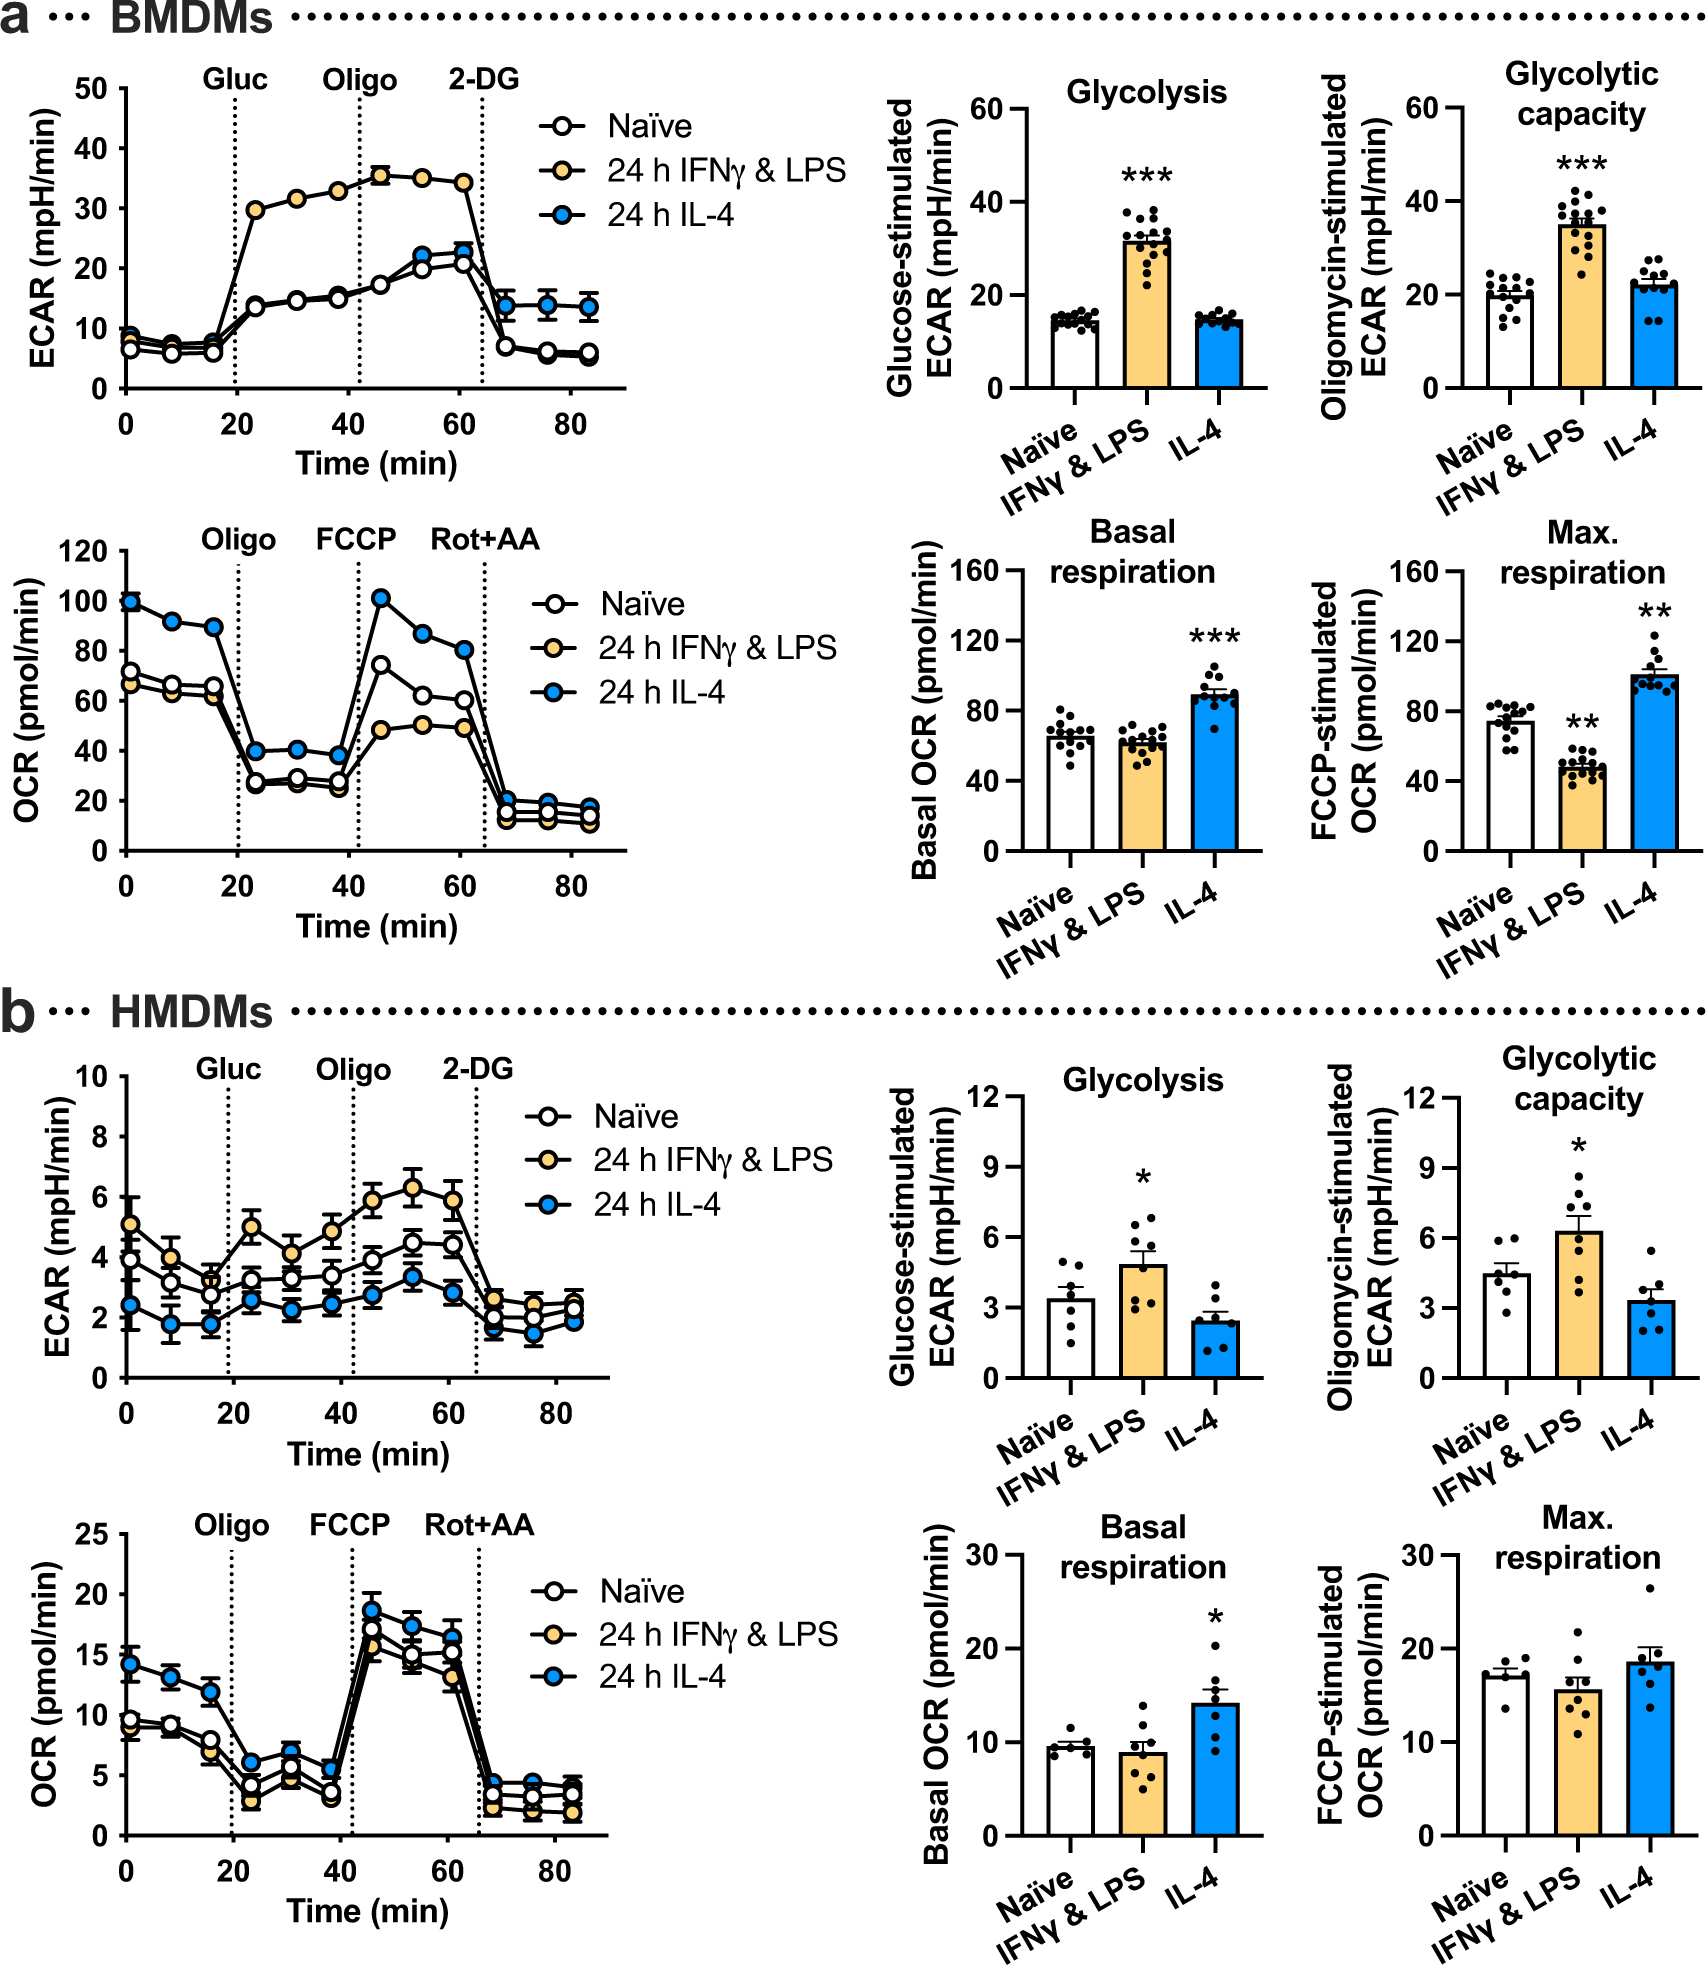
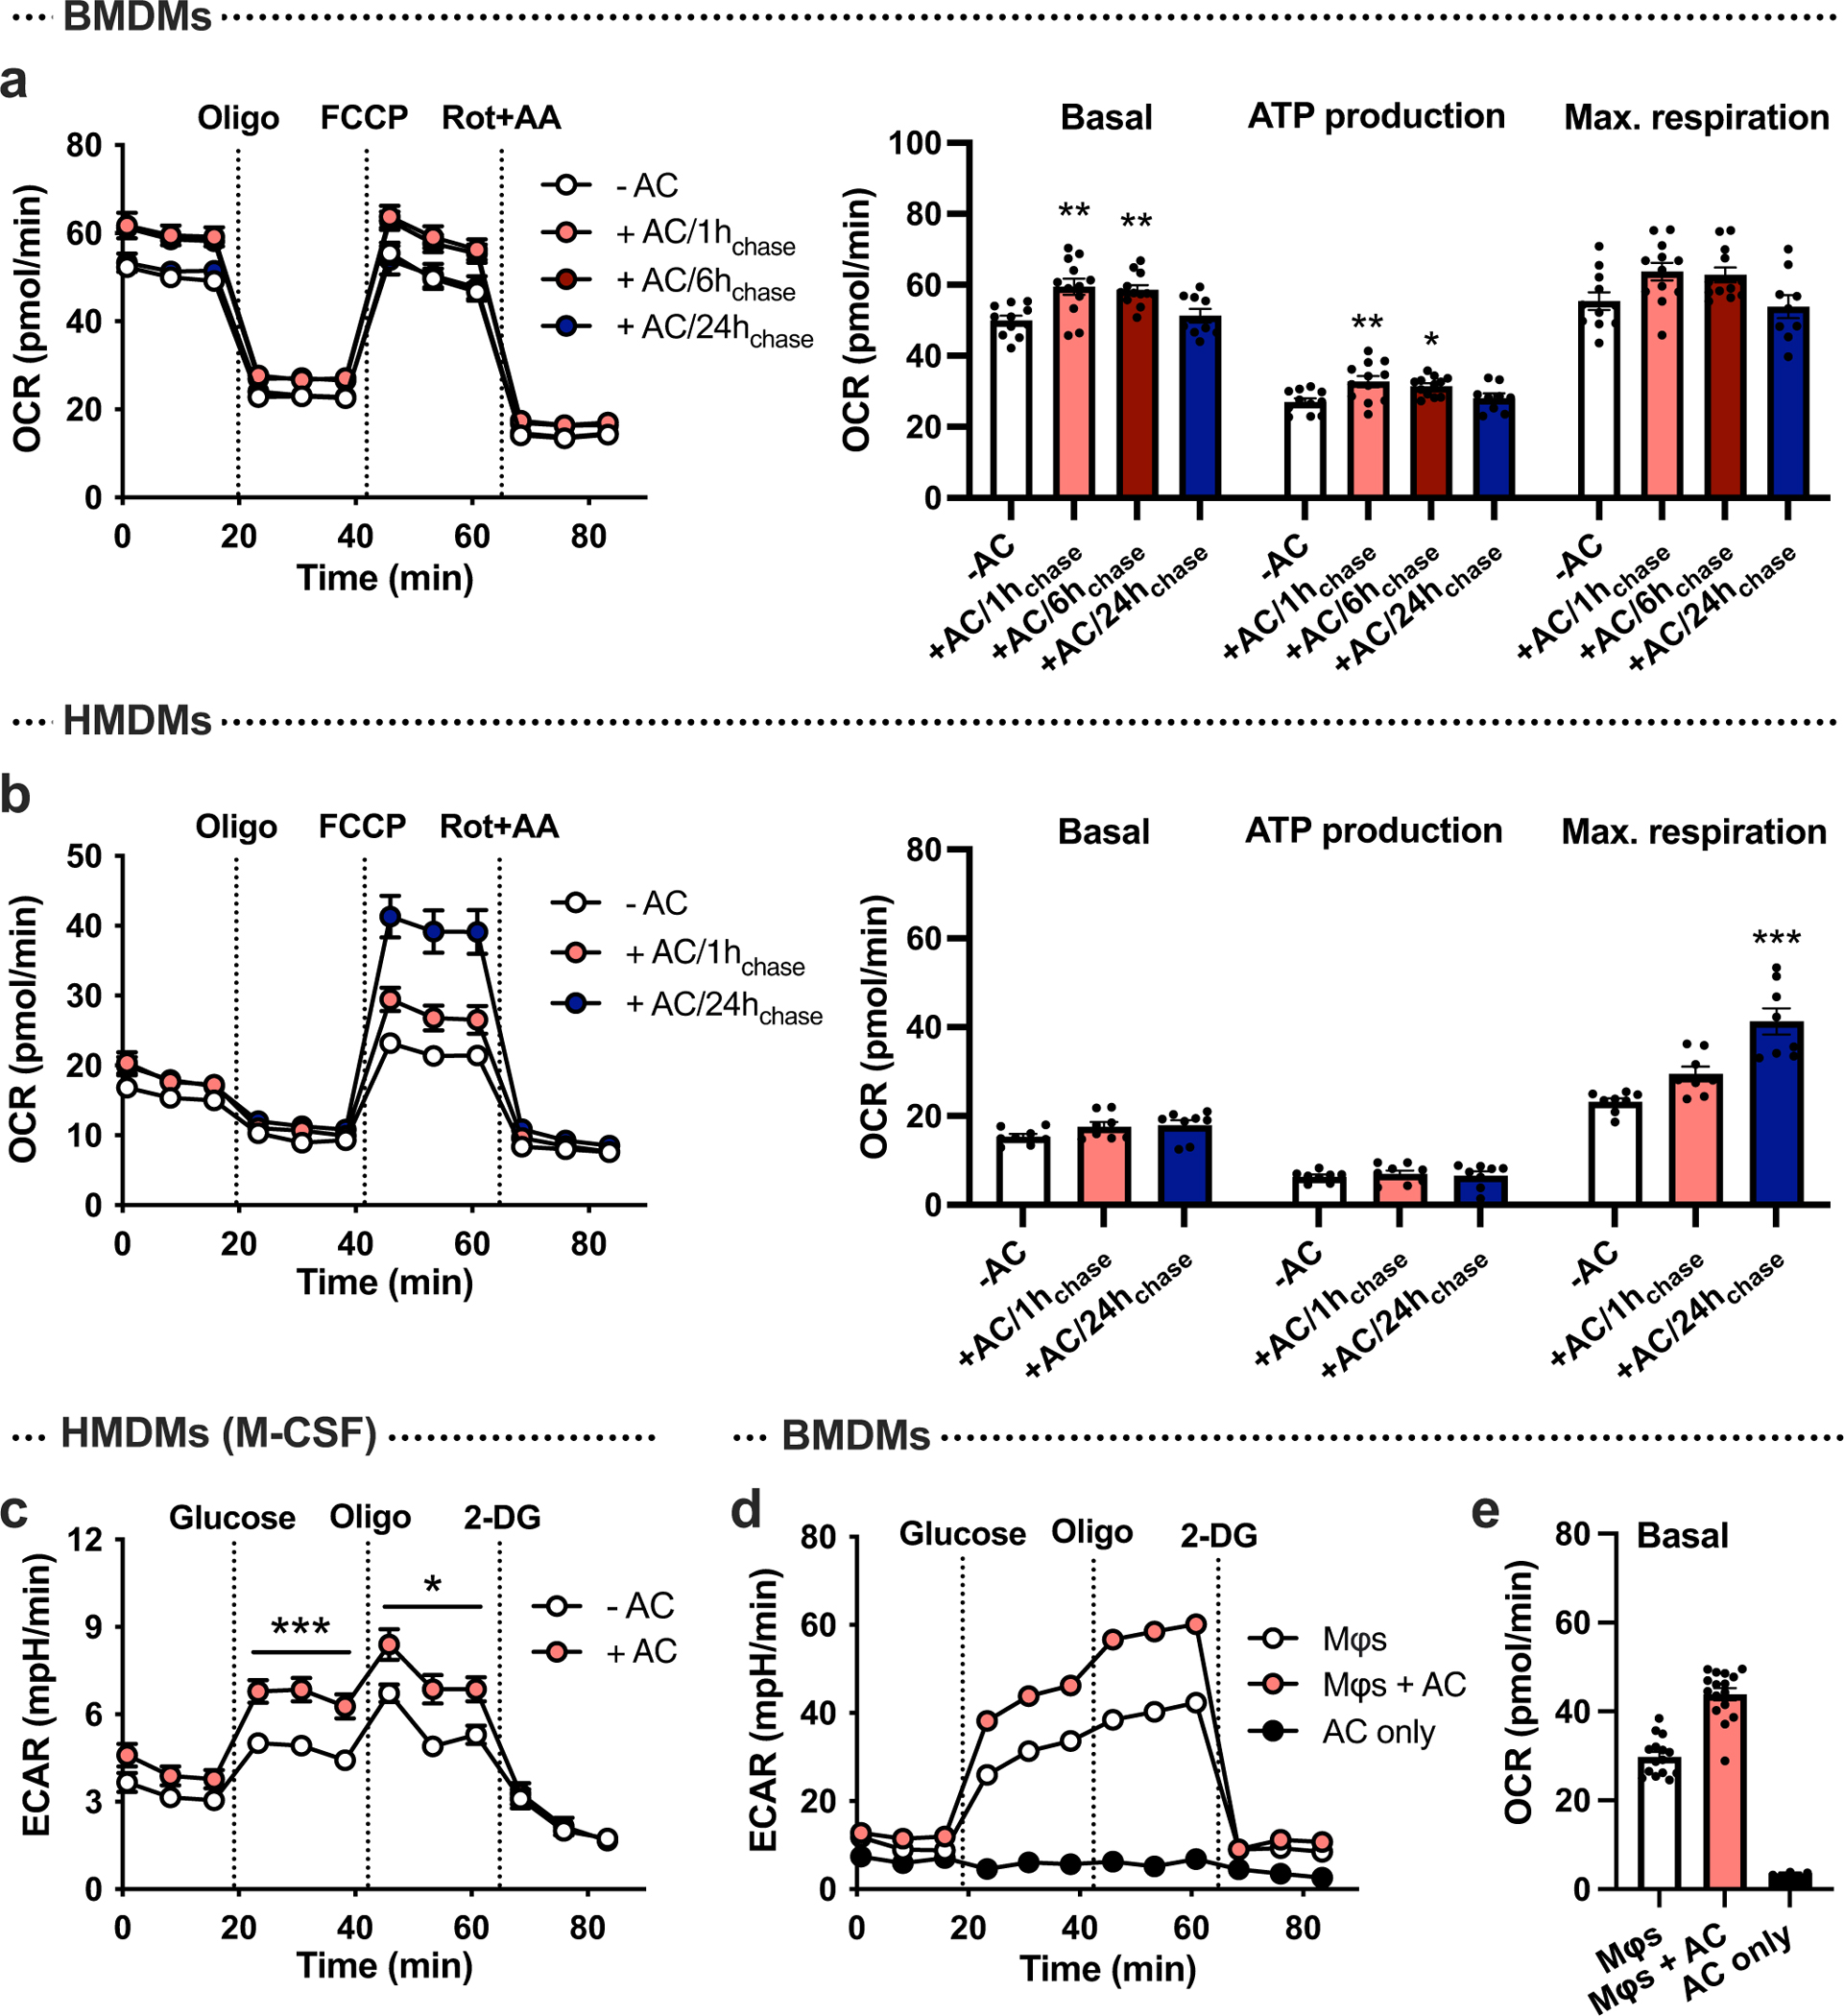
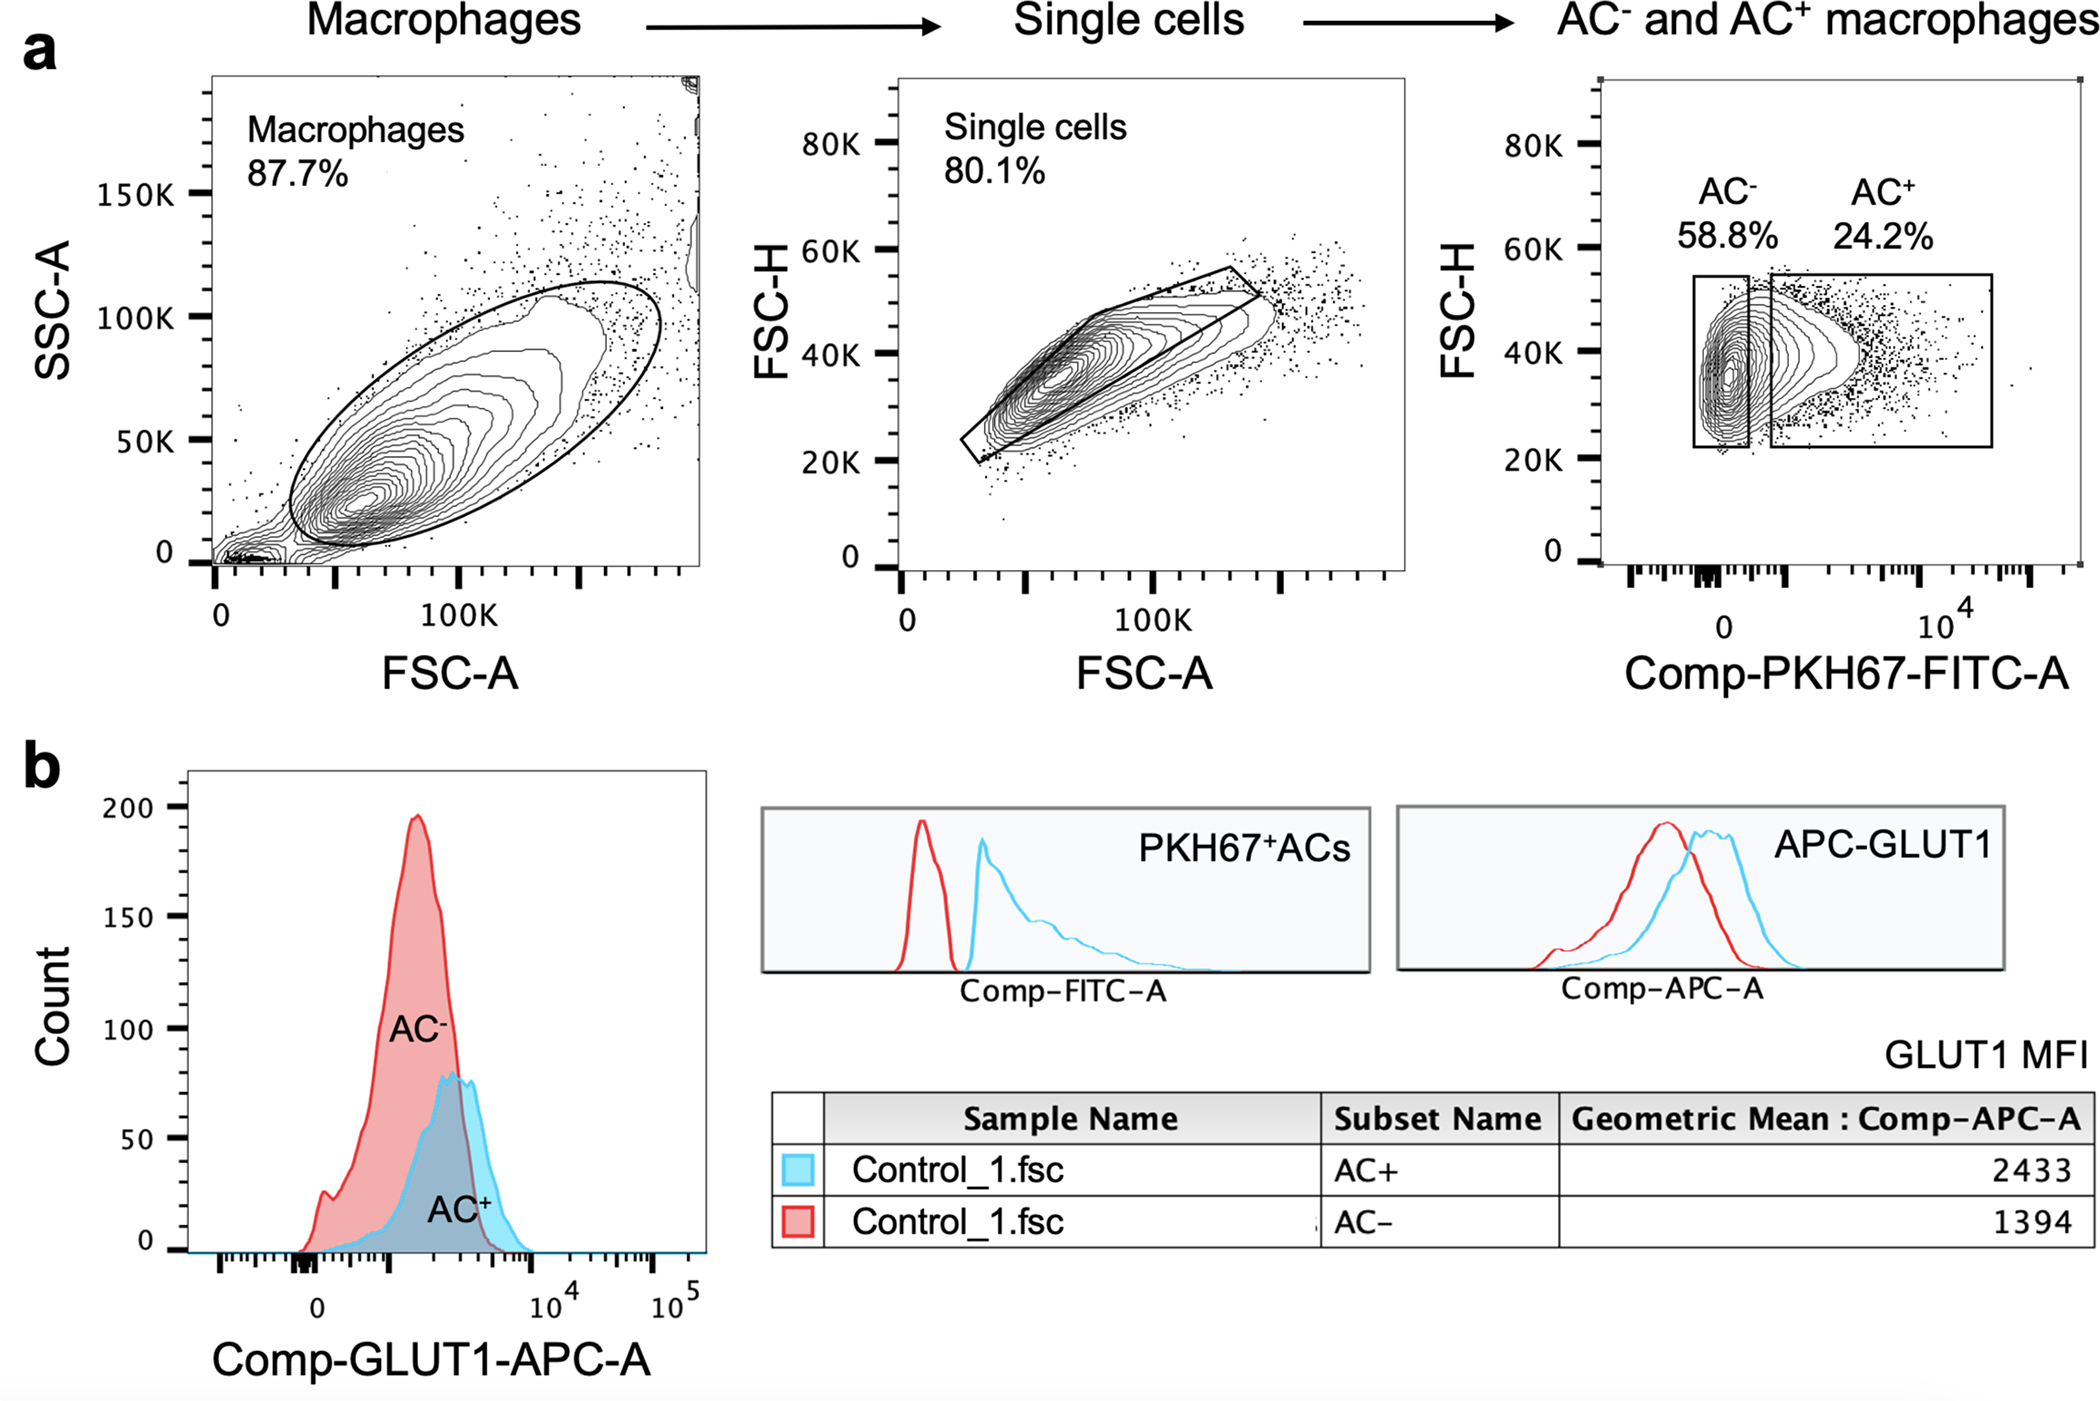
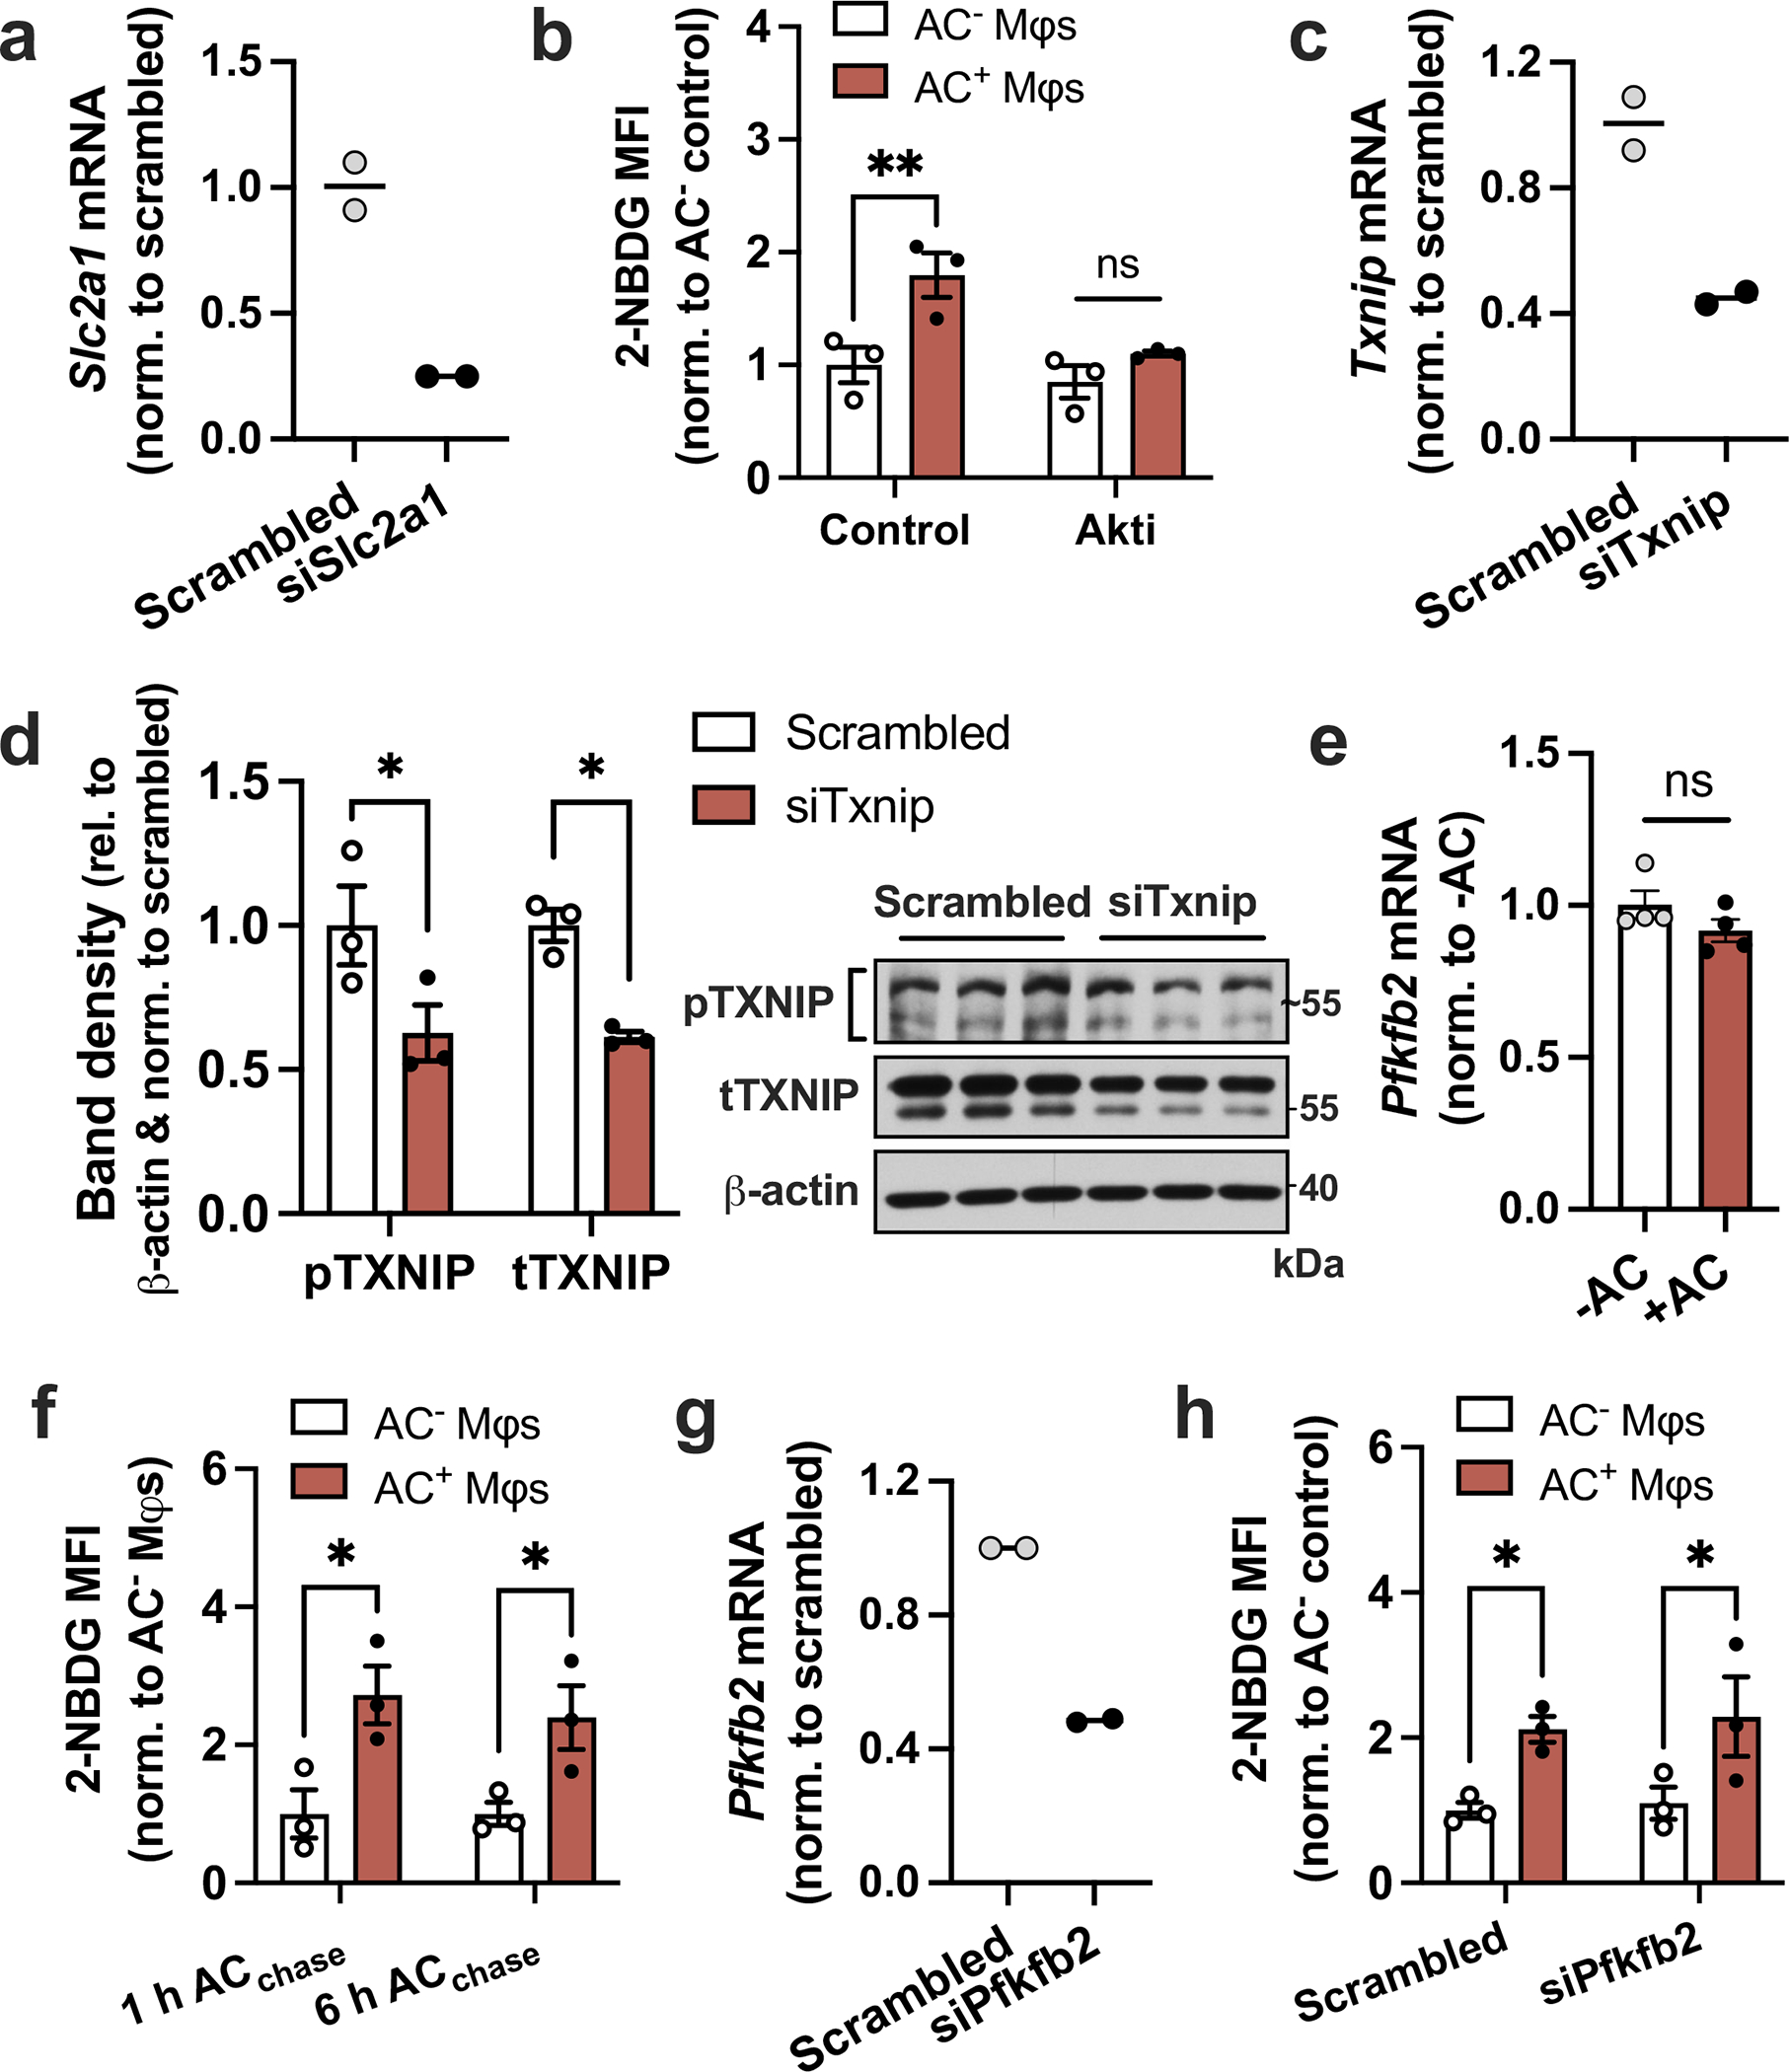
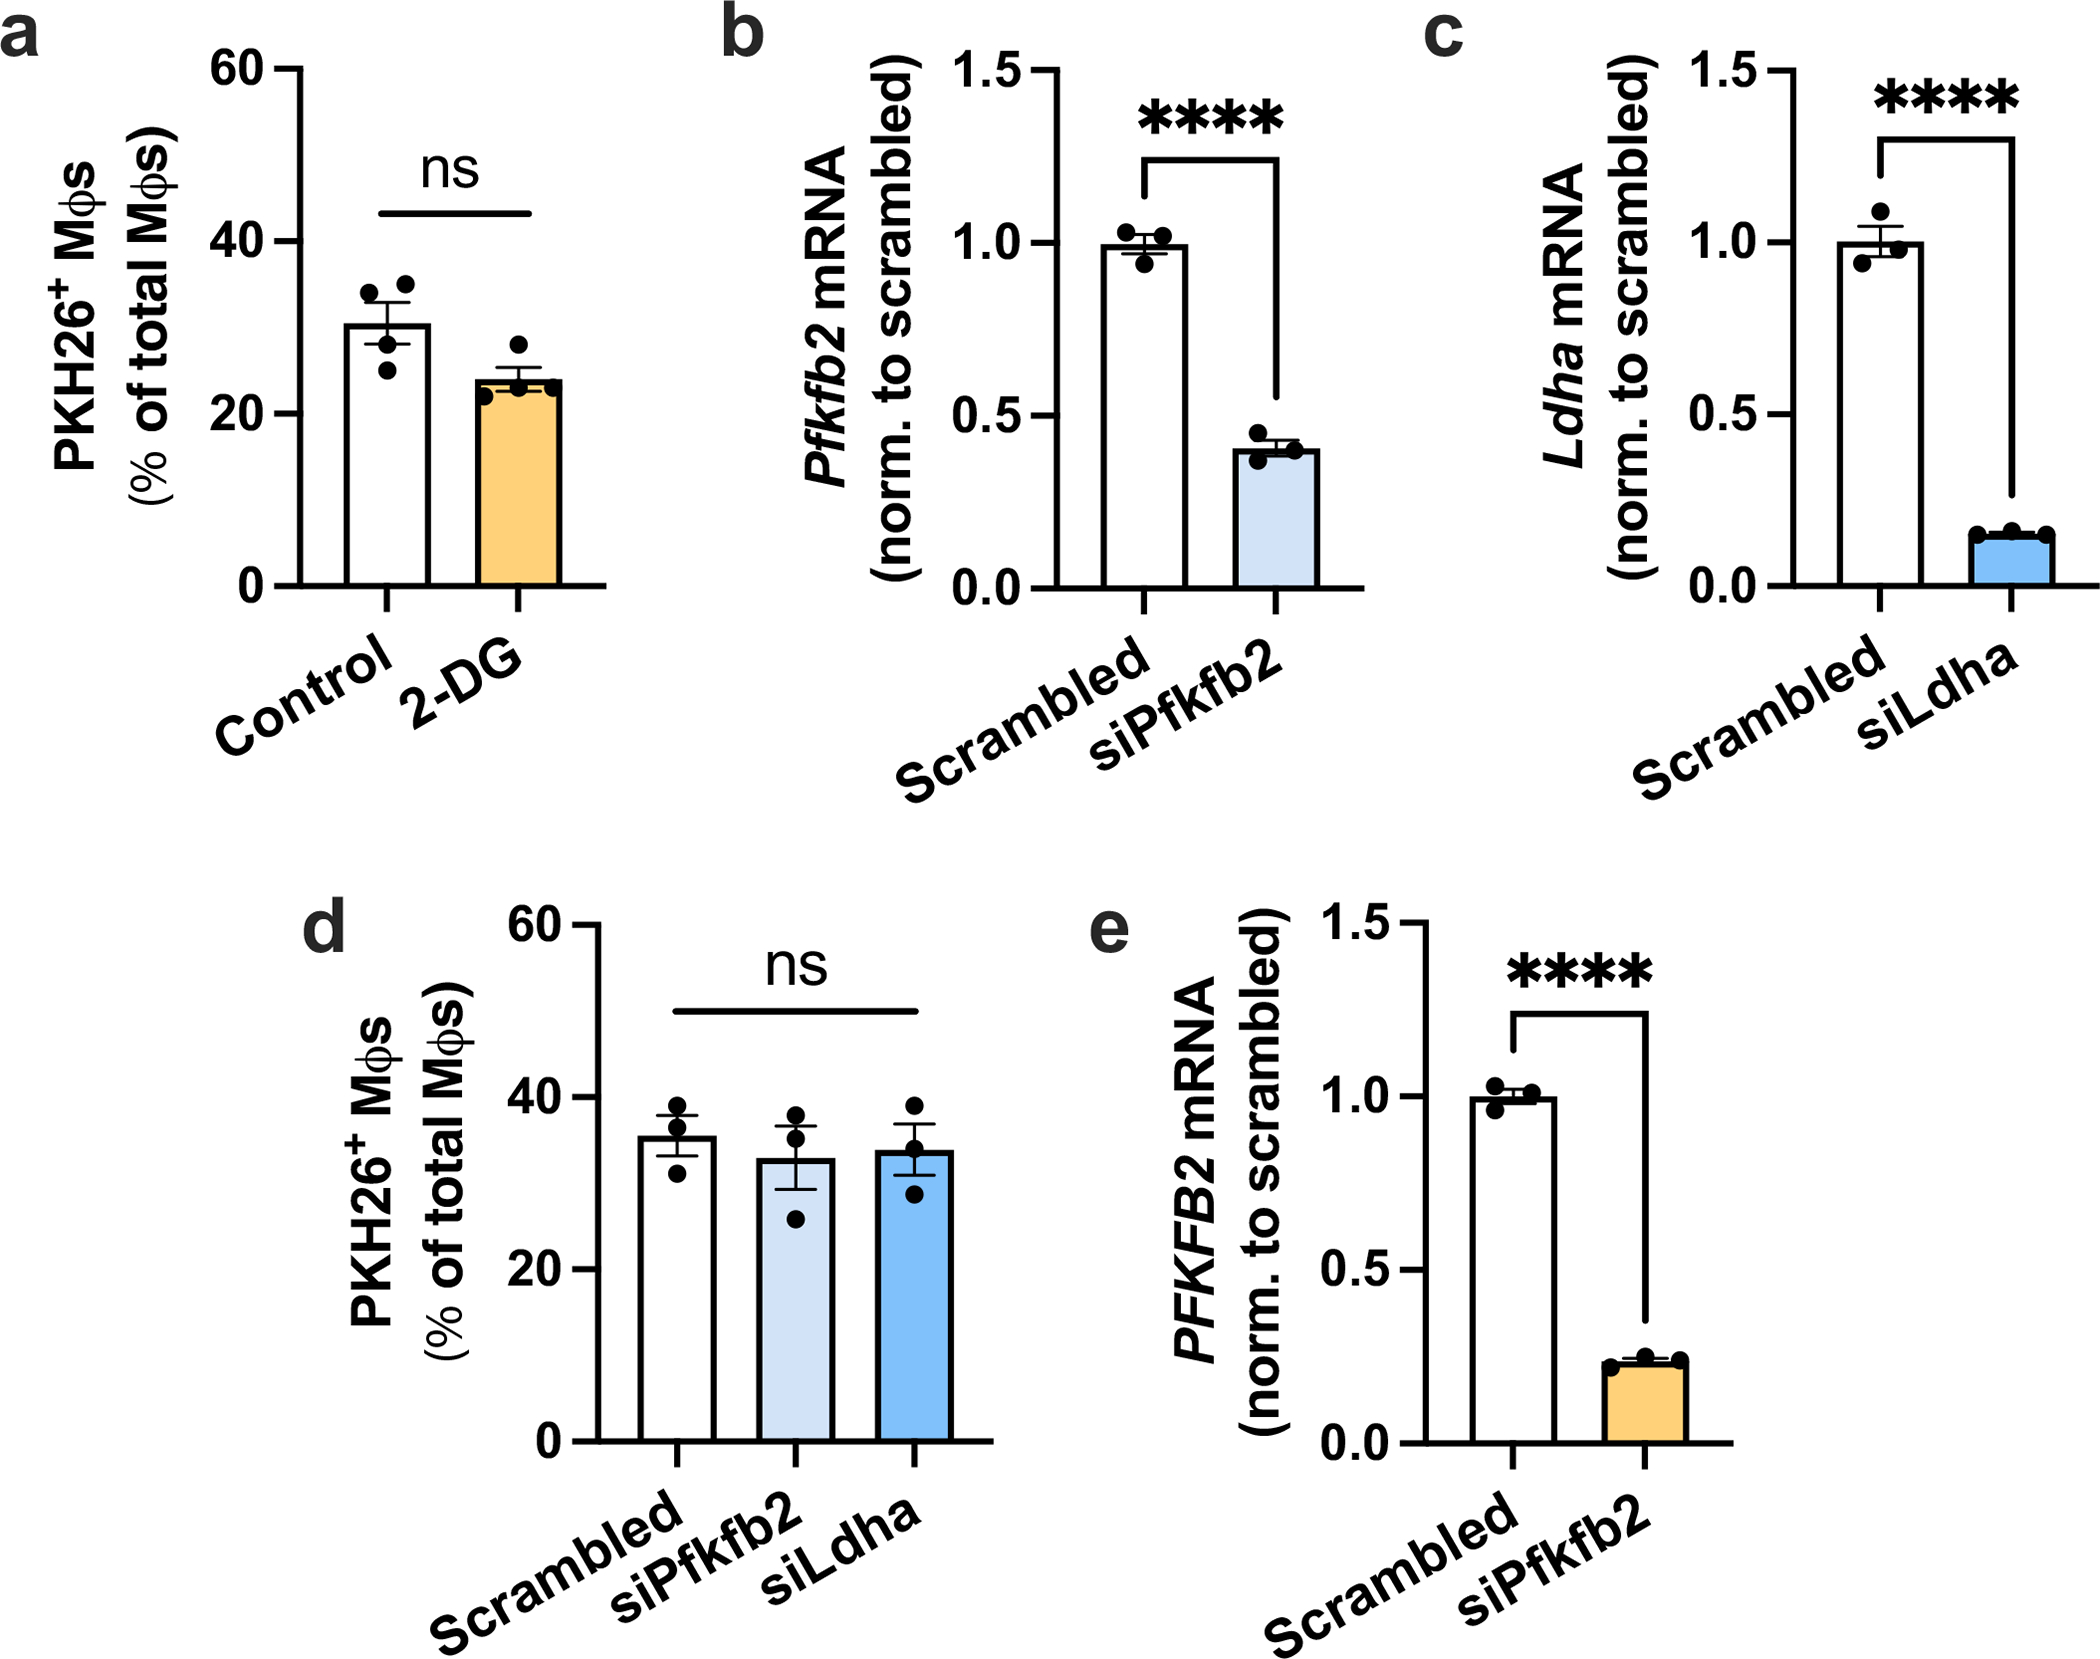
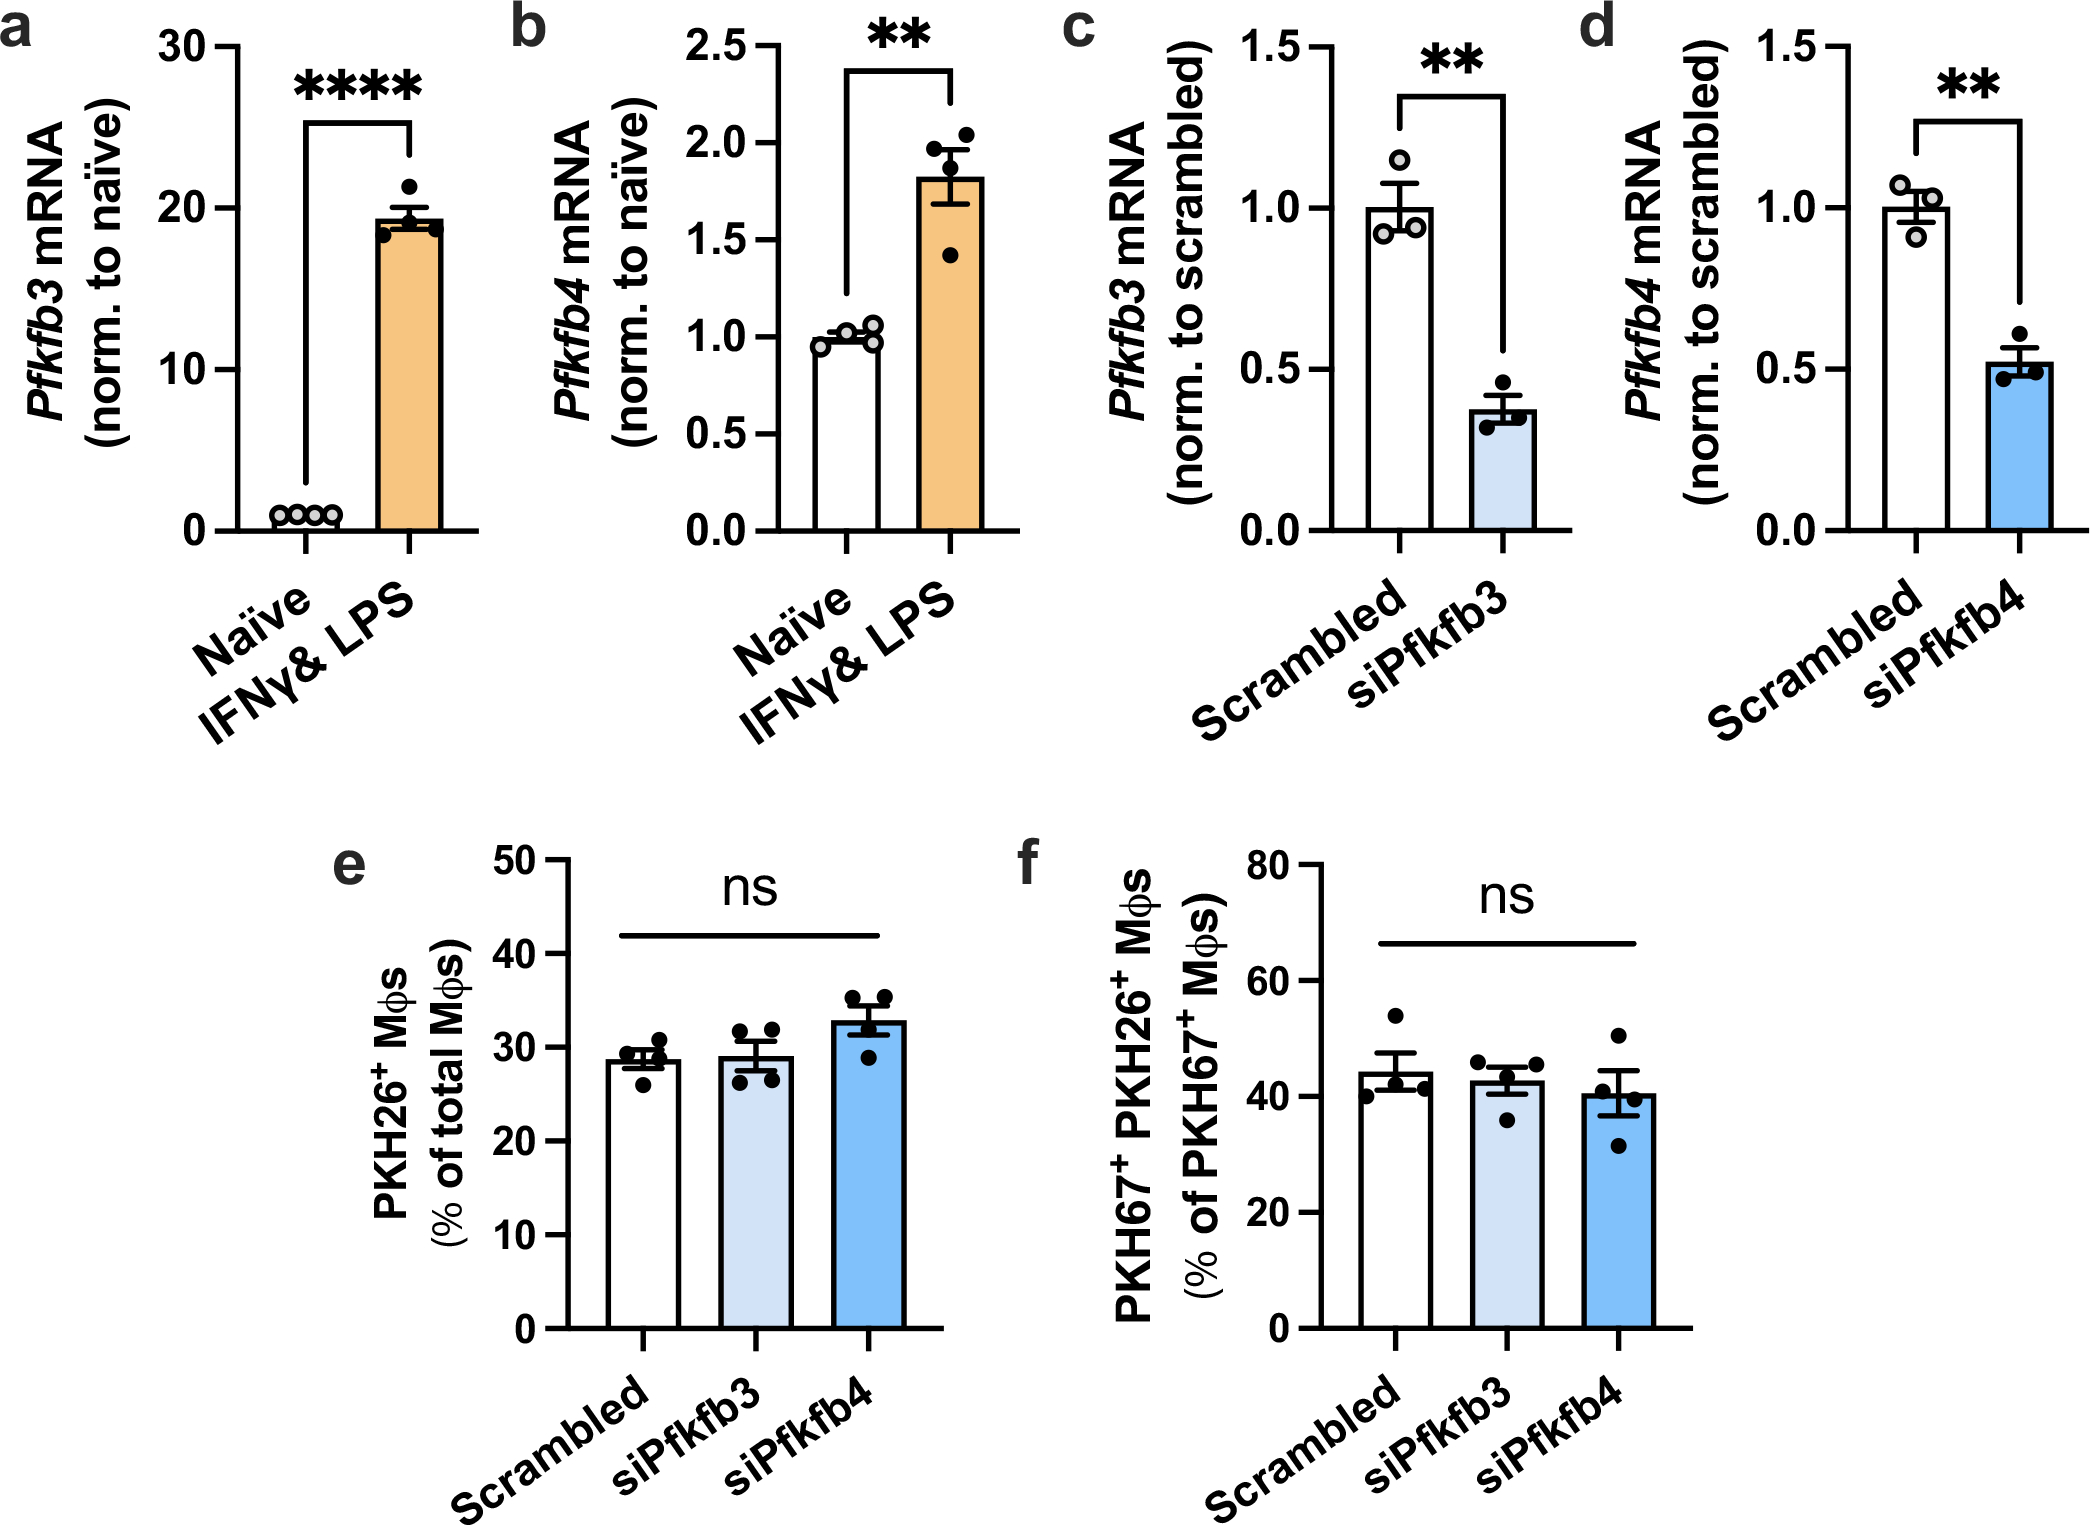
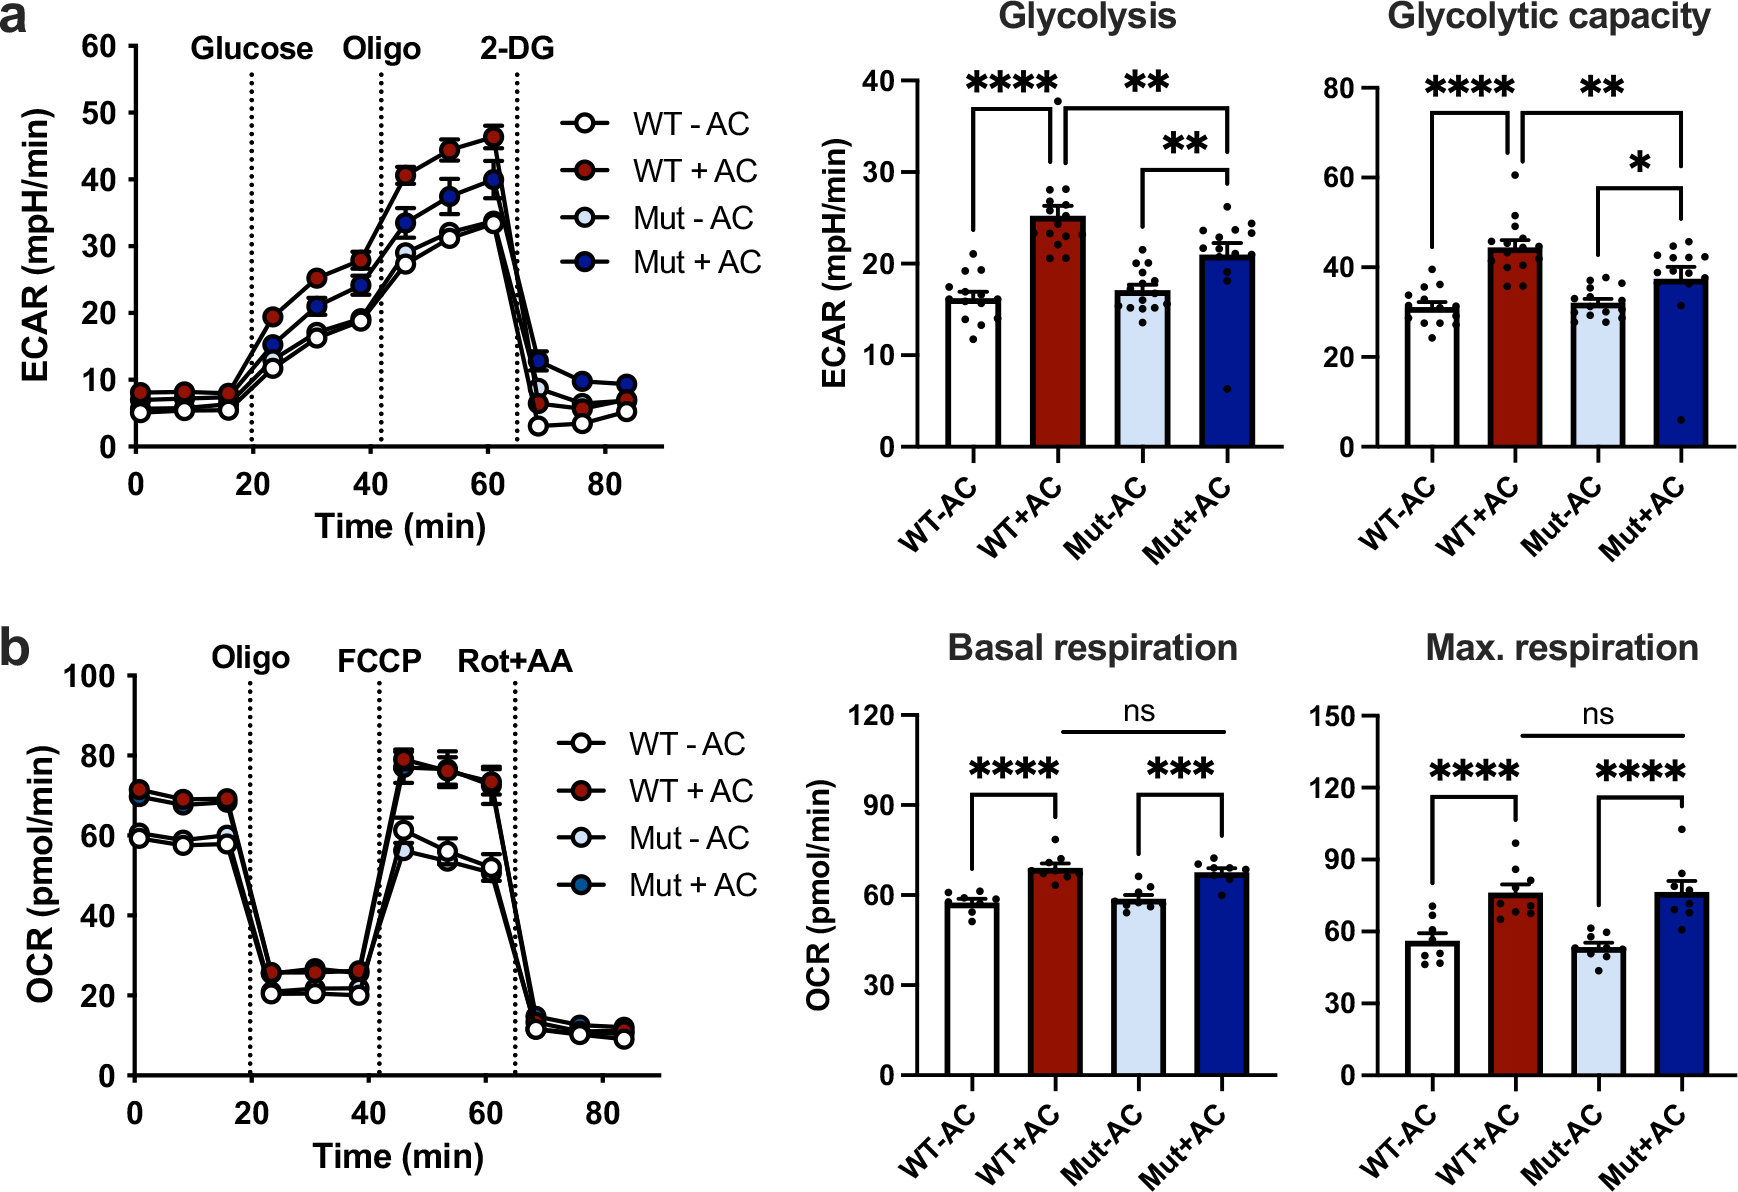
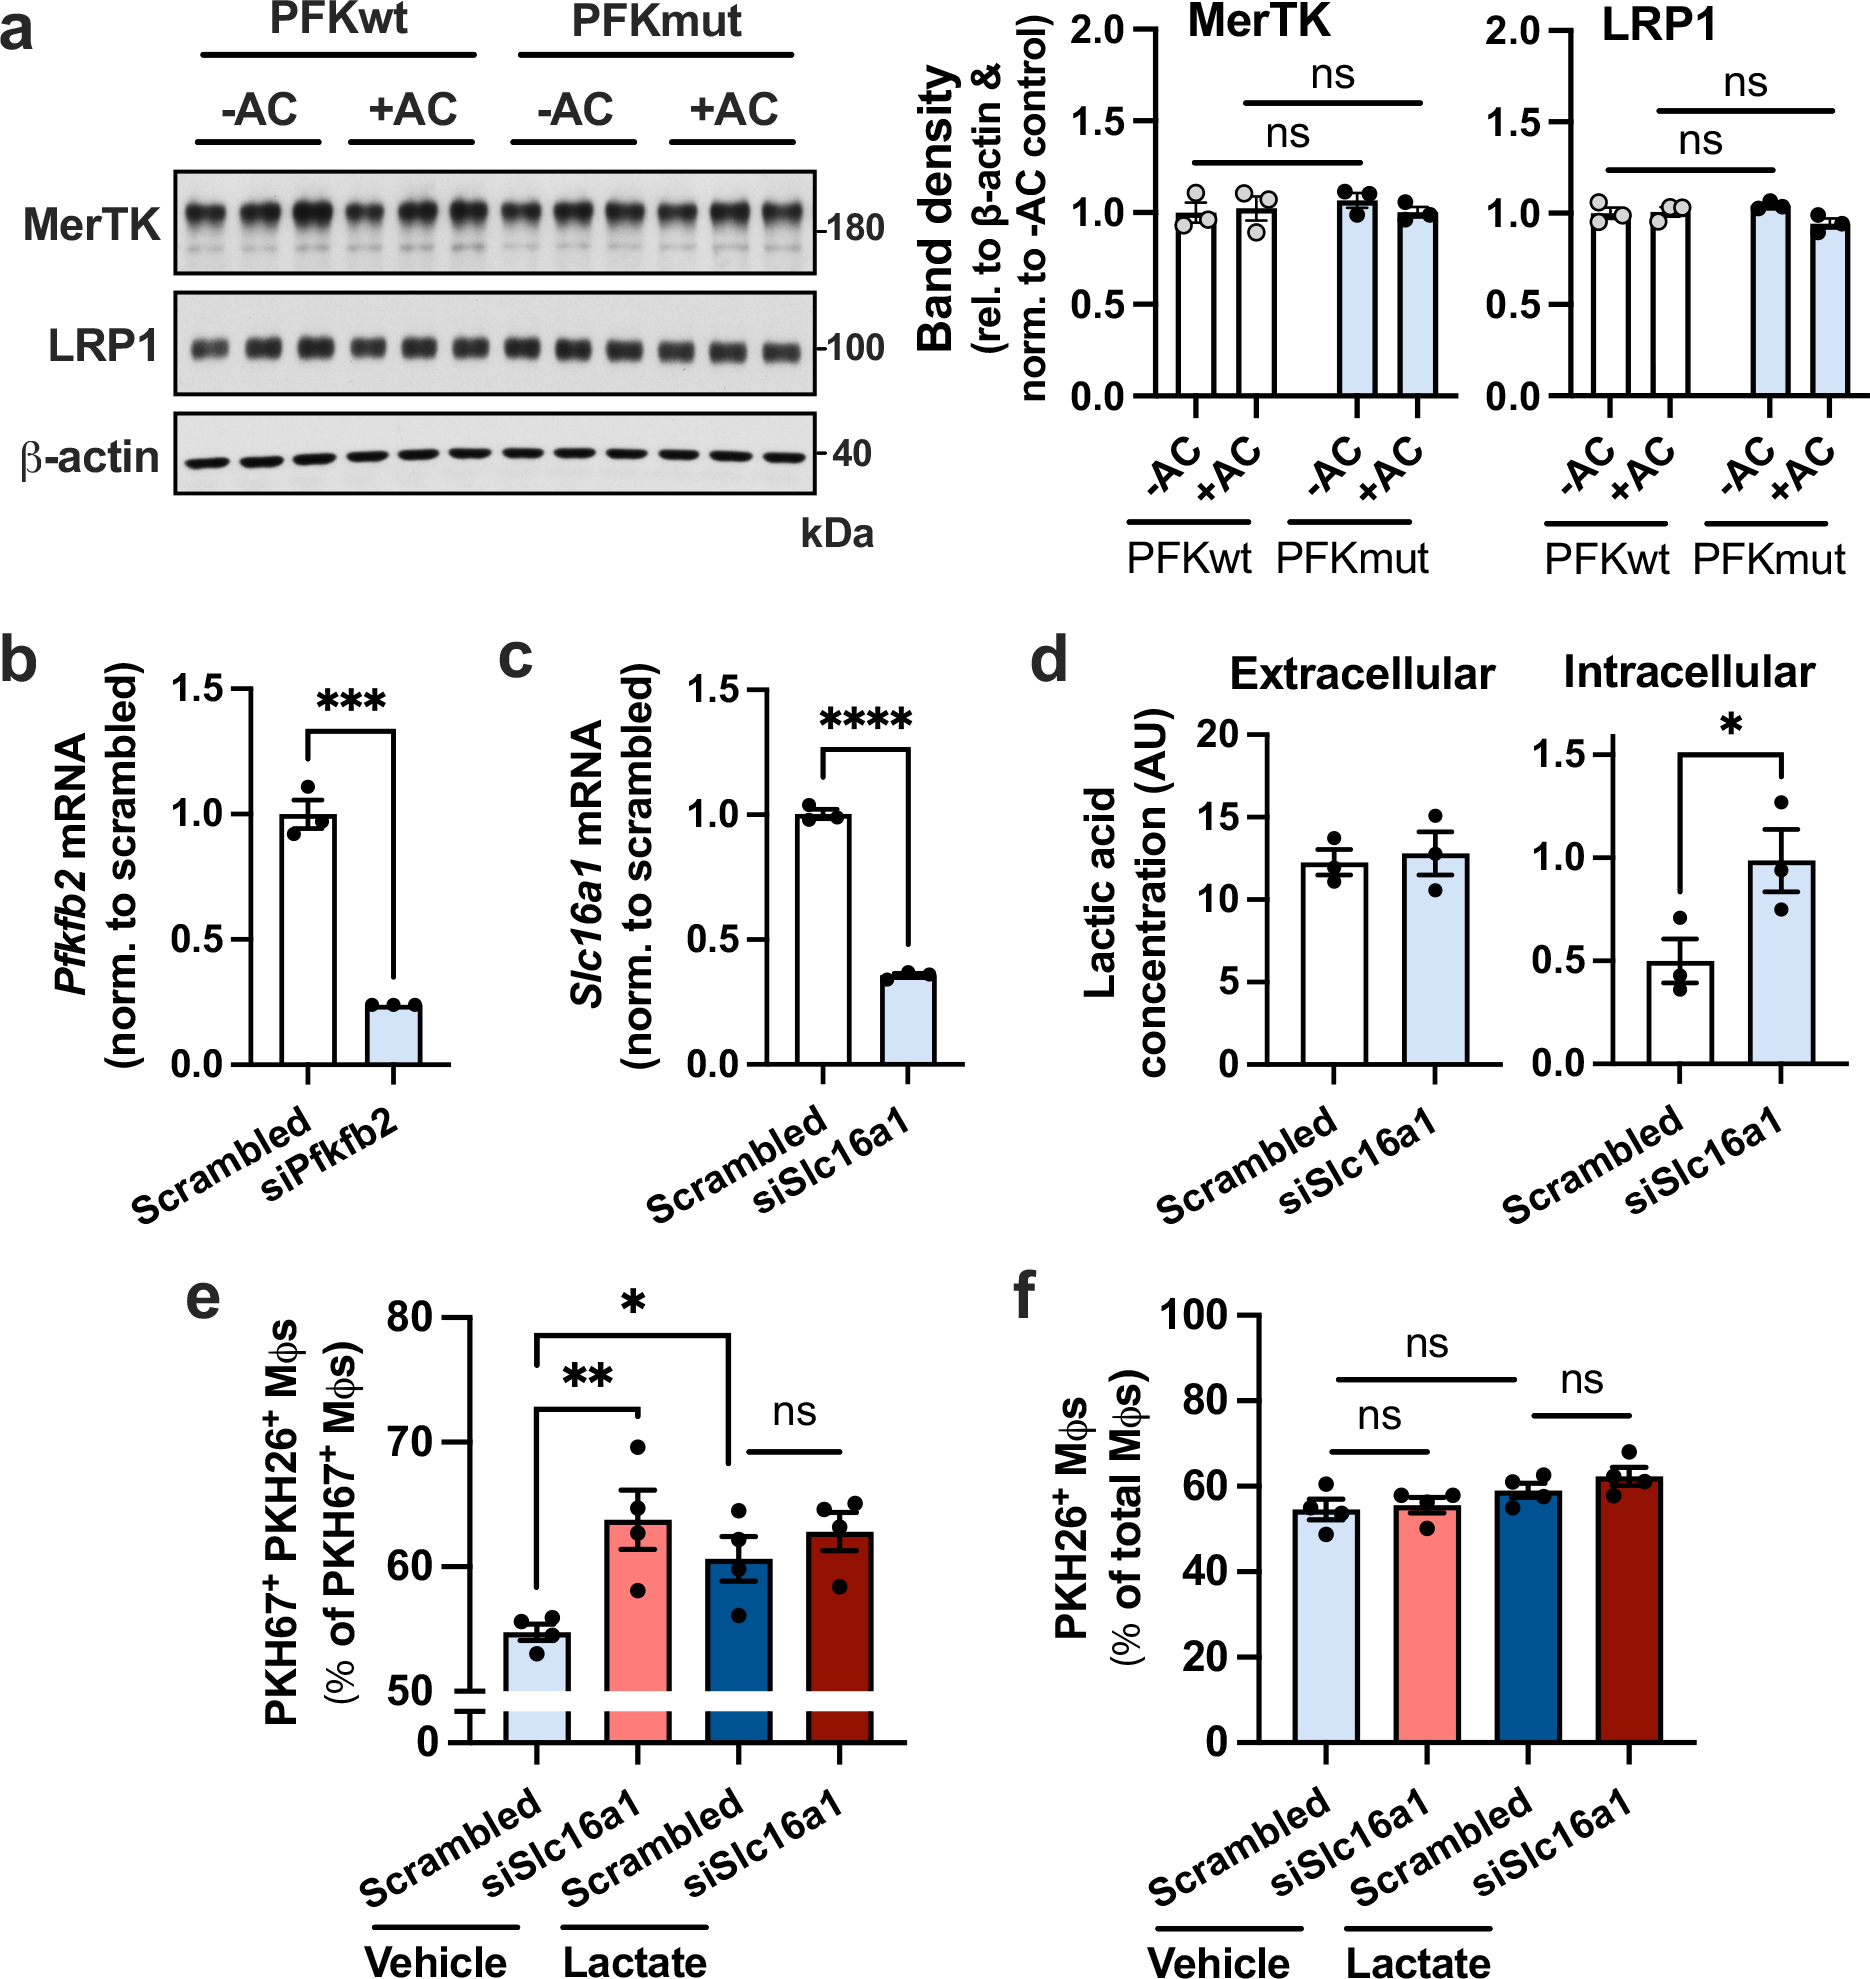
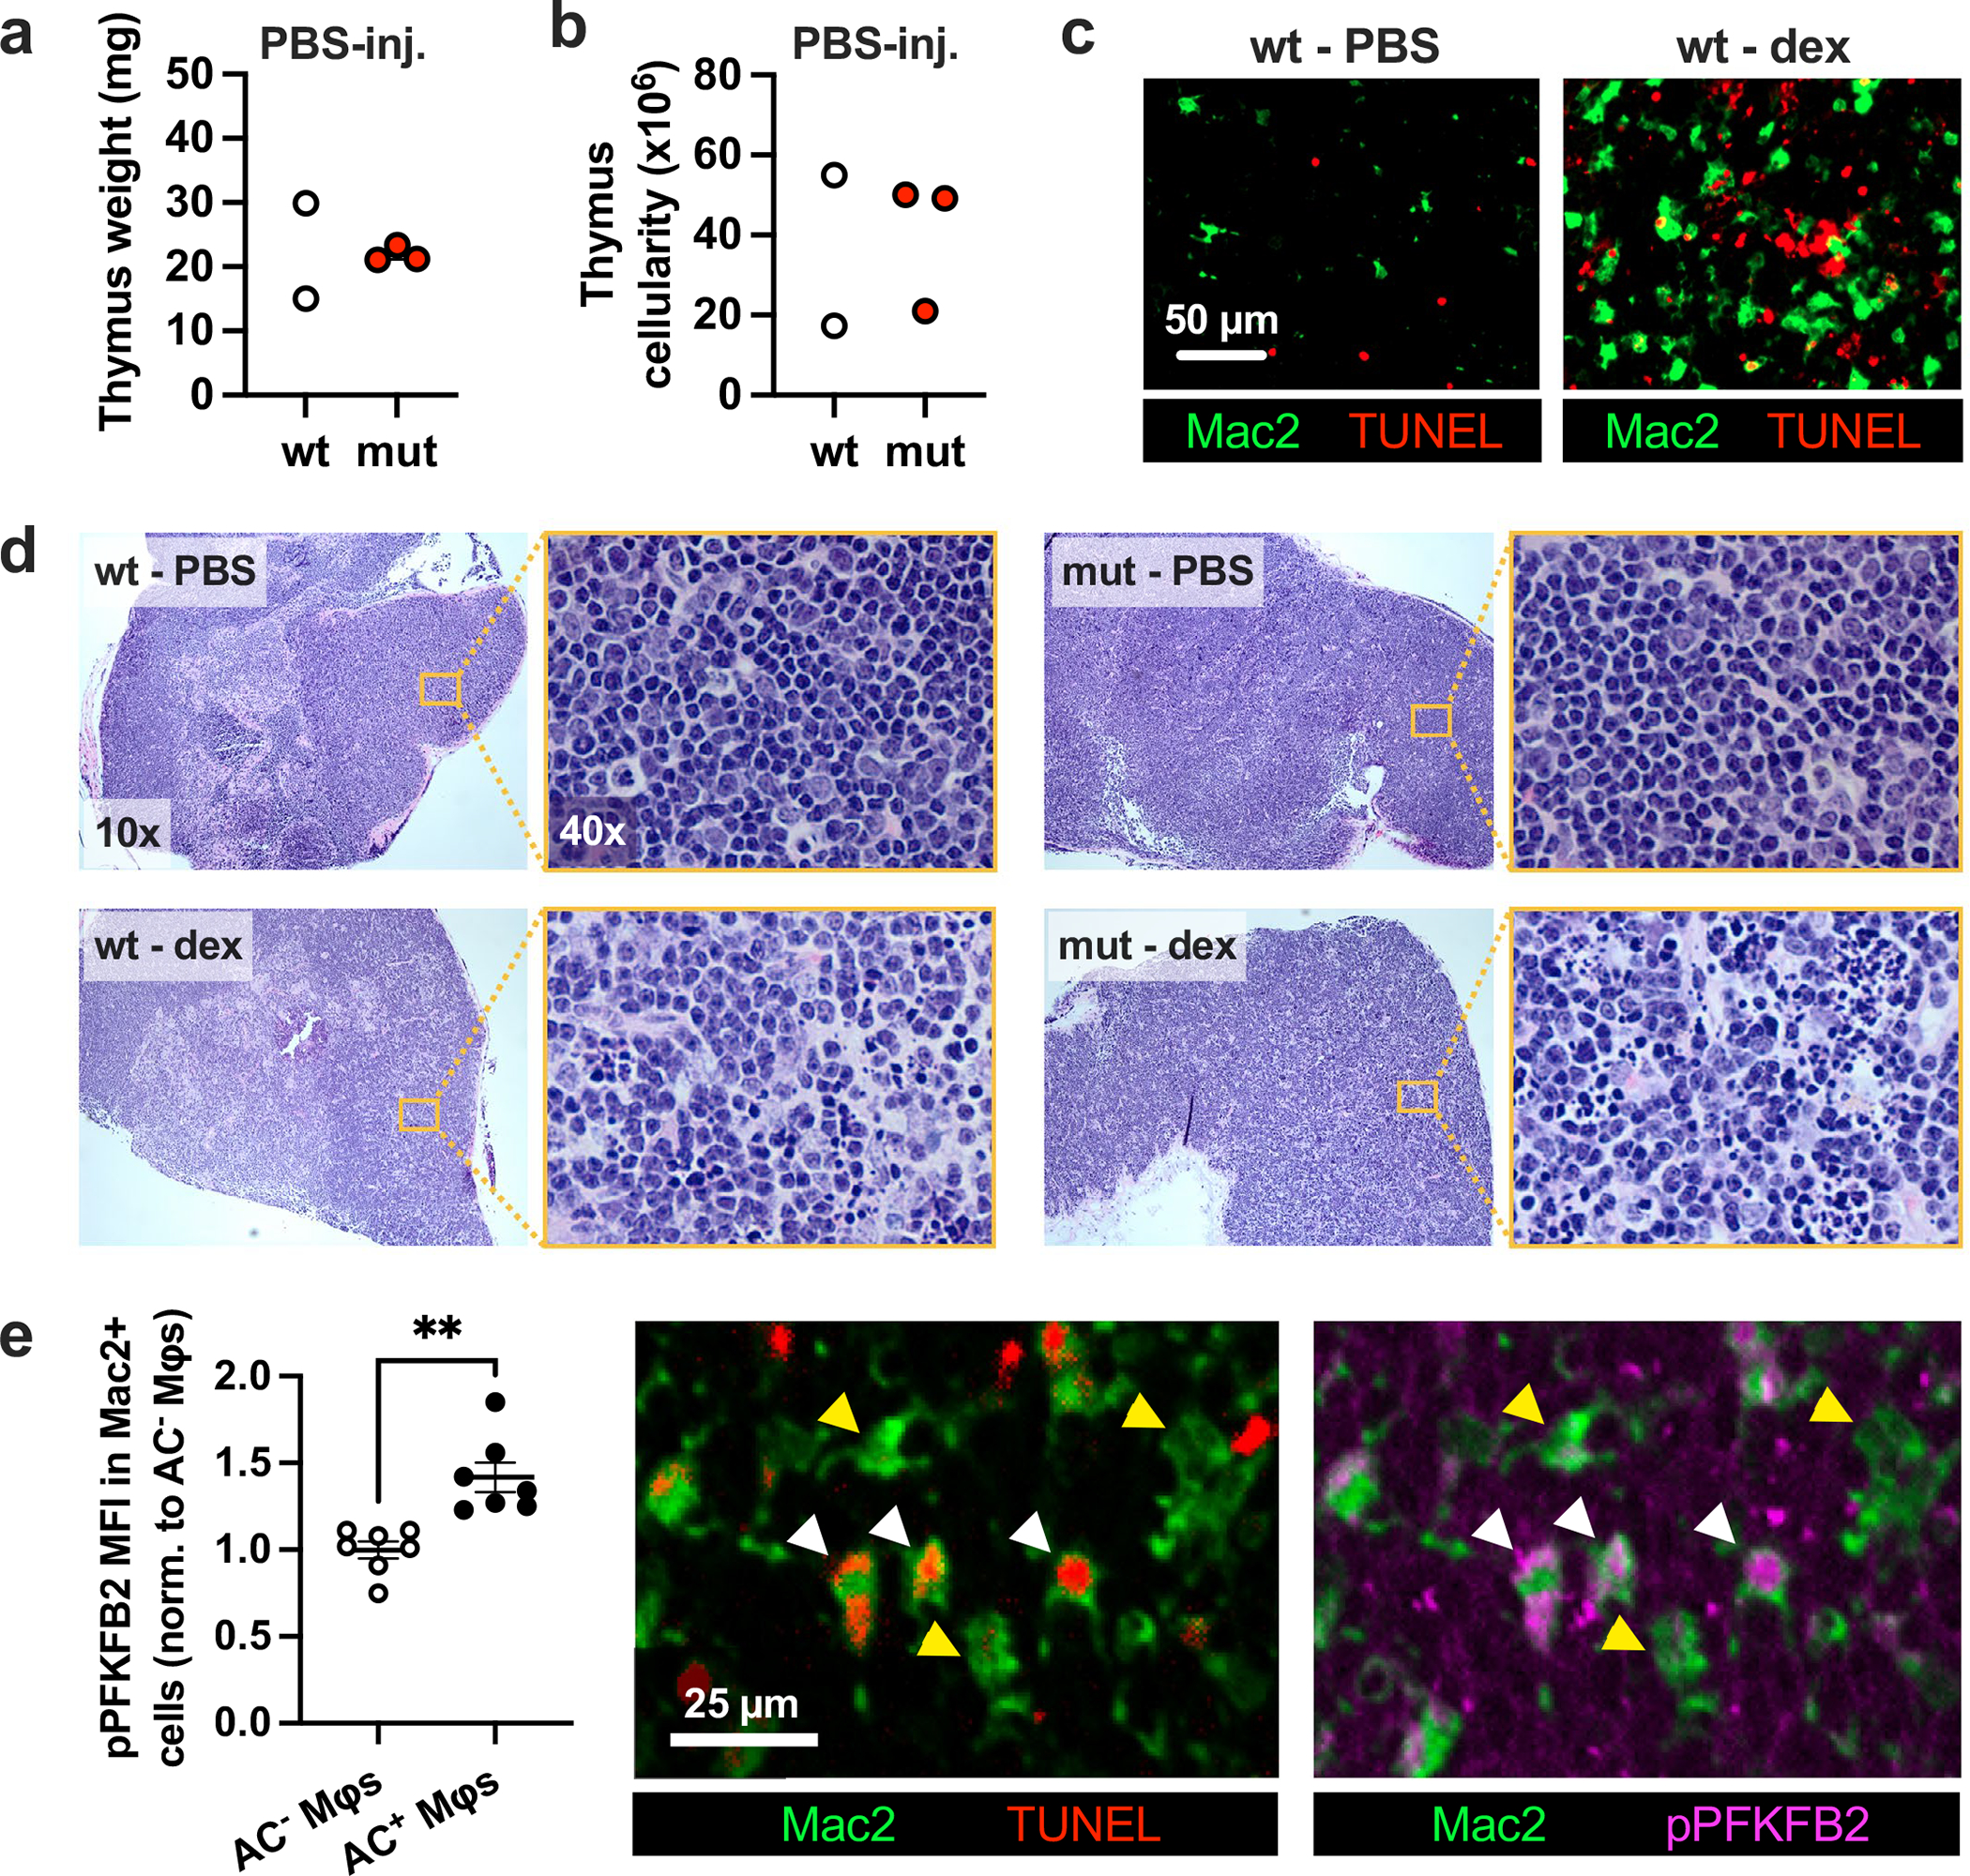
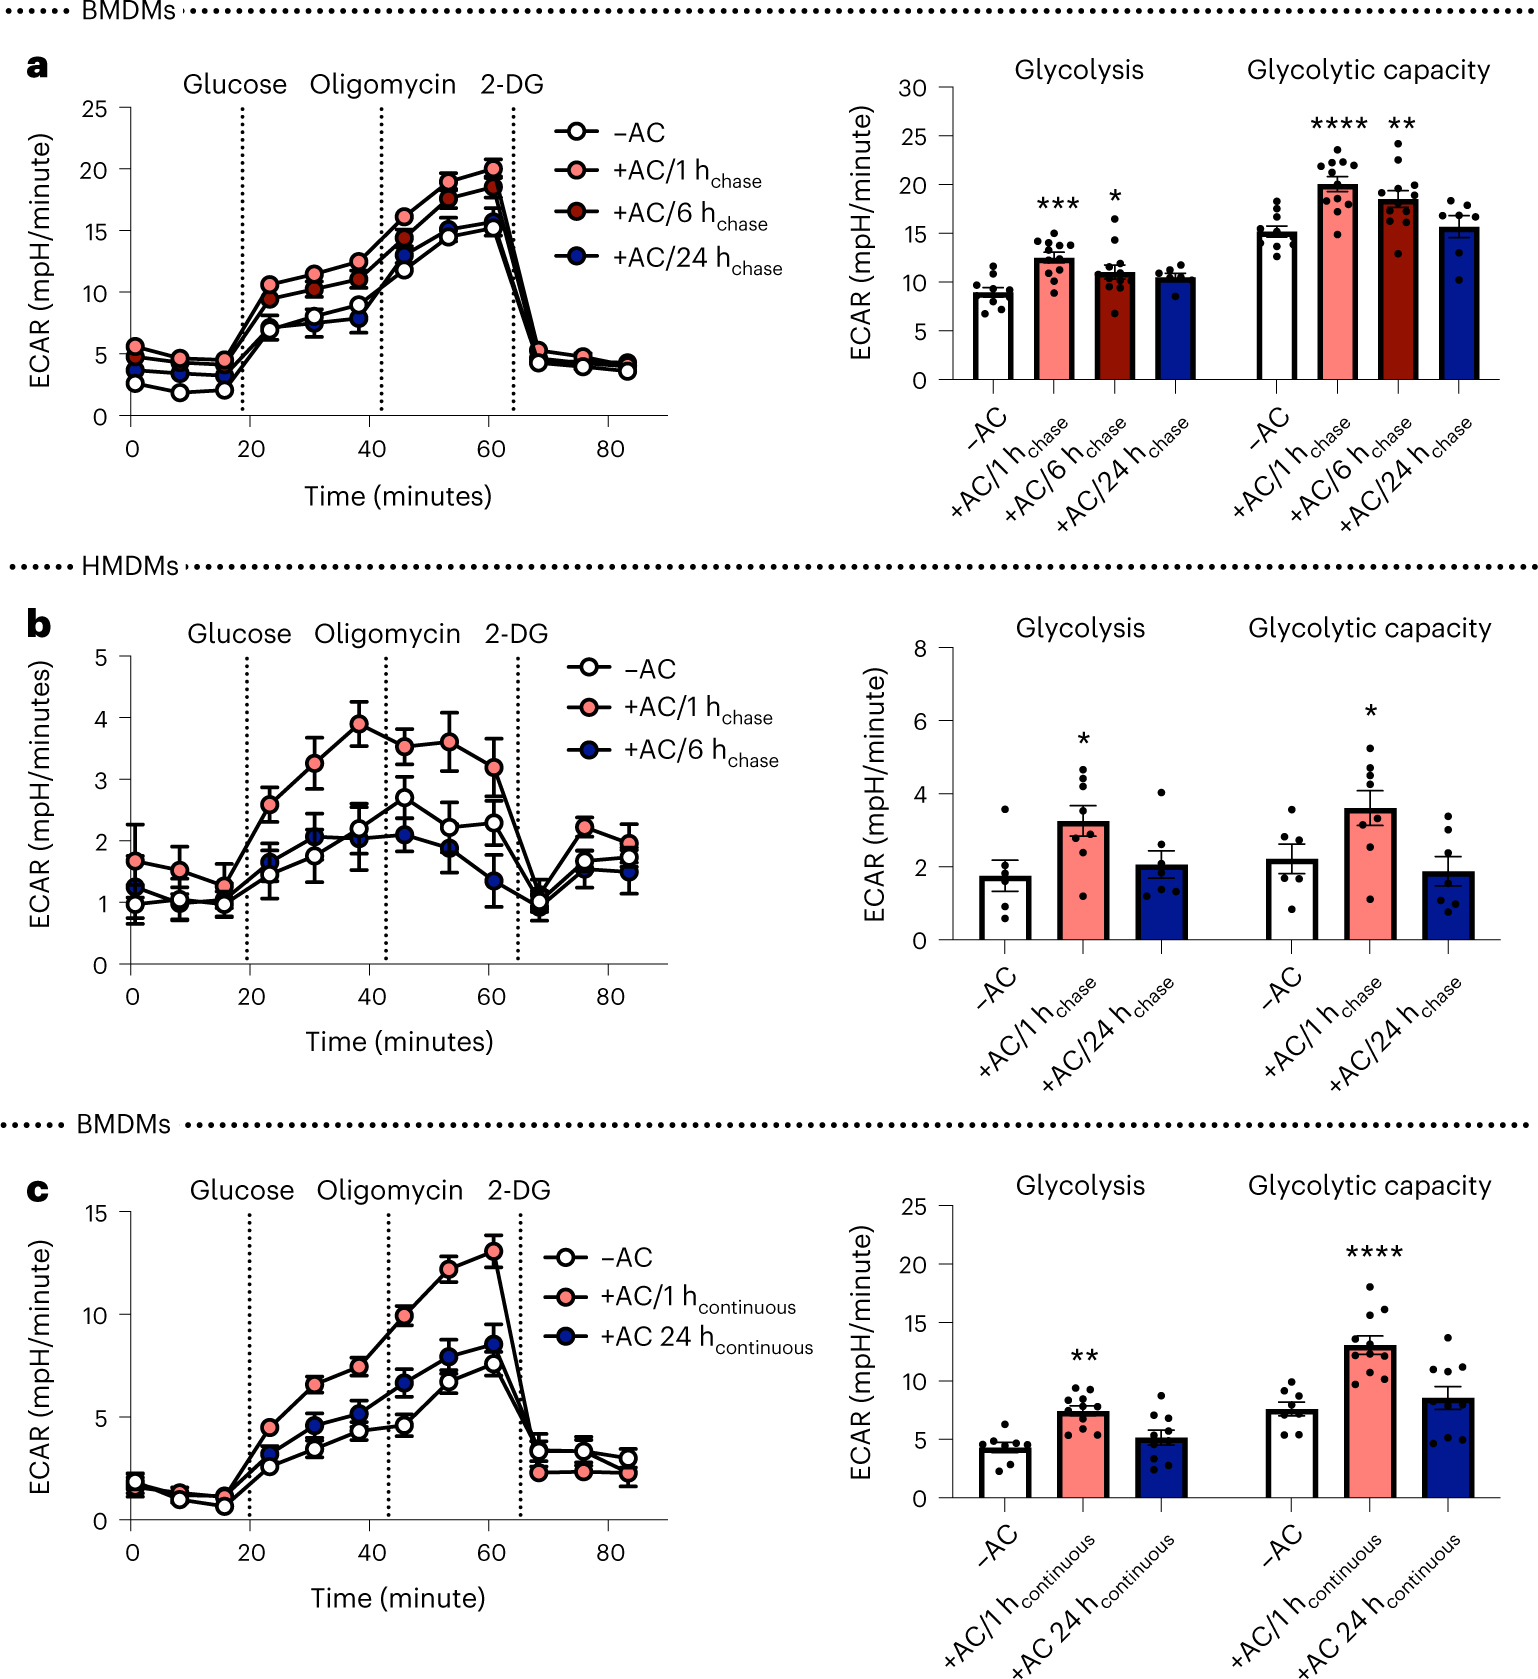
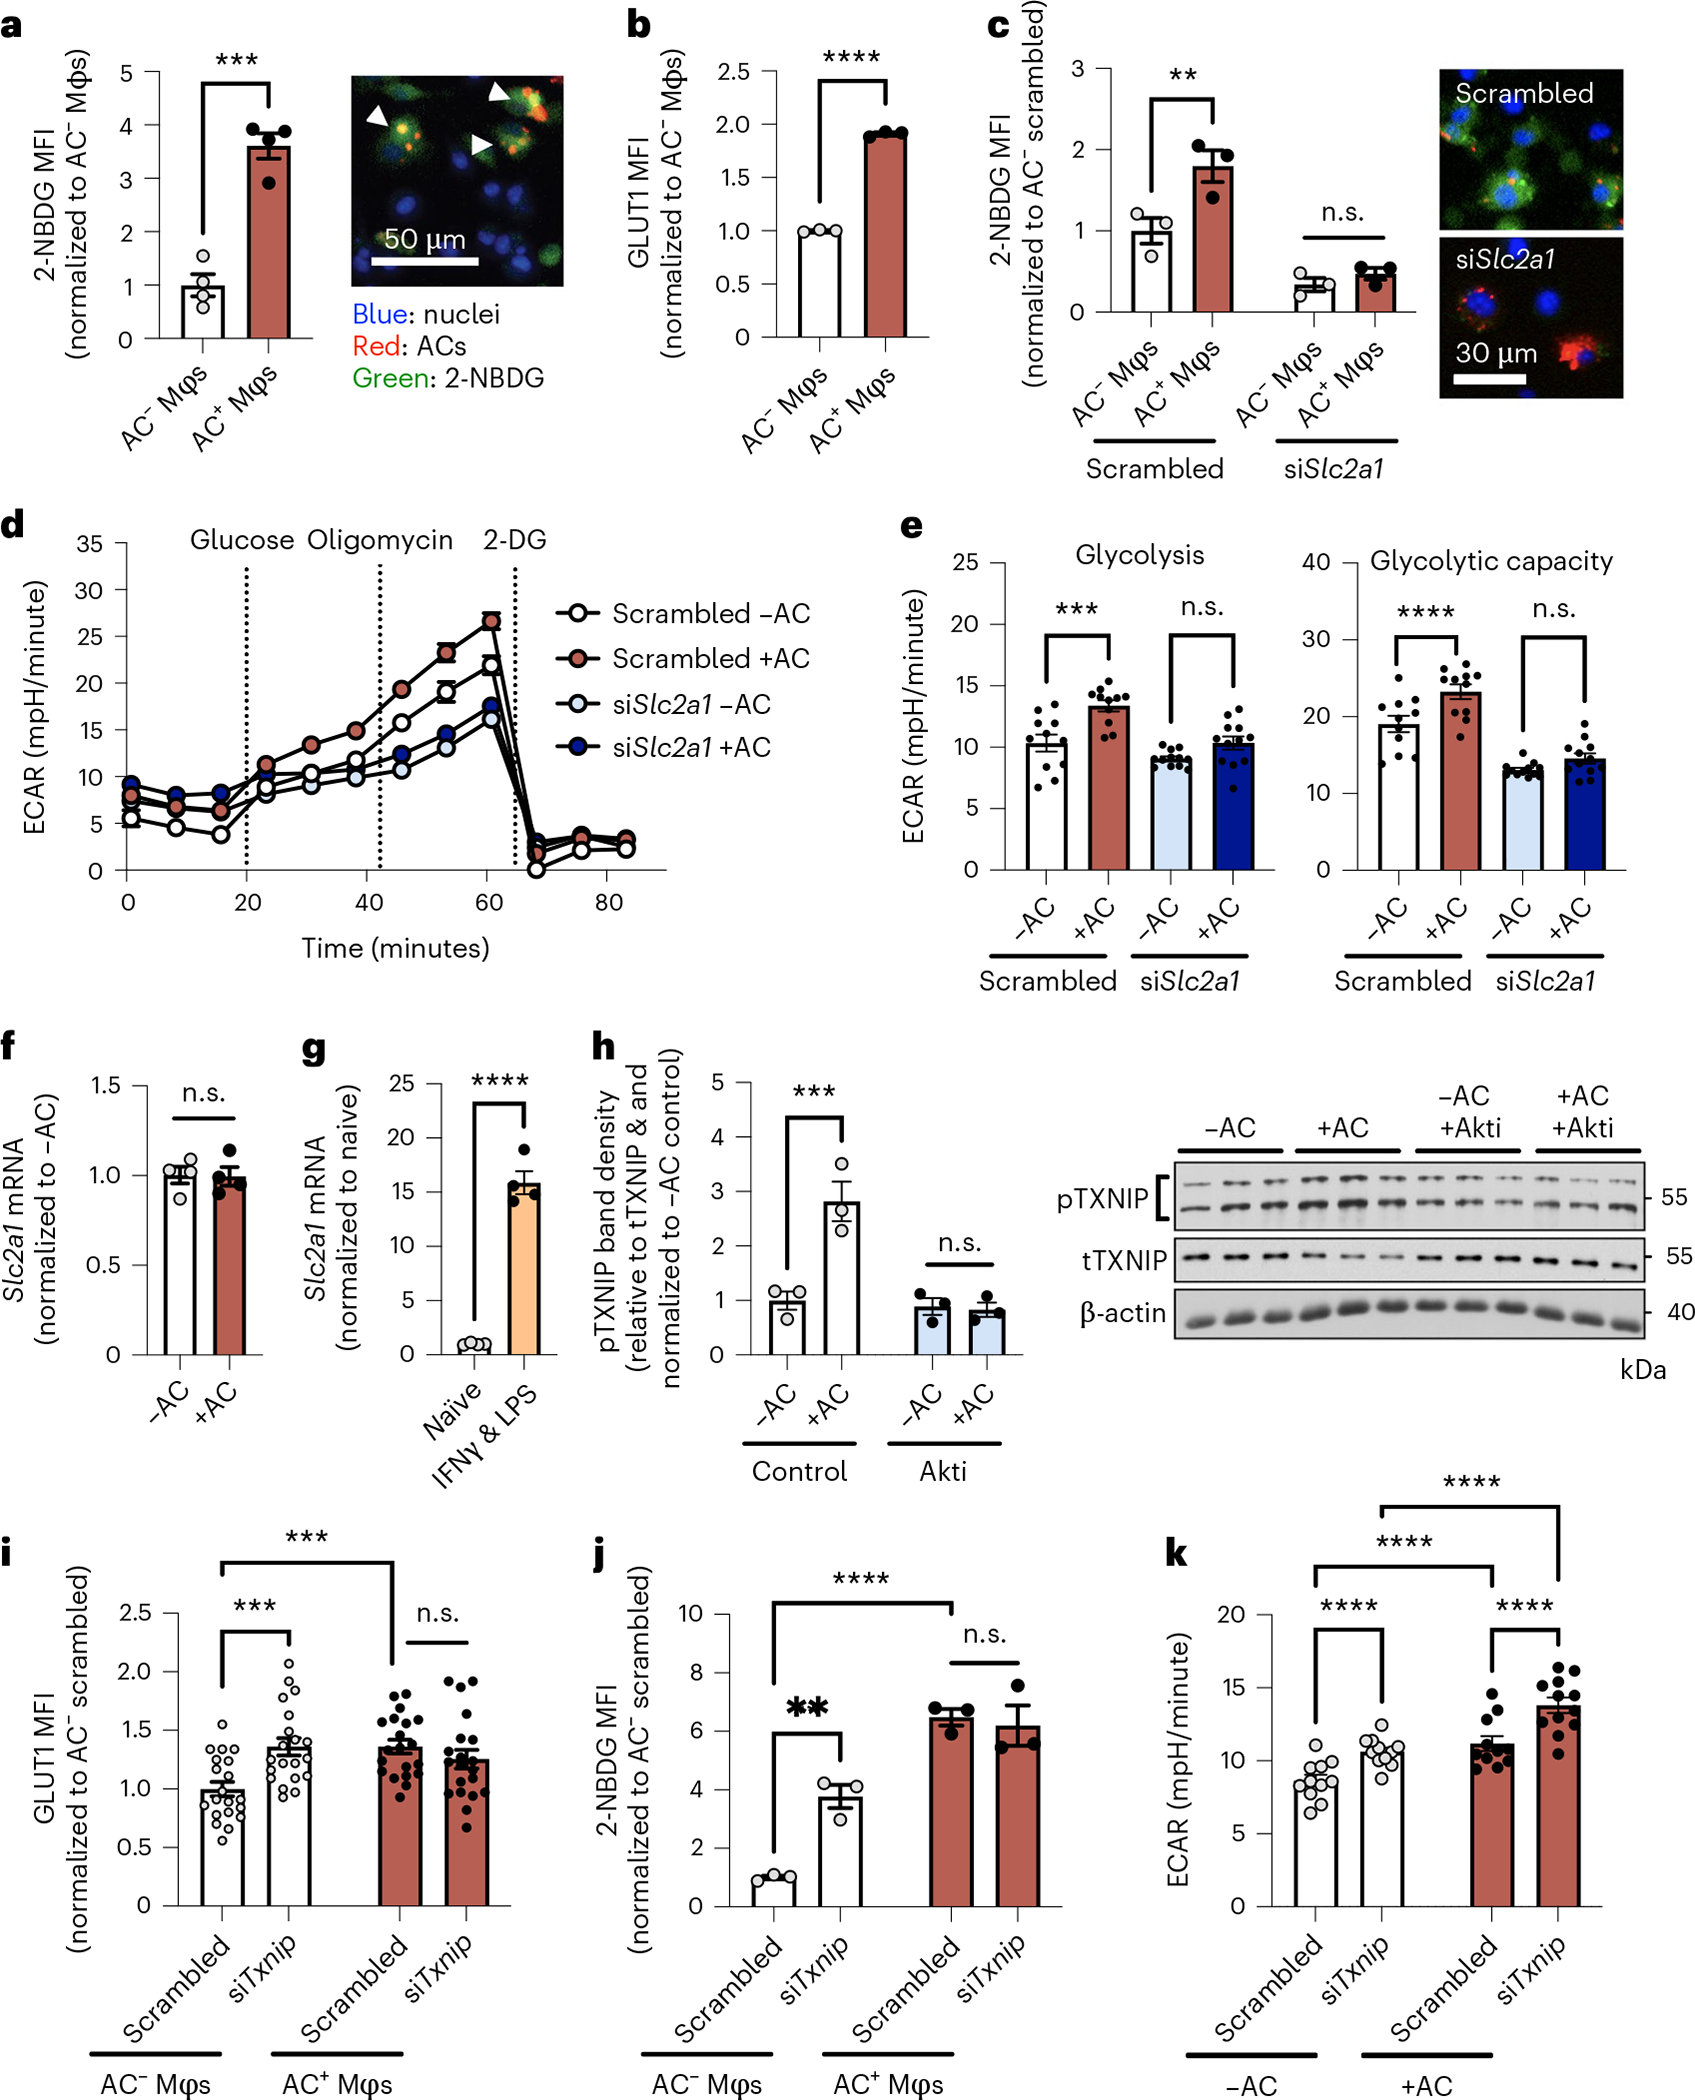
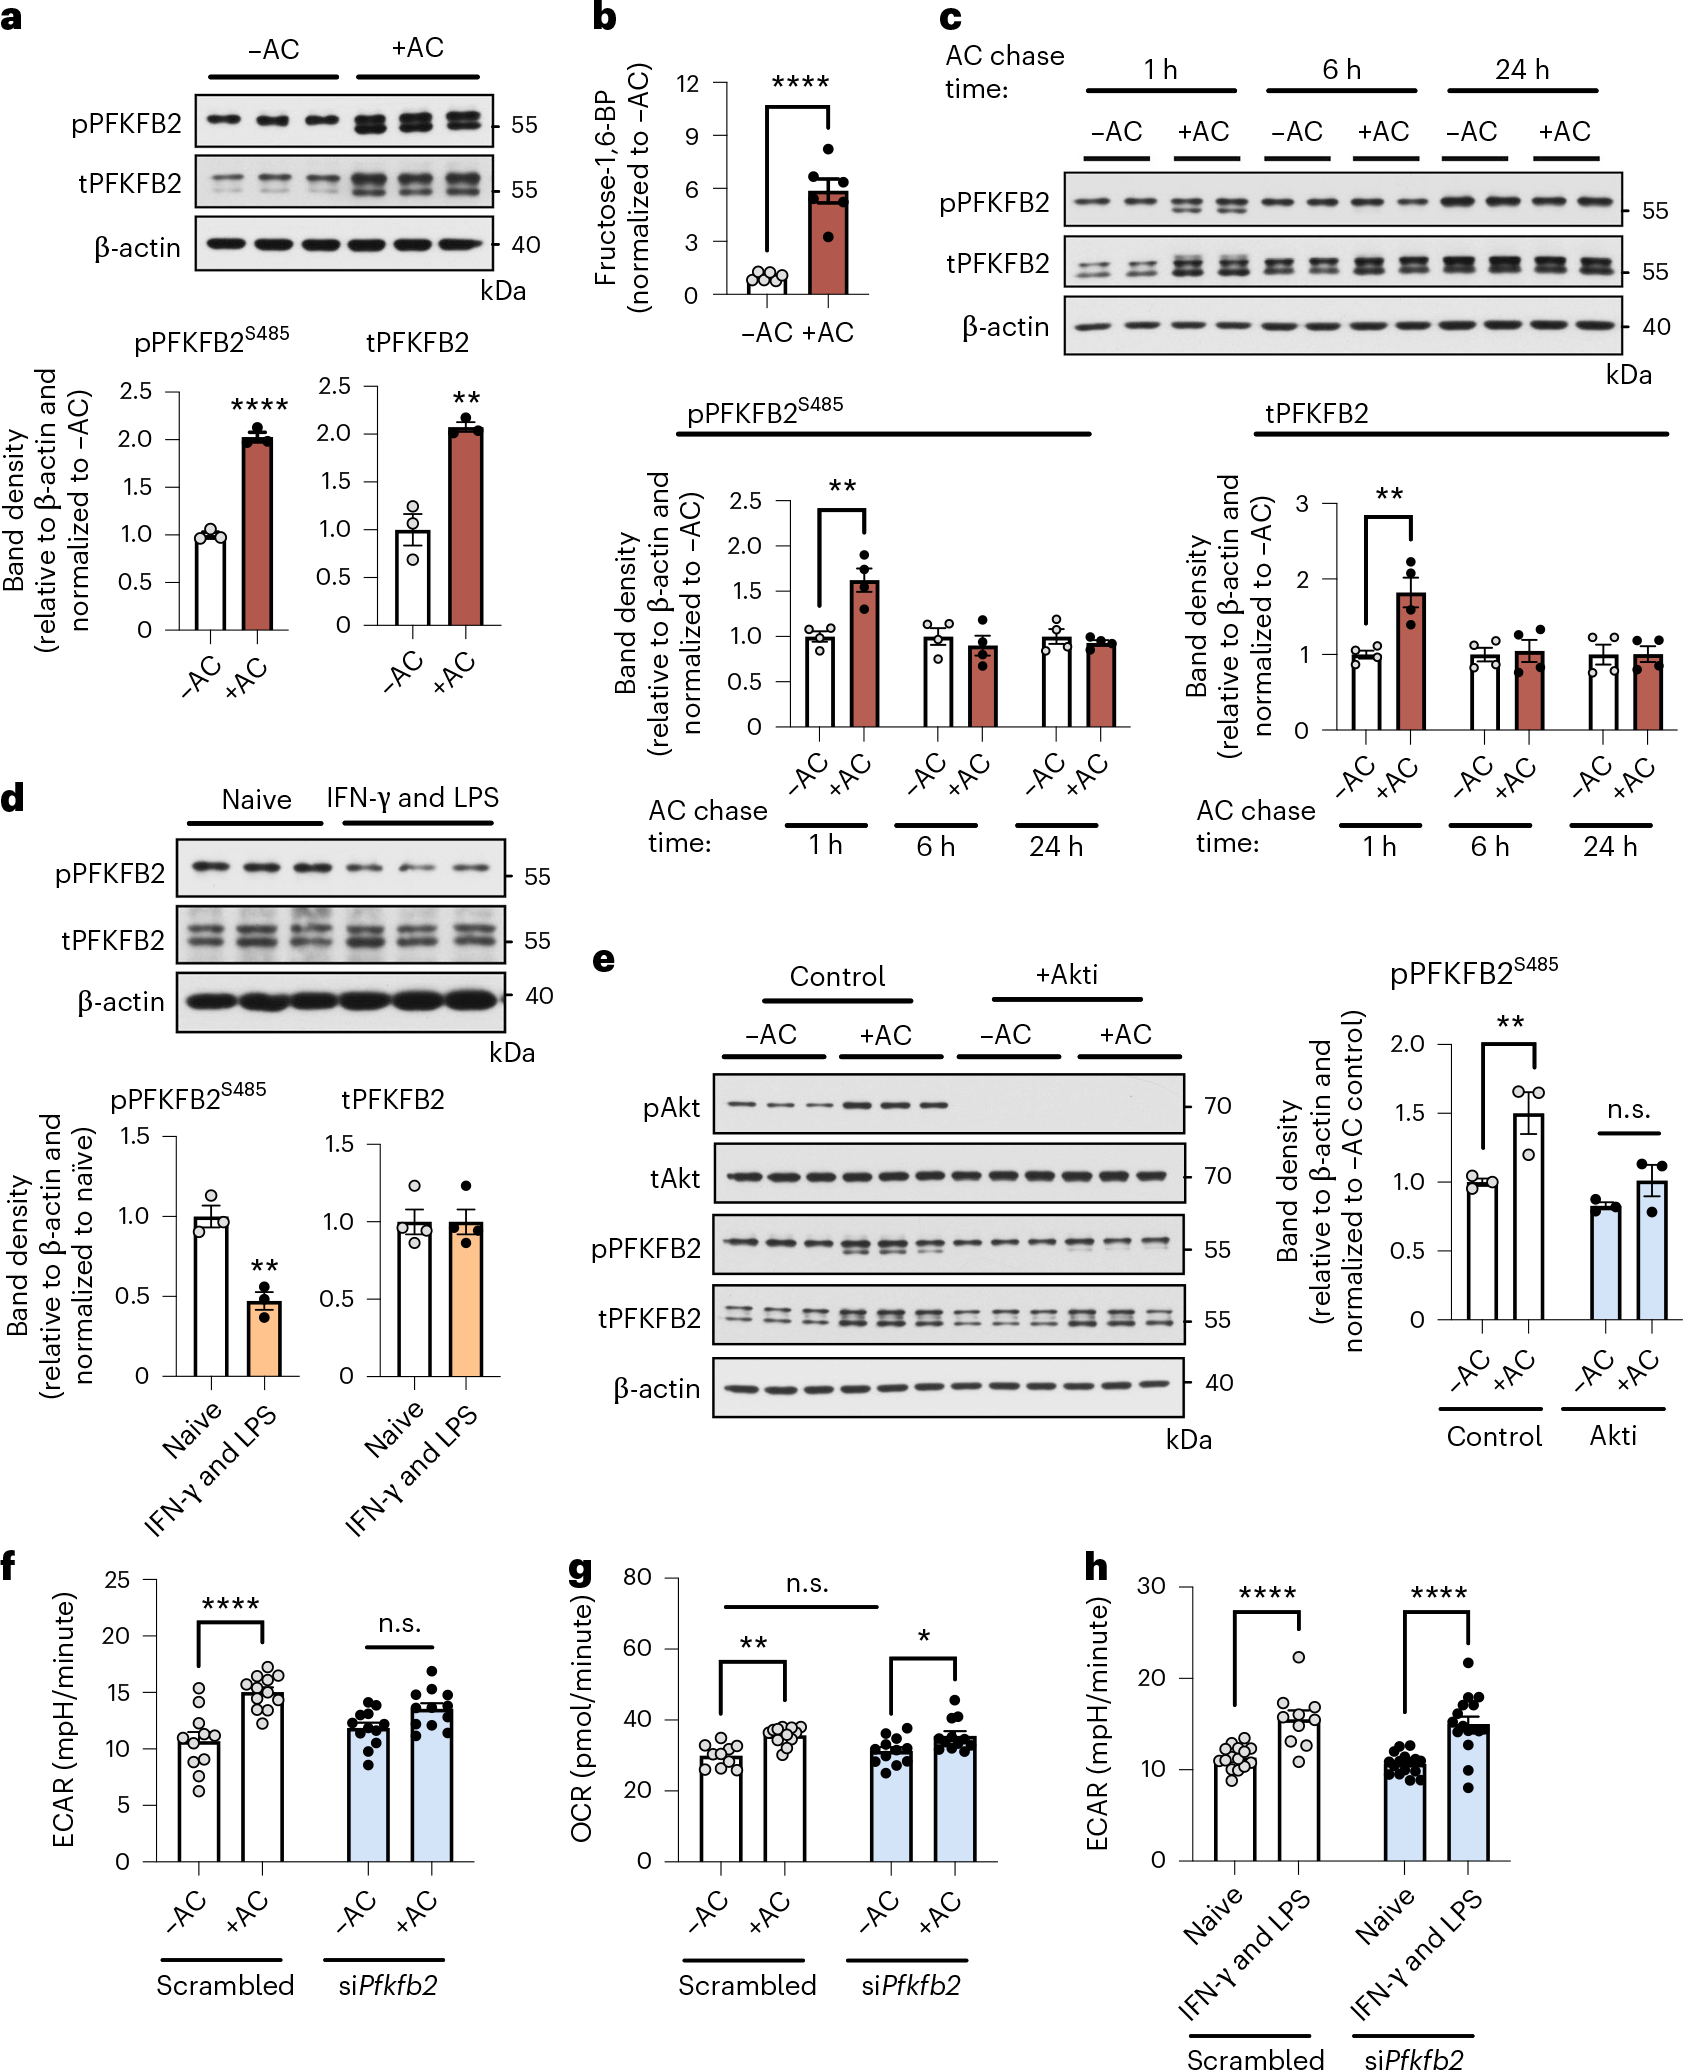
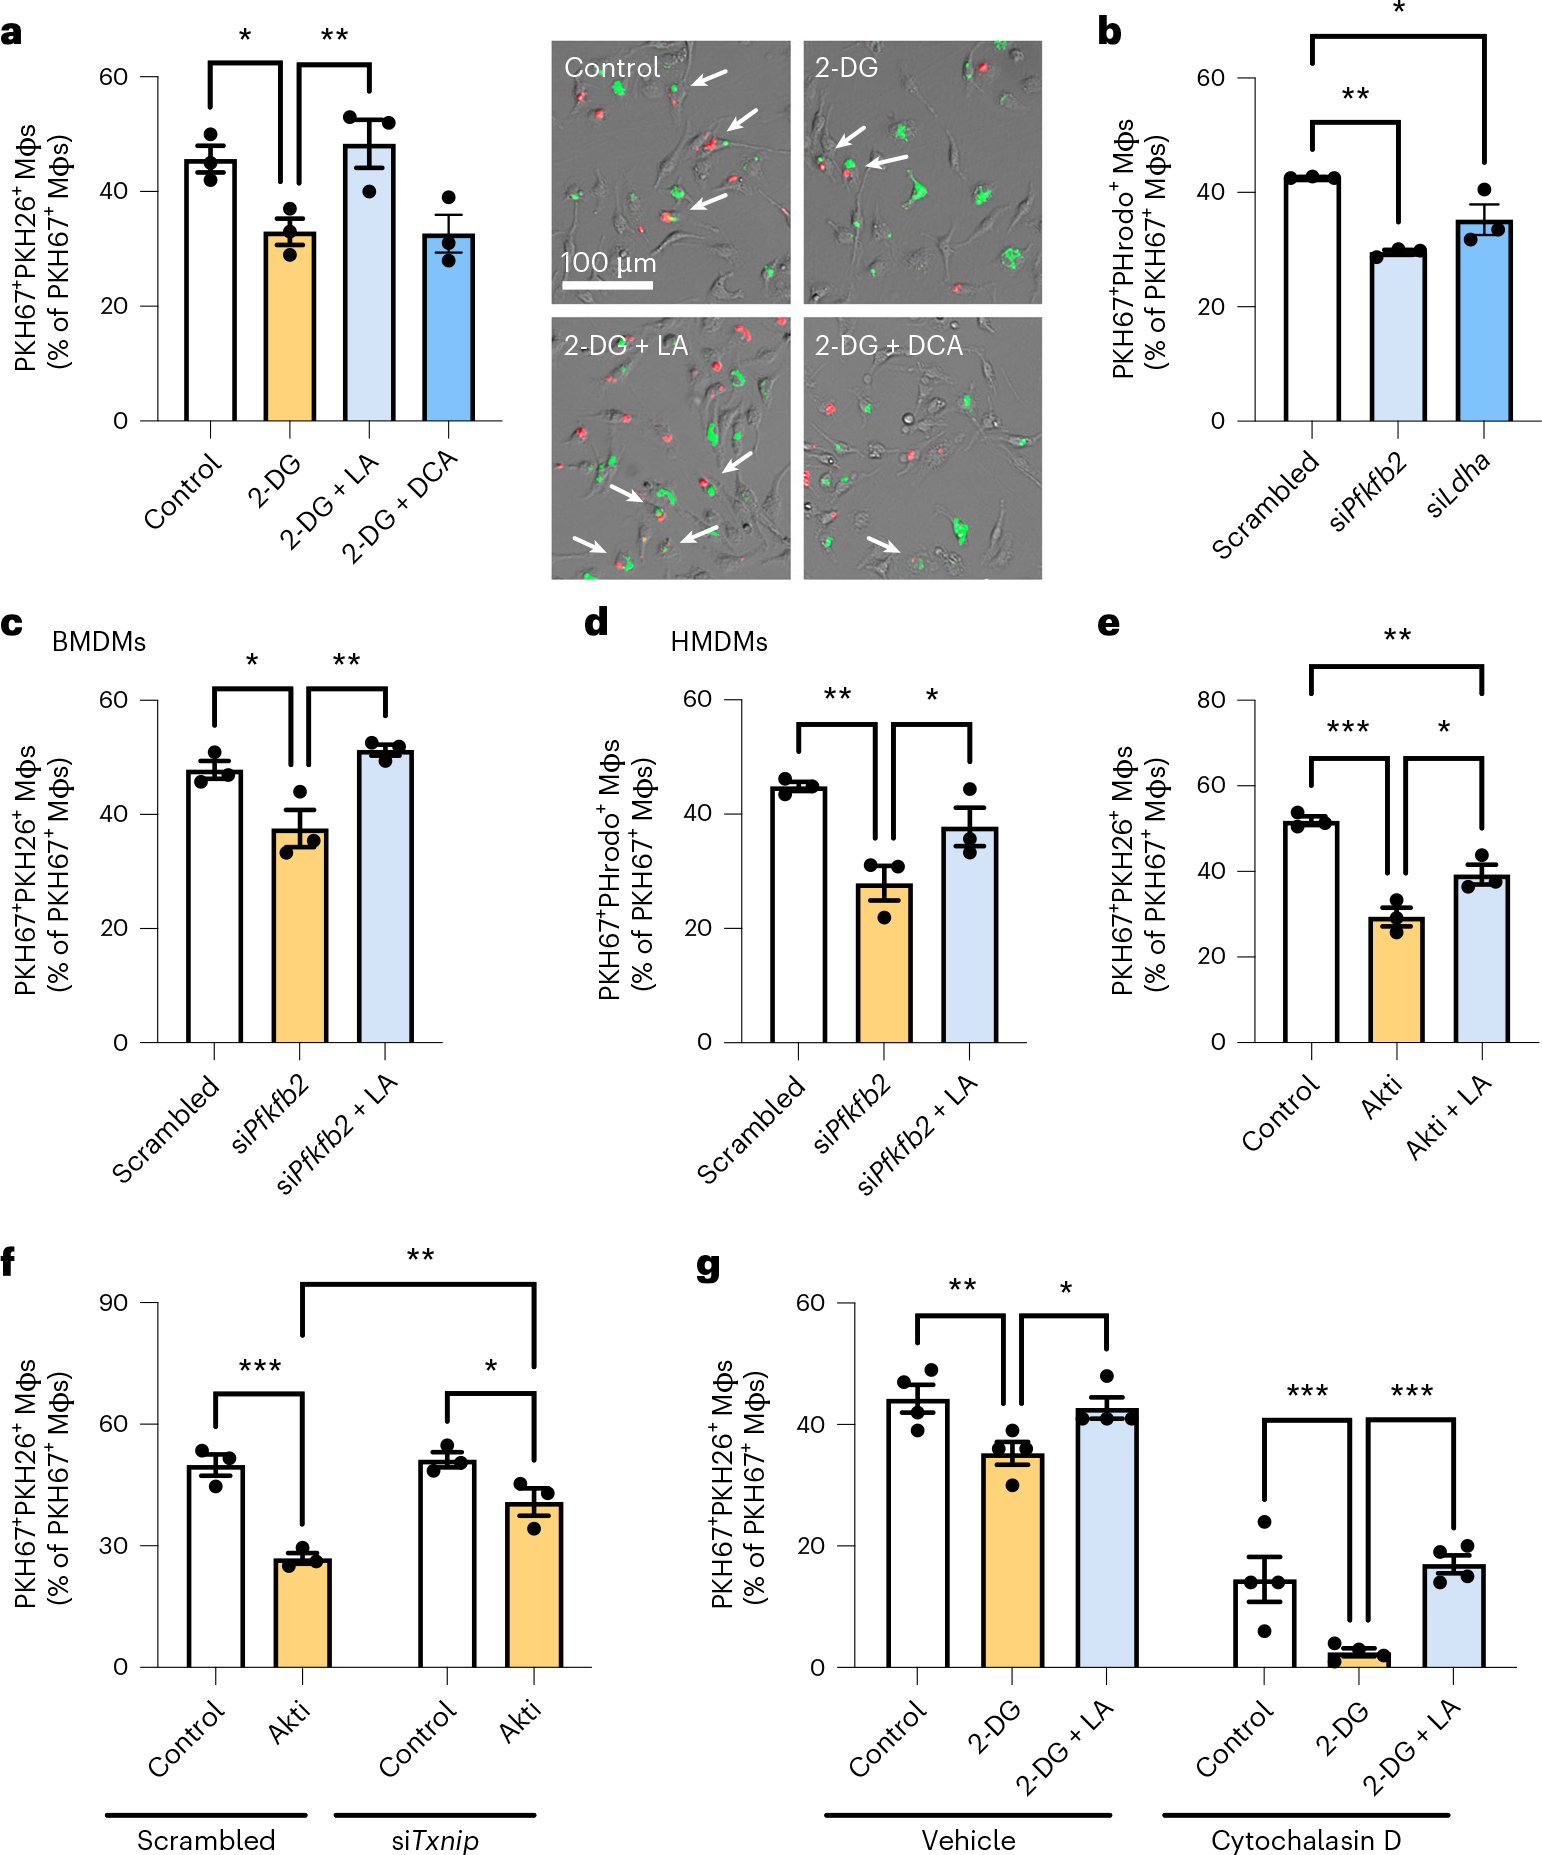
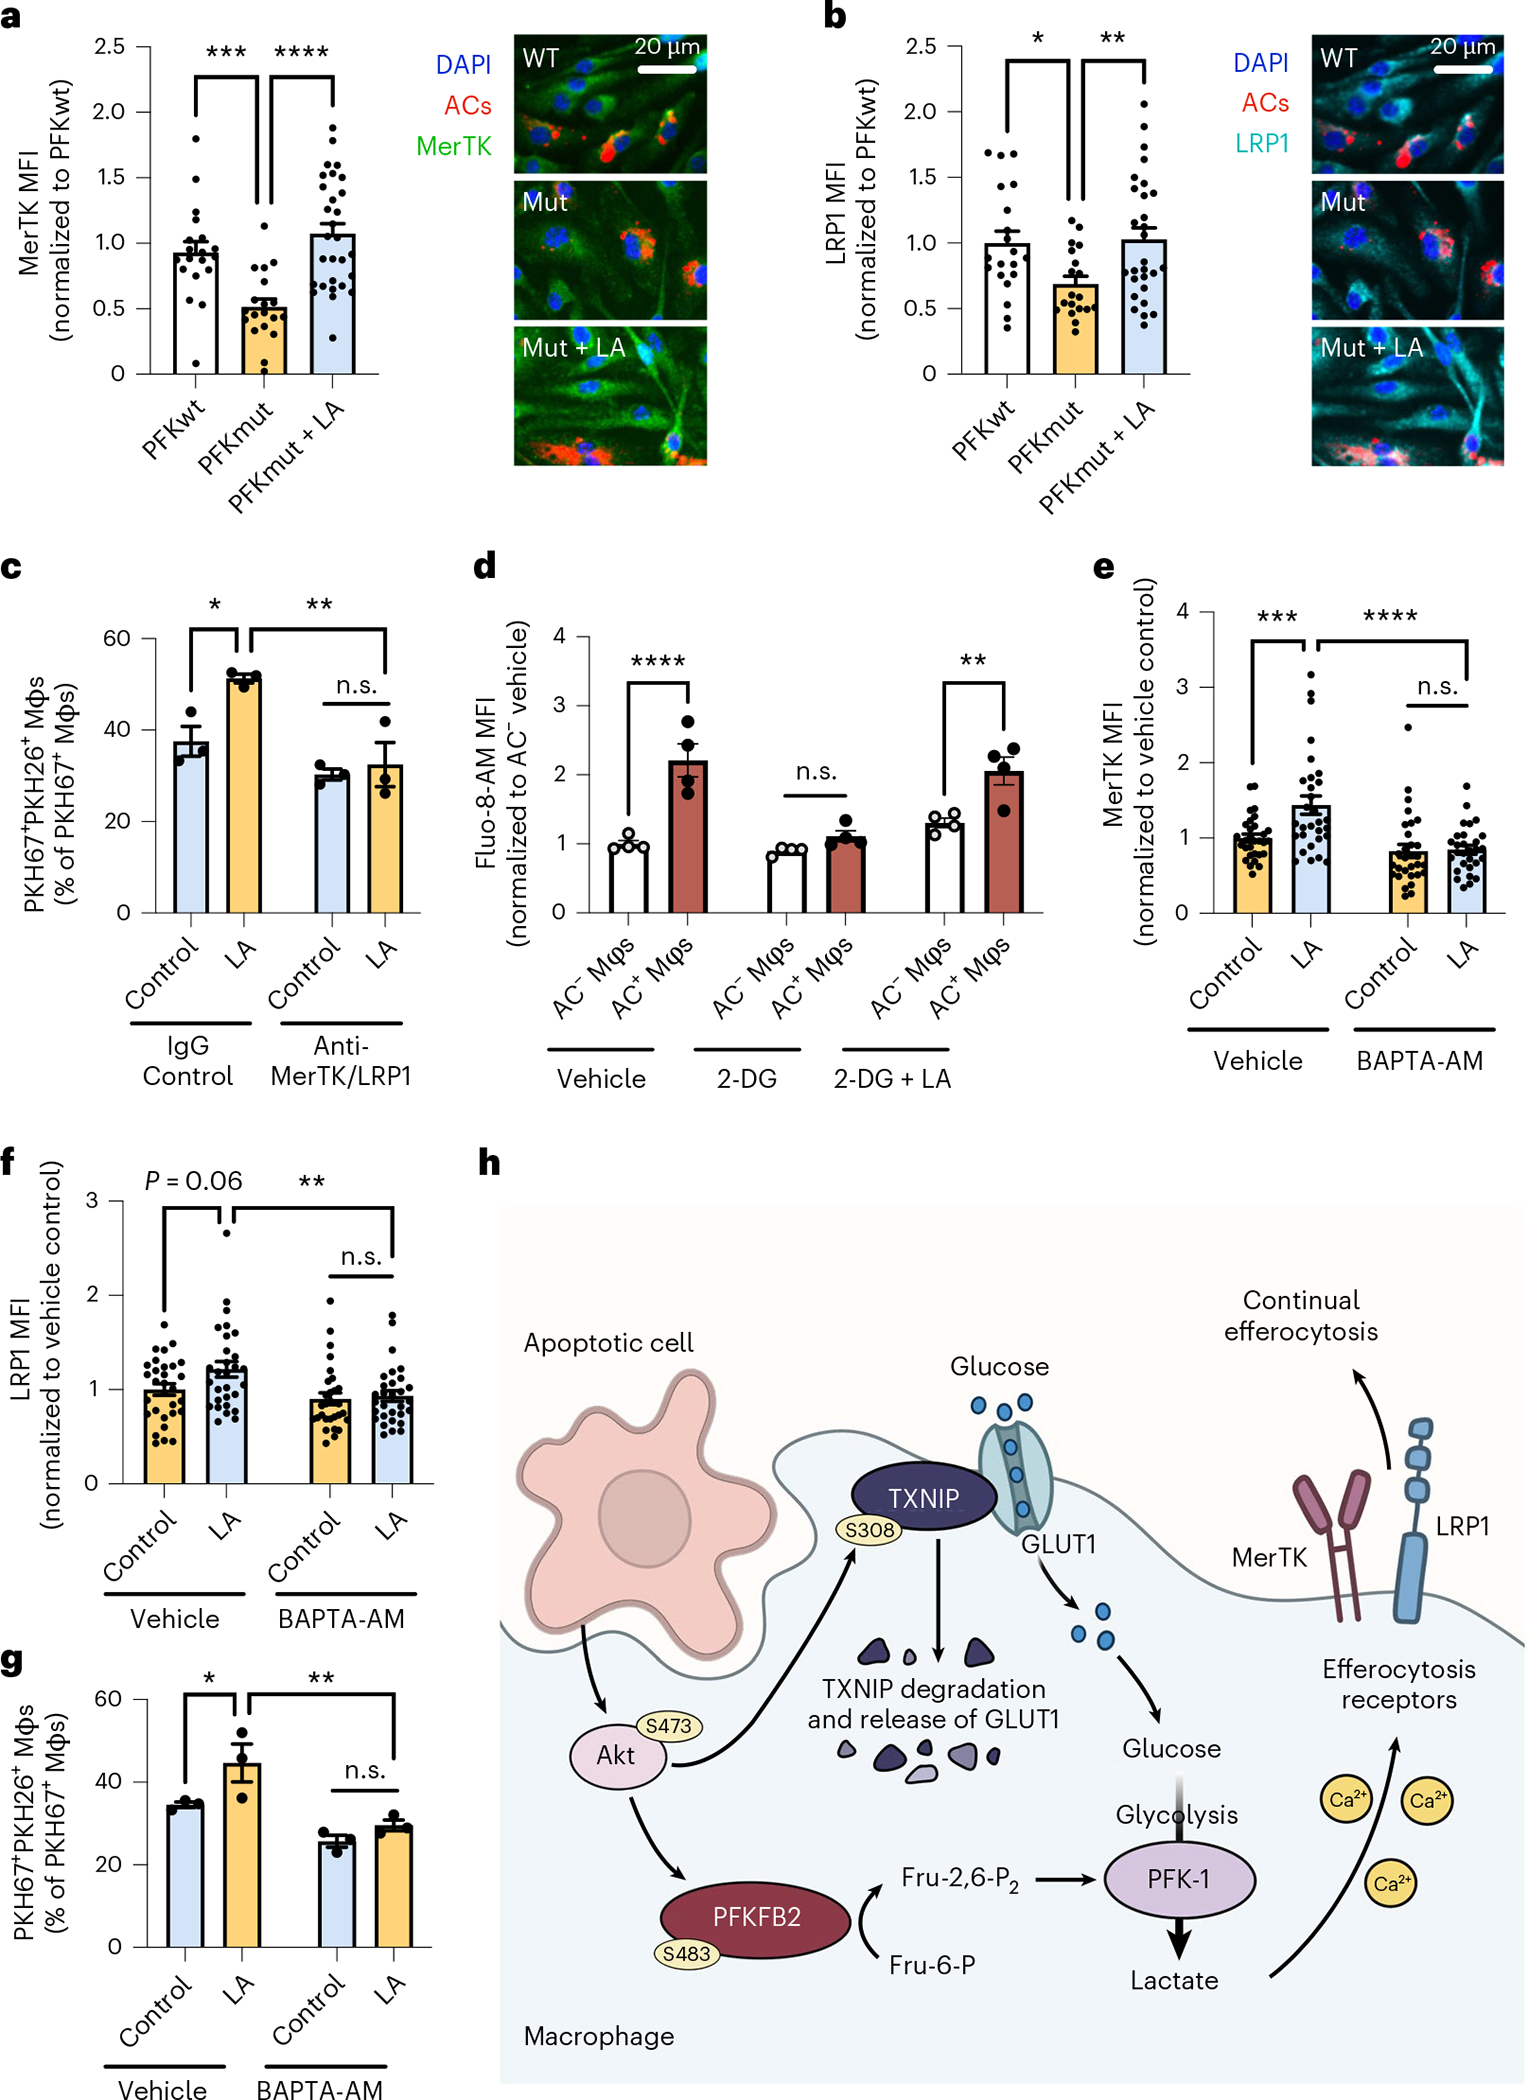
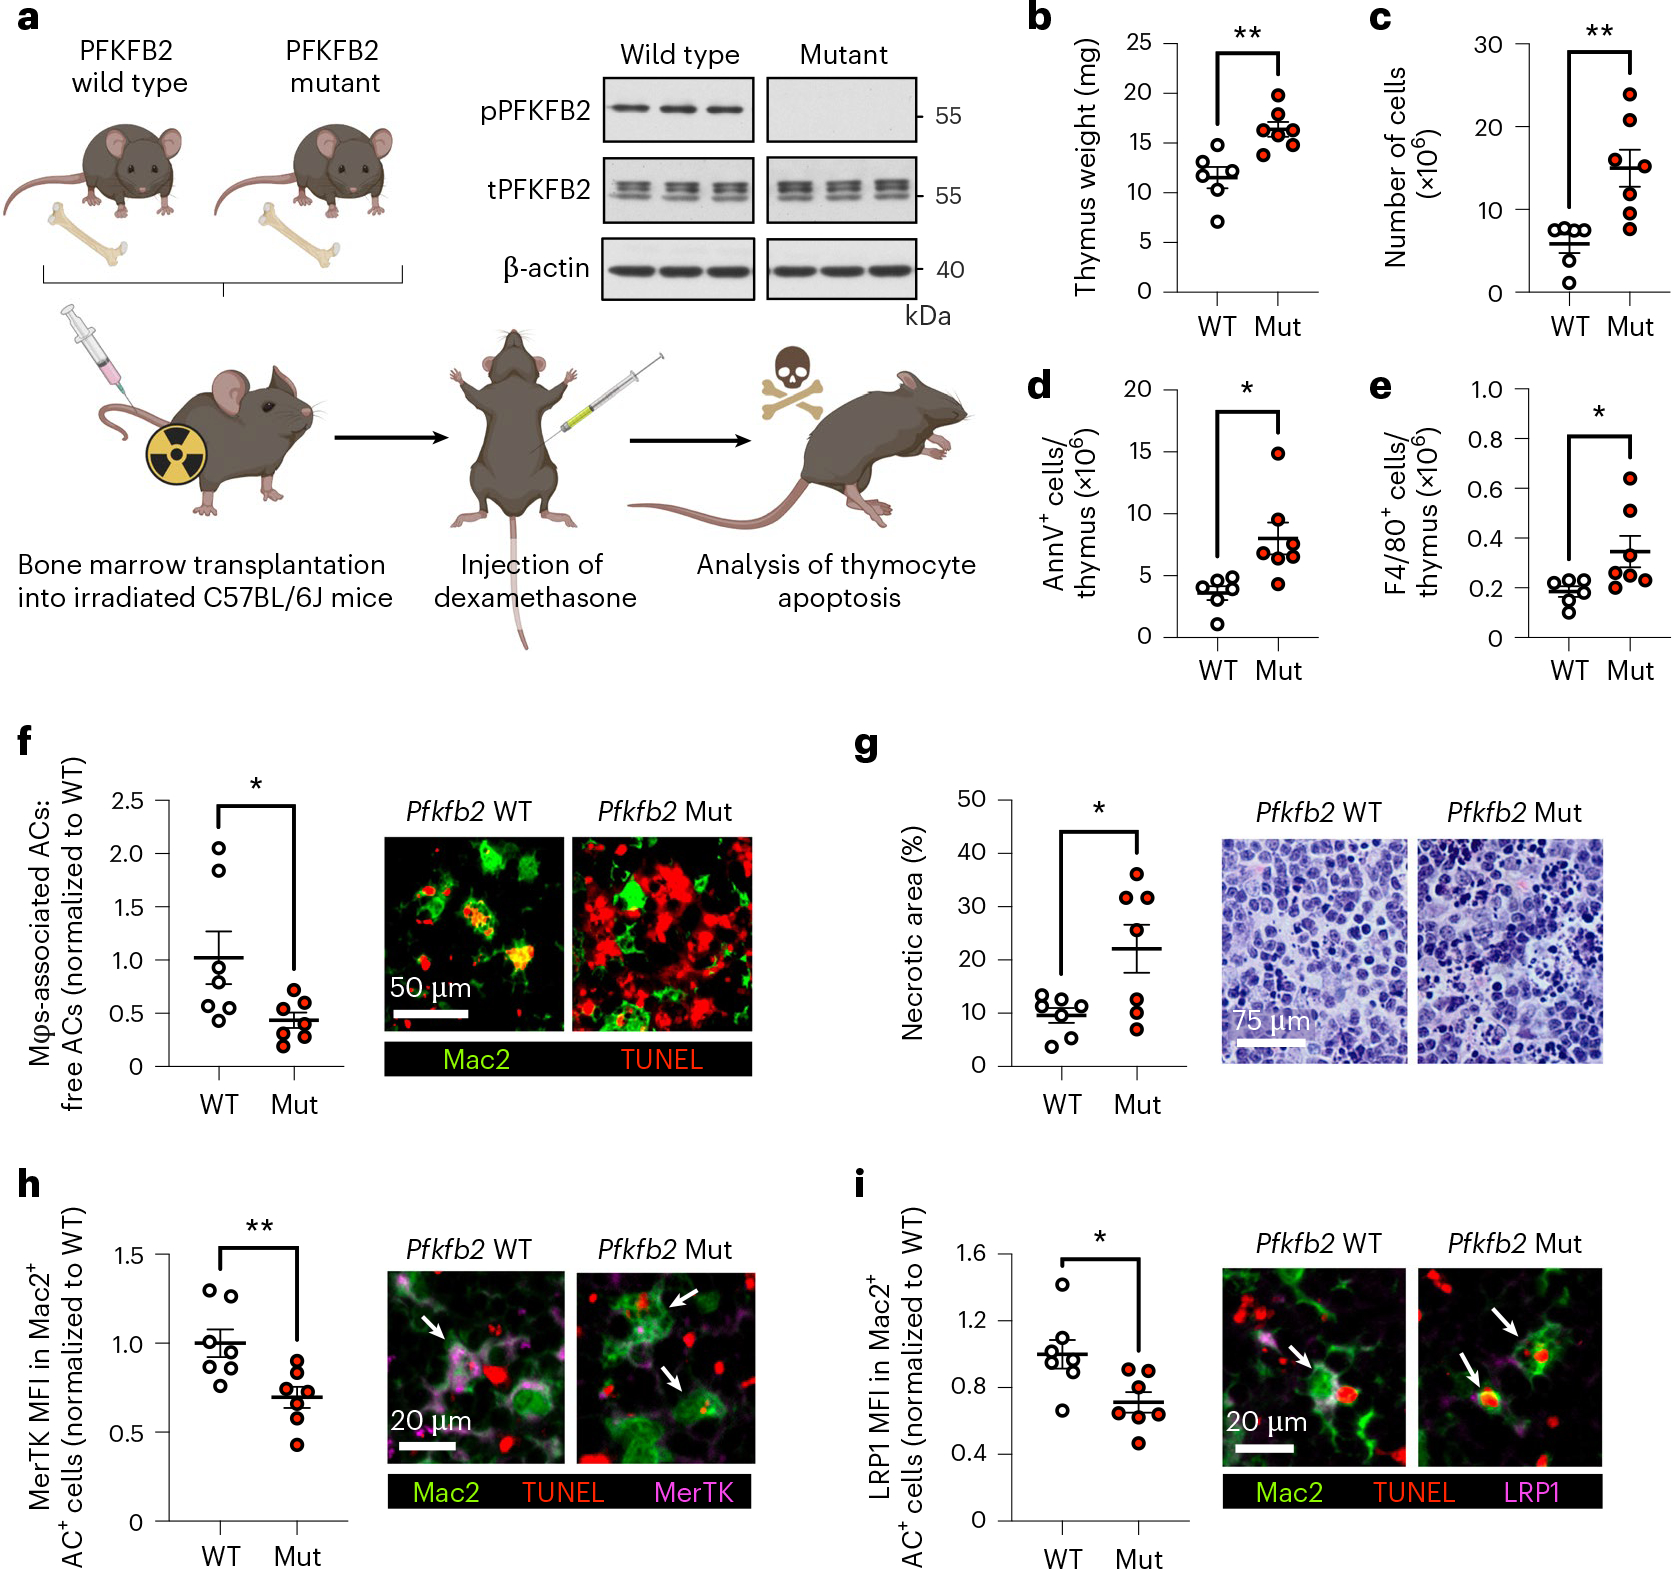
Resolving-type macrophages prevent chronic inflammation by clearing apoptotic cells through efferocytosis. These macrophages are thought to rely mainly on oxidative phosphorylation, but emerging evidence suggests a possible link between efferocytosis and glycolysis. To gain further insight into this issue, we investigated molecular-cellular mechanisms involved in efferocytosis-induced macrophage glycolysis and its consequences. We found that efferocytosis promotes a transient increase in macrophage glycolysis that is dependent on rapid activation of the enzyme 6-phosphofructo-2-kinase/fructose-2,6-bisphosphatase 2 (PFKFB2), which distinguishes this process from glycolysis in pro-inflammatory macrophages. Mice transplanted with activation-defective PFKFB2 bone marrow and then subjected to dexamethasone-induced thymocyte apoptosis exhibit impaired thymic efferocytosis, increased thymic necrosis, and lower expression of the efferocytosis receptors MerTK and LRP1 on thymic macrophages compared with wild-type control mice. In vitro mechanistic studies revealed that glycolysis stimulated by the uptake of a first apoptotic cell promotes continual efferocytosis through lactate-mediated upregulation of MerTK and LRP1. Thus, efferocytosis-induced macrophage glycolysis represents a unique metabolic process that sustains continual efferocytosis in a lactate-dependent manner. The differentiation of this process from inflammatory macrophage glycolysis raises the possibility that it could be therapeutically enhanced to promote efferocytosis and resolution in chronic inflammatory diseases.


Conflict of interest statement

Competing interests

The authors declare no competing interests.

Figures

Extended Data Fig. 1 |
Extended Data Fig. 1 |. Seahorse analysis of macrophages treated with either IFNγ and LPS or IL-4.
a, Naïve BMDMs were polarized towards a proinflammatory phenotype with IFNγ and LPS or a pro-resolving phenotype with IL-4 for 24 h followed by Seahorse analysis. The extracellular acidification rate (ECAR), a measure of glycolysis, was measured at baseline and after the addition of glucose (‘glycolysis’), oligomycin (‘glycolytic capacity’), and 2-DG. The oxygen consumption rate (OCR), a measure of oxidative phosphorylation, was measured at baseline (‘basal respiration’) and after the addition of oligomycin, FCCP (‘maximal respiration), and rotenone plus antimycin A (n = 15–16 wells/group). **P = 0.0017 (naïve vs. IFNγ and LPS), **P = 0.0048 (naïve vs. IL-4), ***P < 0.0001, as compared to the naïve groups. b, The same experiment as described under panel a was performed in HMDMs (n = 7–8 wells/group). *P = 0.046 for glycolysis, *P = 0.044 for glycolytic capacity, *P = 0.021 for basal respiration, as compared to the naïve groups. All values are means ± SEM, and significance was determined by one-way ANOVA with Fisher’s LSD post hoc analysis.
Extended Data Fig. 2 |
Extended Data Fig. 2 |. Seahorse analysis of macrophages at various times following incubation with apoptotic cells, and in apoptotic cells alone.
a, BMDMs (were incubated with apoptotic Jurkat cells (ACs) for 45 min (pulse), followed by rinsing to remove unengulfed ACs, and then subjected to Seahorse analysis 1, 6, or 24 h later (chase). The oxygen consumption rate (OCR), a measure of oxidative phosphorylation, was measured at baseline (‘basal respiration’) and after the addition of oligomycin, FCCP (‘maximal respiration), and rotenone plus antimycin A (n = 11–12 wells/group). *P = 0.0027, **P = 0.0011 (basal 1 h chase), **P = 0.0031 (basal 6 h chase), **P = 0.0036 (ATP production 1 h chase), as compared to the -AC groups. b, The same experiment as described under panel a was performed in HMDMs (n = 8 wells/group). ***P < 0.0001, as compared to the -AC group. c, A glycolysis stress test was performed in HMDMs differentiated with M-CSF instead of GM-CSF, after a 1 h chase without or with ACs (n = 11–12 wells/group). *P < 0.05, ***P < 0.001. d,e, A glycolysis stress test was performed in BMDMs after a 1 h chase without or with ACs (n = 14–15 wells/group; 20,000 macrophages per well), or in ACs alone (n = 3 wells; 100,000 ACs/well). The ECAR and OCR were measured to evaluate glycolysis (d) and oxidative phosphorylation (e), respectively. All values are means ± SEM, and significance was determined by one-way ANOVA with Fisher’s LSD post hoc analysis (a-b) or multiple two-tailed Student’s t-tests (c).
Extended Data Fig. 3 |
Extended Data Fig. 3 |. Flow cytometry analysis of cell-surface GLUT1 expression in efferocytic macrophages.
BMDMs were incubated with PKH67-labeled apoptotic cells (ACs) for 45 min, rinsed and harvested 1 h later for flow cytometric analysis of cell-surface GLUT1 using an APC-conjugated GLUT1 antibody. a, Gating strategy for AC and AC+ macrophages, with PKH67 detected in the FITC channel. b, The mean fluorescent intensity (MFI) of cell-surface GLUT1 based on the flow cytometric data.
Extended Data Fig. 4 |
Extended Data Fig. 4 |. Analysis of siRNA silencing efficiency, efferocytosis-induced gene expression, and 2-NBDG uptake.
a, BMDMs were transfected with scrambled RNA or siSlc2a1, and Slc2a1 expression was measured by RT-qPCR (n = 2 wells/group). b, BMDMs (Mφs) pretreated with the Akt inhibitor MK-2205 (5 μM) were incubated with fluorescently labeled apoptotic Jurkat cells (ACs) for 45 min, followed by rinsing and addition of glucose-free medium containing 2-NBDG without or with MK-2205. After 1 h, macrophages were fixed and the mean fluorescent intensity (MFI) of 2-NBDG was quantified in AC and AC+ macrophages by fluorescent microscopy (n = 3 images/group). **P = 0.0047. c,d, BMDMs were transfected with scrambled RNA or siTxnip, and knockdown was validated by RT-qPCR (n = 2 wells/group) and immunoblotting (n = 3 samples/group). e, BMDMs were incubated in the absence or presence of ACs for 45 min, rinsed, and Pfkfb2 expression was measured 1 h later (n = 4 wells/group). *P = 0.018 (pTXNIP), *P = 0.015 (tTXNIP). f, A 2-NBDG assay as described under panel B was performed in Mφs after 1 or 6 h of incubation with ACs (n = 3 images/group). *P = 0.011 (1 h ACchase), *P = 0.028 (6 h ACchase). g, BMDMs were transfected with scrambled RNA or siPfkfb2, and Pfkfb2 expression was measured by RT-qPCR (n = 2 wells/group). h, A 2-NBDG assay as described under panel B was performed in Mφs transfected with scrambled RNA or siPfkfb2 (n = 3 images/group). *P = 0.035 (Scrambled), *P = 0.027 (siPfkfb2) All values are means ± SEM, and significance was determined by two-way ANOVA with Fisher’s LSD post hoc analysis. ns, not significant (P > 0.05).
Extended Data Fig. 5 |
Extended Data Fig. 5 |. Additional efferocytosis assays and validation of siRNA silencing efficiency.
a, BMDMs were pretreated without or with 10 mM 2-DG for 1 h, followed by incubation with PKH26-labeled apoptotic Jurkat cells (ACs) for 45 min. Unengulfed ACs were then rinsed away, and the number of PKH26+ macrophages were quantified as a measure of single efferocytosis (n = 4 wells/group). b, BMDMs were transfected with scrambled RNA or siPfkfb2, and Pfkfb2 gene expression was measured by RT-qPCR (n = 3 wells/group). ****P < 0.0001. c, BMDMs were transfected with scrambled RNA or siLdha, and Ldha gene expression was measured by RT-qPCR (n = 3 wells/group). ****P < 0.0001. d, BMDMs were transfected with scrambled RNA, siPfkfb2 or siLdha, followed by a single efferocytosis assay as described for panel A (n = 3 wells/group). e, HMDMs were transfected with scrambled RNA or siPfkfb2, and PFKFB2 gene expression was measured by RT-qPCR (n = 3 wells/group). ****P < 0.0001. All values are means ± SEM, and significance was determined by the two-tailed Student’s t-test (a-c & e) or two-way ANOVA with Fisher’s LSD post hoc analysis in panel d. ns, not significant (P > 0.05).
Extended Data Fig. 6 |
Extended Data Fig. 6 |. Pfkfb3 and Pfkfb4 are upregulated by IFNγ and LPS, and partial silencing of Pfkfb3 and Pfkfb4 does not affect efferocytosis.
a,b, Expression levels of Pfkfb3 and Pfkfb4 were measured by RT-qPCR in naïve macrophages and macrophages polarized towards a pro-inflammatory phenotype with IFNγ and LPS (n = 4 wells/group). **P = 0.0011, ****P < 0.0001. c, BMDMs were transfected with scrambled RNA or siPfkfb3, and Pfkfb3 expression was measured (n = 3 wells/group). **P = 0.0018. d, BMDMs were transfected with scrambled RNA or siPfkfb4, and Pfkfb4 expression was measured (n = 3 wells/group). **P = 0.0018. e, BMDMs transfected with scrambled RNA, siPfkfb3, or siPfkfb4 were incubated with PKH26-labeled apoptotic Jurkat cells (ACs) for 45 min. Unengulfed ACs were removed by rinsing, and the number of PKH26+ macrophages were quantified (n = 4 wells/ group). f, BMDMs transfected with scrambled RNA, siPfkfb3, or siPfkfb4 were first incubated with PKH67-labeled ACs for 45 min, rinsed, and 2 h later incubated with PKH26-labeled ACs for 45 min. The number of PKH67+ PKH26+ Mφs relative to PKH67+ Mφs was quantified as a measure of continual efferocytosis (n = 4 wells/group). All values are means ± SEM, and significance was determined by the two-tailed Student’s t-test (a-d) or one-way ANOVA with Fisher’s LSD post hoc analysis (e-f). ns, not significant (P > 0.05).
Extended Data Fig. 7 |
Extended Data Fig. 7 |. Macrophages from PFKFB2 mutant mice show attenuated efferocytosis-induced glycolysis.
BMDMs from PFKFB2 mutant mice (Mut) and wild-type littermates (WT) were incubated without or with apoptotic Jurkat cells (ACs) for 45 min, followed by rinsing to remove unengulfed ACs, and then subjected to Seahorse analysis 1 h later. a, The extracellular acidification rate (ECAR), a measure of glycolysis, was measured at baseline and after the addition of glucose (‘glycolysis’), oligomycin (‘glycolytic capacity’), and 2-DG (n = 8–9 wells/group). **P = 0.0028 (WT+AC vs. Mut+AC), **P = 0.0070 (Mut-AC vs. Mut+AC), ****P < 0.0001 for glycolysis, *P = 0.031, **P = 0.0057, ****P < 0.0001 for glycolytic capacity. b, The oxygen consumption rate (OCR), a measure of oxidative phosphorylation, was measured at baseline (‘basal respiration’) and after the addition of oligomycin, FCCP (‘maximal respiration), and rotenone plus antimycin A (n = 8–9 wells/group). ***P = 0.0001, ****P < 0.0001. All values are means ± SEM, and significance was determined by two-way ANOVA with Fisher’s LSD post hoc analysis. ns, not significant (P > 0.05).
Extended Data Fig. 8 |
Extended Data Fig. 8 |. Immunoblotting for MerTK and LRP1, validation of siRNA silencing efficiency, and experiments with siSlc16a1.
a, BMDMs from PFKFB2 mutant mice and wild-type littermates were incubated without or with apoptotic Jurkat cells (ACs) for 45 min, rinsed, and harvested 2 h later for immunoblotting of MerTK, LRP1 and β-actin. The relative level of MerTK/LRP1 vs. β-actin was quantified by band densitometry (n = 3 samples/group). b, BMDMs were transfected with scrambled RNA or siPfkfb2, and Pfkfb2 gene expression was measured by RT-qPCR (n = 3 wells/group). ***P = 0.0002. c, BMDMs were transfected with scrambled RNA or siSlc16a1, and Slc16a1 expression was measured (n = 3 wells/group). ****P < 0.0001 d, BMDMs transfected with scrambled RNA or siSlc16a1 were incubated with ACs for 45 min, rinsed and 1 h later harvested for lactate measurement in the media (extracellular) and the cells (intracellular) (n = 3 wells/group). *P = 0.029. e,f, A continual efferocytosis assay (f) and single efferocytosis assay (g), as described in the legend of Extended Data Fig. 6, were performed in macrophages treated with scrambled RNA or siSlc16a1 and incubated with vehicle or lactate (10 mM) before adding the first or second round of ACs, respectively (n = 4 wells/group). *P = 0.031, **P = 0.0028. All values are means ± SEM, and significance was determined by two-way ANOVA with Fisher’s LSD post hoc analysis (a, e-f) or the one- or two-tailed Student’s t-test (b-d). ns, not significant (P > 0.05).
Extended Data Fig. 9 |
Extended Data Fig. 9 |. Additional analyses and representative images of the dexamethasone-thymus experiment.
a, Thymus weight and b, cellularity of PBS-injected hematopoietic wild-type (wt) and PFKFB2 mutant (mut) mice (n = 2–3 mice/group). c, Representative images of thymus sections from PBS-injected (n = 2) and dexamethasone (dex)-injected (n = 7) wild-type mice stained for Mac2 (macrophages) and TUNEL (apoptotic cells). d, Representative images of H&E-stained thymus sections of hematopoietic wild-type and PFKFB2 mutant mice at 10x magnification, and from the thymic cortex at 40x magnification, as indicated by the magnified inset (n = 2–3 mice in the PBS-injected groups, n=7 mice in the dex-injected groups). e, The mean fluorescent intensity (MFI) of phospho-PFKFB2 was measured in Mac2+ AC (yellow arrowheads) and Mac2+ AC+ (that is, TUNEL+; white arrowheads) macrophages in the thymus of dex-injected wt mice by IFM (n = 7 mice/group). **P = 0.0011. All values are means ± SEM, and significance determined by the two-tailed Student’s t-test.
Extended Data Fig. 10 |
Extended Data Fig. 10 |. Flow cytometric analysis of apoptotic thymocytes from the dexamethasone-thymus experiment.
All cells were isolated from the thymi of hematopoietic PFKFB2 mutant and wild-type mice of the dexamethasone-thymus experiment (see Fig. 5 of the main manuscript) and subjected to flow cytometric analysis. The cells were immunostained for the apoptotic cell marker annexin V (AnnV; FITC) and, using the depicted gating strategy, quantified for the percentages of AnnV (live) and AnnV+ (apoptotic) thymocytes.
Fig. 1 |
Fig. 1 |. Efferocytosis promotes a transient increase in glycolysis in both mouse and human macrophages.
a, BMDMs were incubated with apoptotic Jurkat cells (ACs) for 45 minutes (pulse), followed by rinsing to remove unengulfed ACs, and then subjected to Seahorse analysis 1, 6, or 24 hours later (1 hchase, 6 hchase, 24 hchase, respectively). The ECAR was measured in real time at baseline and after the addition of glucose (‘glycolysis’), oligomycin (‘glycolytic capacity’), and 2-DG (n = 11–12 wells/group). *P = 0.038, **P = 0.0011, ***P = 0.0006, ****P < 0.0001, compared with the control group of macrophages not exposed to ACs (–AC). b, The same experiment as described in a was performed in HMDMs (n = 7–8 wells/group). *P = 0.018 for glycolysis, *P = 0.028 for glycolytic capacity as compared with the –AC control group. c, Seahorse analysis was performed on BMDMs incubated with ACs continuously for 1 or 24 hours (1 hcontinuous and 24 hcontinuous, respectively) (n = 8–11 wells/group). **P = 0.0028, ****P < 0.0001, compared with the –AC control group. All values are means ± s.e.m., and significance was determined by two-way analysis of variance (ANOVA) with Fisher’s least significant difference (LSD) post hoc analysis.
Fig. 2 |
Fig. 2 |. Efferocytosis induces glucose uptake, dependent on TXNIP-mediated GLUT1 regulation.
a, BMDMs (Mφs) were incubated with pHrodo-labeled (red) apoptotic cells (ACs) for 45 minutes, followed by rinsing and addition of medium containing 2-NBDG. After 1 hour, the mean fluorescent intensity (MFI) of 2-NBDG (green) was quantified in AC and AC+ macrophages by fluorescent microscopy (n = 4 images/group). ***P = 0.0002. b, BMDMs were incubated with ACs labeled with PKH67 (a green fluorescent cell dye) for 45 minutes, rinsed, and collected 1 hour later for GLUT1 protein analysis by flow cytometry in AC and AC+ Mφs (n = 3 wells/group). ****P < 0.0001. c, A 2-NBDG uptake assay was performed in BMDMs transfected with siSlc2a1 or scrambled RNA (AC and AC+ Mφs in n = 3 fields of view were quantified for the scrambled vs. siSlc2a1 group; representative images are shown). **P = 0.0034. d,e, BMDMs that had been transfected with siSlc2a1 or scrambled RNA were subjected to Seahorse analysis to measure glycolysis and glycolytic capacity after incubation with or without ACs (n = 11–12 wells/group). ***P = 0.0006, ****P < 0.0001. f, BMDMs were incubated in the absence or presence of ACs for 45 minutes and rinsed, and Slc2a1 expression was measured 1 hour later (n = 4 wells/group). g, Slc2a1 expression was measured in naive versus IFN-γ + LPS-differentiated macrophages (n = 4 wells/group). ****P < 0.0001. h, BMDMs pretreated with the Akt inhibitor (Akti) MK-2206 (5 μM) were incubated in the absence or presence of ACs for 45 minutes, rinsed, and collected 1 hour later for immunoblotting of phosphorylated TXNIP (pTXNIP), total TXNIP (tTXNIP), and β-actin (n = 3 samples/group). ***P = 0.0004. i, BMDMs transfected with siTxnip or scrambled RNA were incubated with PKH26-labeled ACs for 45 minutes, rinsed, and collected 1 hour later for GLUT1 protein analysis in PKH26-AC and PKH26-AC+ Mφs by immunofluorescence microscopy (n = 20 cells/group). ***P = 0.0004. j, 2-NBDG uptake was assayed in BMDMs transfected with siTxnip or scrambled RNA (n = 3 images/group). **P = 0.0017, ****P < 0.0001. k, BMDMs transfected with siTxnip or scrambled RNA were subjected to Seahorse analysis (n = 11–12 wells/group). ****P < 0.0001. All values are means ± s.e.m., and significance was determined by two-tailed Student’s t-test (a,b,f,g) or two-way ANOVA with Fisher’s LSD post hoc analysis (c,e,hk). n.s., not significant (P > 0.05).
Fig. 3 |
Fig. 3 |. Akt-stimulated PFKFB2 is essential for efferocytosis-induced glycolysis, but is not important for glycolysis in inflammatory macrophages.
a, BMDMs were incubated in the absence or presence of ACs for 45 minutes, rinsed, and collected 1 hour later for immunoblotting of phosphorylated PFKFB2 and total PFKFB2. The relative amounts of phospho- and total PFKFB2 versus β-actin were quantified by band densitometry (n = 3 samples/group). **P = 0.0033, ****P < 0.0001. b, BMDMs were incubated in the absence or presence of ACs for 45 minutes, rinsed, and collected 3 hours later for analysis of fructose-1,6-bisphosphate (fructose-1,6-BP) levels by LC–MS/MS (n = 6 wells/group) ****P < 0.0001. c, The same analysis as described in a was performed in BMDMs after a pulse–chase time course experiment with ACs (see Fig. 1a) (n = 4 samples/ group). **P = 0.0070 for total PFKFB2, **P = 0.0045 for phospho-PFKFB2. d, Naive BMDMs and BMDMs polarized towards a pro-inflammatory phenotype with IFN-γ and LPS for 24 hours were collected and immunoblotted for phospho-PFKFB2, total PFKFB2, and β-actin (n = 3–4 samples/group). **P = 0.0039. e, BMDMs were pretreated with or without the Akt inhibitor MK-2206 (5 μM) before incubation with or without ACs for 45 minutes. Macrophages were collected 1 hour later for immunoblotting of phospho-Akt (Ser473), total Akt, phospho-PFKFB2, total PFKFB2, and β-actin. The relative level of phospho-PFKFB2 versus β-actin was quantified by band densitometry (n = 3 samples/group). **P = 0.0063. f,g, BMDMs transfected with siPfkfb2 or scrambled RNA were subjected to Seahorse analysis to measure glycolysis (ECAR) and oxidative phosphorylation (oxygen-consumption rate, OCR) 1 hour after incubation with or without ACs (n = 11–12 wells/group). *P = 0.035, **P = 0.0032, ****P < 0.0001. h, Naive BMDMs and BMDMs polarized towards a pro-inflammatory phenotype by treatment with IFN-γ and LPS for 24 hours were subjected to Seahorse analysis to measure glycolysis (ECAR) (n = 15–16 wells/group). ****P < 0.0001. All values are means ± s.e.m., and significance was determined by two-tailed Student’s t-test (ad) or two-way ANOVA with Fisher’s LSD post hoc analysis (eh). n.s., not significant (P > 0.05).
Fig. 4 |
Fig. 4 |. Glycolysis-derived lactate mediates continual efferocytosis by promoting apoptotic cell binding.
a, BMDMs were incubated with PKH67-labeled ACs (green) for 45 minutes, rinsed, and treated with 2-DG (10 mM) with or without lactate (LA; 25 mM) or dichloroacetate (DCA; 10 mM). After 2 hours, macrophages were incubated with PKH26-labeled ACs (red) for 45 minutes, and the number of PKH67+PKH26+ Mφs (green and red; white arrows) was quantified relative to PKH67+ Mφs (green only), which reflects continual efferocytosis (n = 3 wells/group). *P = 0.021, **P = 0.0084. b, A continual efferocytosis assay was conducted as described in a, but with pHrodo-labeled ACs and BMDMs transfected with siPfkfb2, siLdha, or scrambled RNA (n = 3 wells/group). *P = 0.016, **P = 0.0010. c, A continual efferocytosis assay was conducted in BMDMs transfected with siPfkfb2 or scrambled RNA and that were incubated with or without lactate (10 mM) between the first and second round of ACs (n = 3 wells/ group). *P = 0.016, **P = 0.0042. d, A continual efferocytosis assay was conducted with HMDMs transfected with siPfkfb2 or scrambled RNA and incubated with or without lactate (10 mM) between the first and second round of ACs (n = 3 wells/ group). *P = 0.039, **P = 0.0040. e, A continual efferocytosis assay was conducted in BMDMs incubated with or without the Akt inhibitor MK-2206 (5 μM) and lactate (10 mM) between the first and second rounds of ACs (n = 3 wells/group). *P = 0.011, **P = 0.0035, ***P = 0.0002. f, A continual efferocytosis assay was conducted in BMDMs transfected with siTxnip or scrambled RNA and then incubated with or without MK-2206 (5 μM) between the first and second rounds of ACs (n = 3 wells/group). *P = 0.017, **P = 0.0038, ***P = 0.0002. g, A continual efferocytosis assay was conducted in BMDMs with or without pretreatment with cytochalasin D (5 μM) 15 minutes before addition of the second round of ACs (n = 4 wells/group). *P = 0.025, **P = 0.0087, ***P = 0.0010 (control versus 2-DG), ***P = 0.0002 (2-DG versus 2-DG + LA). All values are means, and significance was determined by one-way ANOVA (ae) or two-way ANOVA (f,g) with Fisher’s LSD post hoc analysis.
Fig. 5 |
Fig. 5 |. Glycolysis-derived lactate promotes cell surface expression of the efferocytosis receptors MerTK and LRP1 through calcium signaling.
a,b, BMDMs (Mφs) from wild-type (PFKwt) and PFKFB2-mutant (PFK,ut) mice were incubated with PKH26-labeled ACs for 45 minutes, rinsed, and fixed 1 hour later for immunostaining of MerTK (a) and LRP1 (b) and quantification of mean fluorescent intensity (MFI) in AC+ macrophages (n = 20–30 cells/group). *P = 0.018, **P = 0.0057, ***P = 0.0008, ****P < 0.0001. c, A continual efferocytosis assay was conducted with siPfkfb2-treated BMDMs incubated with or without lactate (10 mM) and control IgG (15 μg/ml) or anti-MerTK and anti-LRP1 antibodies (10 and 5 μg/mL, respectively) between the first and second rounds of ACs (n = 3 wells/group). *P = 0.012, **P = 0.0022. d, BMDMs were pretreated with 2-DG (10 mM) with or without lactate (10 mM), and were incubated with PKH26-labeled ACs. After 30 minutes, macrophages were rinsed, incubated with fluo-8-AM (5 μM), and subjected to live-cell imaging to analyze fluo-8-AM MFI in AC versus AC+ Mφs (n = 4 images/group). **P = 0.0011, ****P < 0.0001. e,f, siPfkfb2-treated BMDMs were incubated with PKH26-labeled ACs for 45 minutes, rinsed, and then incubated with or without BAPTA-AM (10 μM) and lactate (10 mM), followed by immunostaining of MerTK and LRP1 (n = 30 cells/group). **P = 0.0049, ***P = 0.0004, ****P < 0.0001. g, A continual efferocytosis assay was performed in siPfkfb2-treated BMDMs incubated with or without BAPTA-AM (10 μM) 30 minutes before adding the second round of ACs (n = 3 wells/group). *P = 0.024, **P = 0.0014. All values are means ± s.e.m., and significance was determined by one-way ANOVA (a,b) or two-way ANOVA (cg) with Fisher’s LSD post hoc analysis. n.s., not significant (P > 0.05). h, Proposed mechanism of efferocytosis-induced glycolysis through TXNIP-dependent GLUT1 regulation and PFKFB2. Efferocytosis stimulates Akt-dependent phosphorylation of TXNIP, resulting in stabilization of GLUT1 at the cell membrane and increased glucose uptake to fuel glycolysis. Additionally, Akt phosphorylates PFKFB2, which activates the glycolytic enzyme phosphofructokinase-1 (PFK-1) via fructose-2,6-bisphosphate (Fru-2,6-P2), thereby increasing glycolysis. As a result, lactate availability increases, which facilitates the continued uptake of apoptotic cells by increasing the cell surface expression of the efferocytosis receptors MerTK and LRP1 in a calcium-dependent manner.
Fig. 6 |
Fig. 6 |. Mice with defective hematopoietic PFKFB2 show impaired macrophage efferocytosis of apoptotic thymocytes.
a, Irradiated C57BL/6J mice were implanted with bone marrow from wild-type or PFKFB2-mutant mice and subjected to a dexamethasone–thymus assay 4 weeks later. The immunoblot shows the absence of phospho-PFKFB2 in BMDMs from PFKFB2-mutant mice (n = 3 mice/group). Eighteen hours after dexamethasone injection, tissues were collected for analyses. b, Thymi from wild-type (WT) and PFKFB2-mutant (Mut) mice were weighed (n = 6–7 mice/group). **P = 0.0030. c, Cells were counted to determine thymus cellularity (n = 6–7 mice/group). **P = 0.0023. d,e, Flow cytometry was used to quantify the number of Annexin V+ (apoptotic) cells (d) and F4/80+ macrophages (e) in the thymus (n = 6–7 mice/group). *P = 0.013 for Annexin V+ cells and *P = 0.045 for F4/80+ macrophages. f, As a measure of efferocytosis, the ratio of Mac2+ macrophage-associated ACs:free ACs (TUNEL+) was determined by immunofluorescence microscopy (IFM) (n = 7 mice/group). *P = 0.041. g, The relative area of necrosis (areas devoid of intact nuclei and/ or areas with pronounced nuclear debris) in the thymic cortex was measured in H&E-stained sections (n = 7 mice/group). *P = 0.021. h,i, Mean fluorescent intensities (MFI) of MerTK (h) and LRP1 (i) were measured in Mac2+ AC+ (that is, TUNEL+) macrophages by IFM (n = 7 mice/group). *P = 0.019, **P = 0.0092. Horizontal lines indicate the means ± s.e.m., and significance was determined by two-tailed Student’s t-test (a,ci) or two-tailed Mann–Whitney U test (b).

Comment in

References

    1. Raymond MH et al. Live cell tracking of macrophage efferocytosis during Drosophila embryo development in vivo. Science 375, 1182–1187 (2022). - PMC - PubMed
    1. Morioka S, Maueröder C & Ravichandran KS Living on the edge: efferocytosis at the interface of homeostasis and pathology. Immunity 50, 1149–1162 (2019). - PMC - PubMed
    1. Doran AC, Yurdagul A Jr. & Tabas I Efferocytosis in health and disease. Nat. Rev. Immunol. 20, 254–267 (2020). - PMC - PubMed
    1. Vandivier RW, Henson PM & Douglas IS Burying the dead: the impact of failed apoptotic cell removal (efferocytosis) on chronic inflammatory lung disease. Chest 129, 1673–1682 (2006). - PubMed
    1. Yurdagul A Jr., Doran AC, Cai B, Fredman G & Tabas IA Mechanisms and consequences of defective efferocytosis in atherosclerosis. Front. Cardiovasc. Med. 4, 86 (2017). - PMC - PubMed

Publication types

LinkOut - more resources