. 2023 Oct;41(10):1474-1482.
doi: 10.1038/s41587-023-01662-6. Epub 2023 Feb 16.

Telomere-to-telomere assembly of diploid chromosomes with Verkko

Affiliations

Telomere-to-telomere assembly of diploid chromosomes with Verkko

Mikko Rautiainen et al. Nat Biotechnol. 2023 Oct.

Abstract

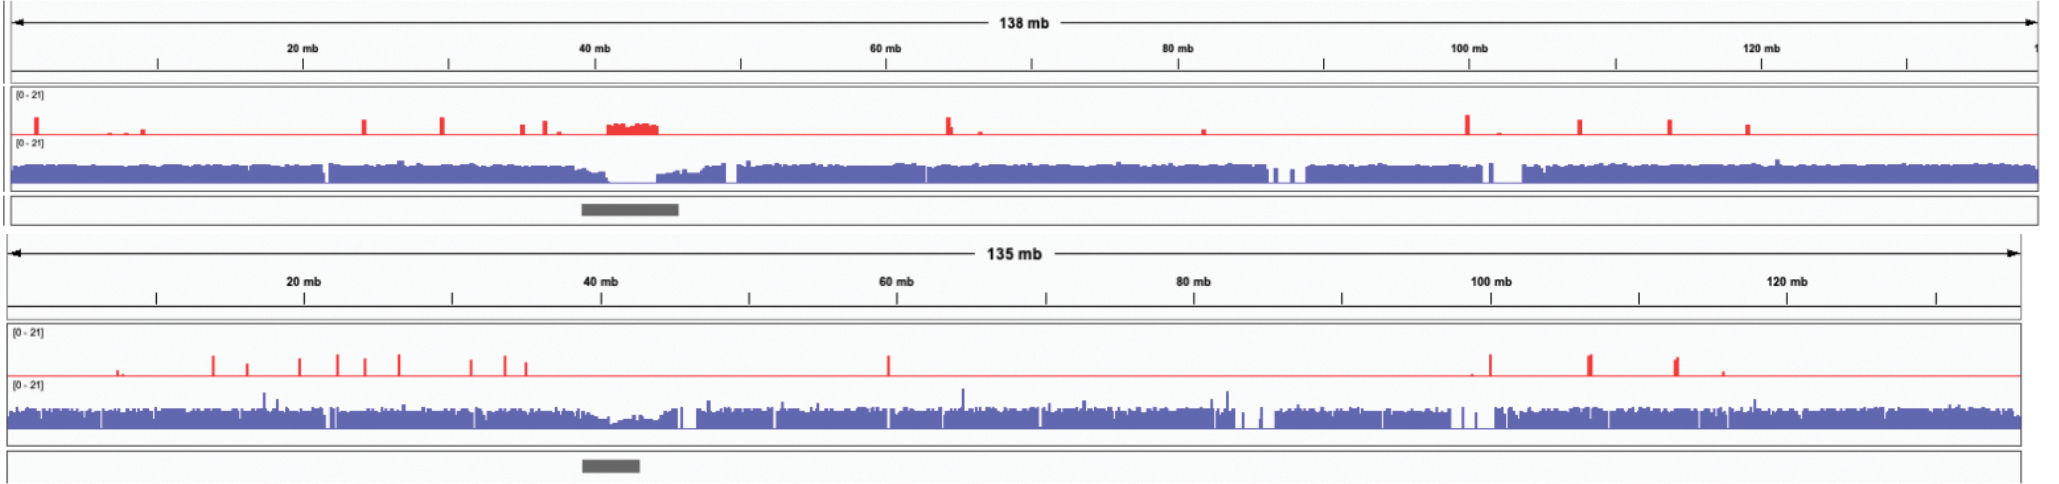
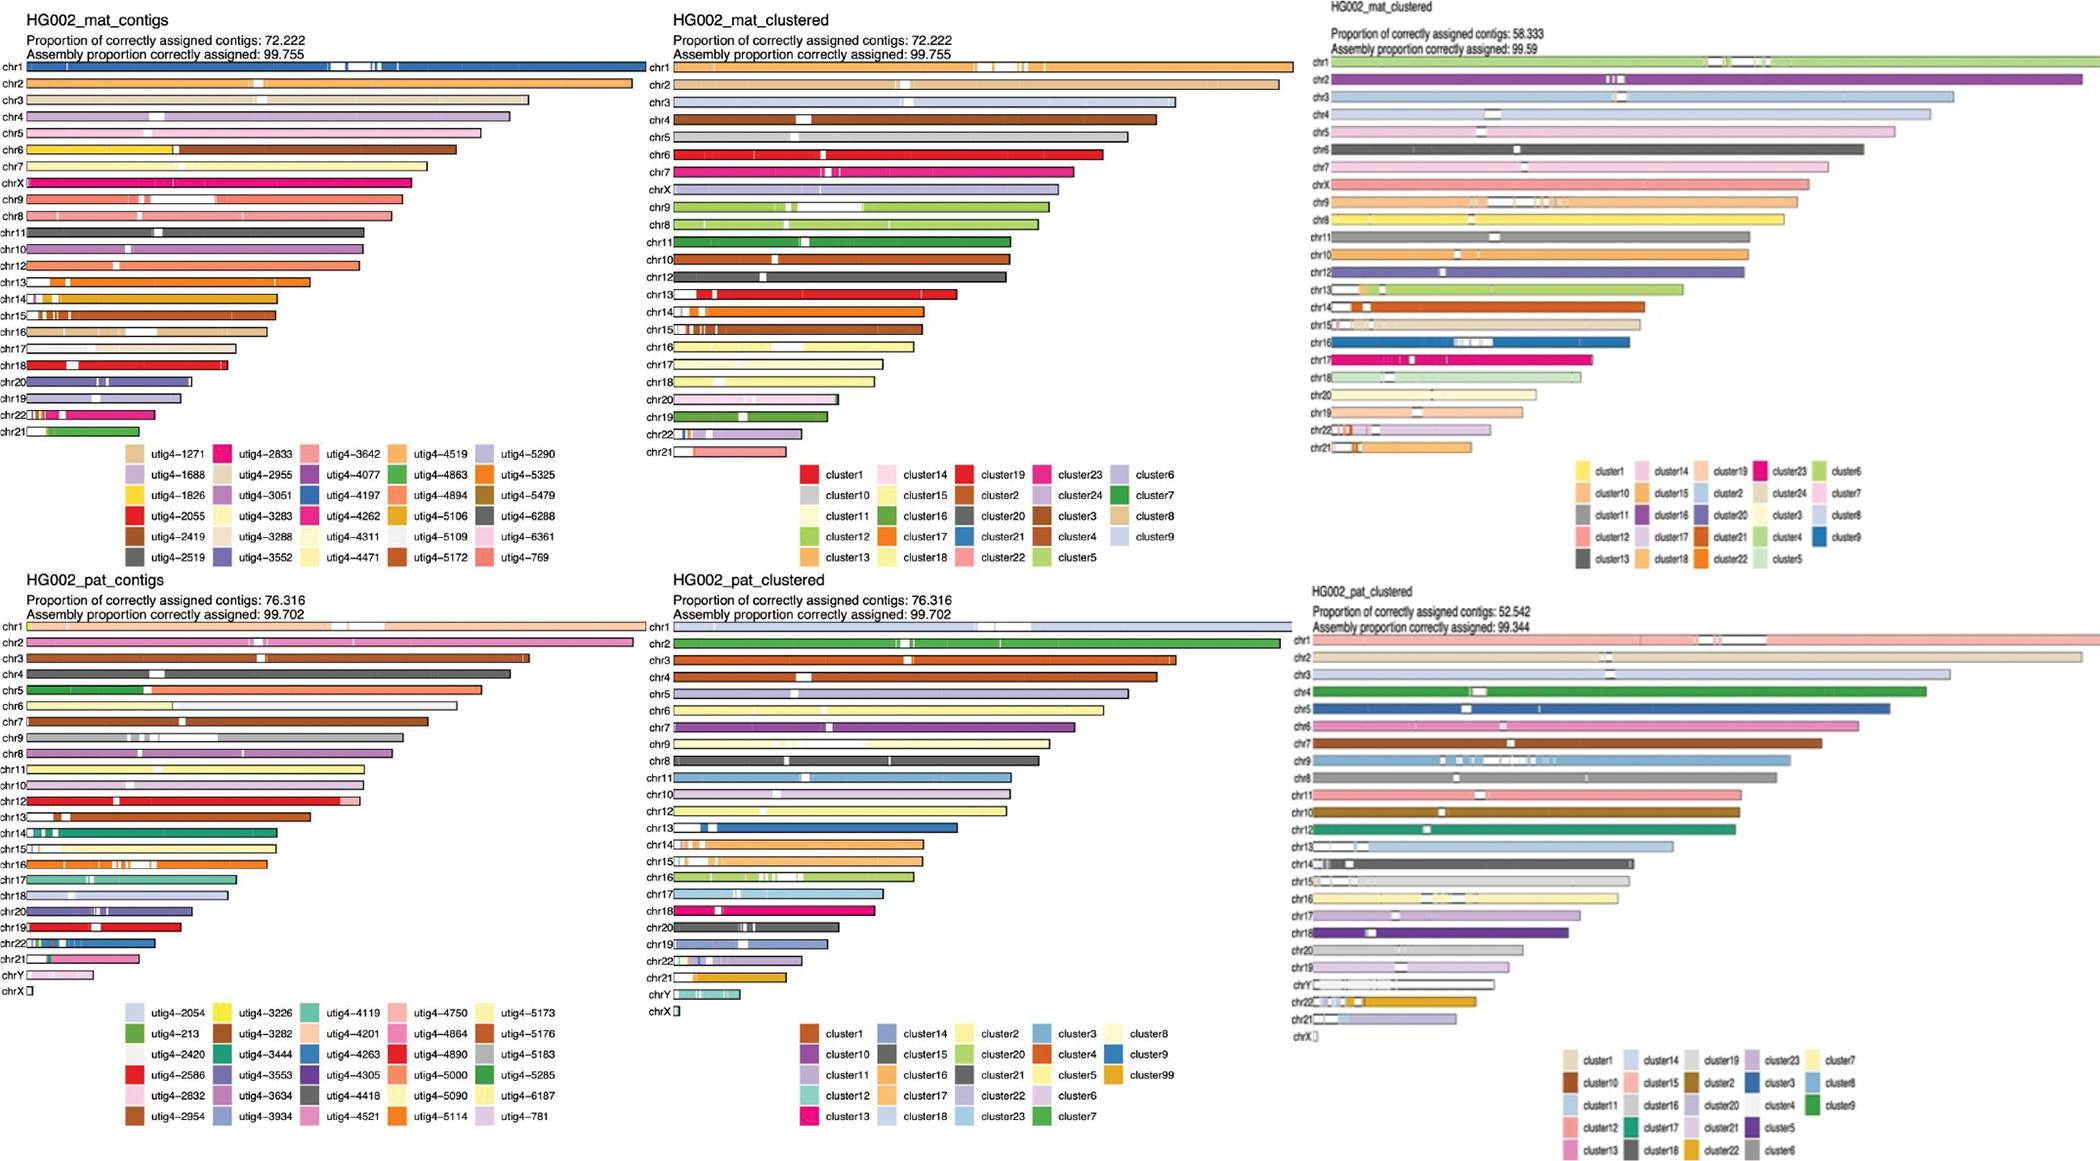
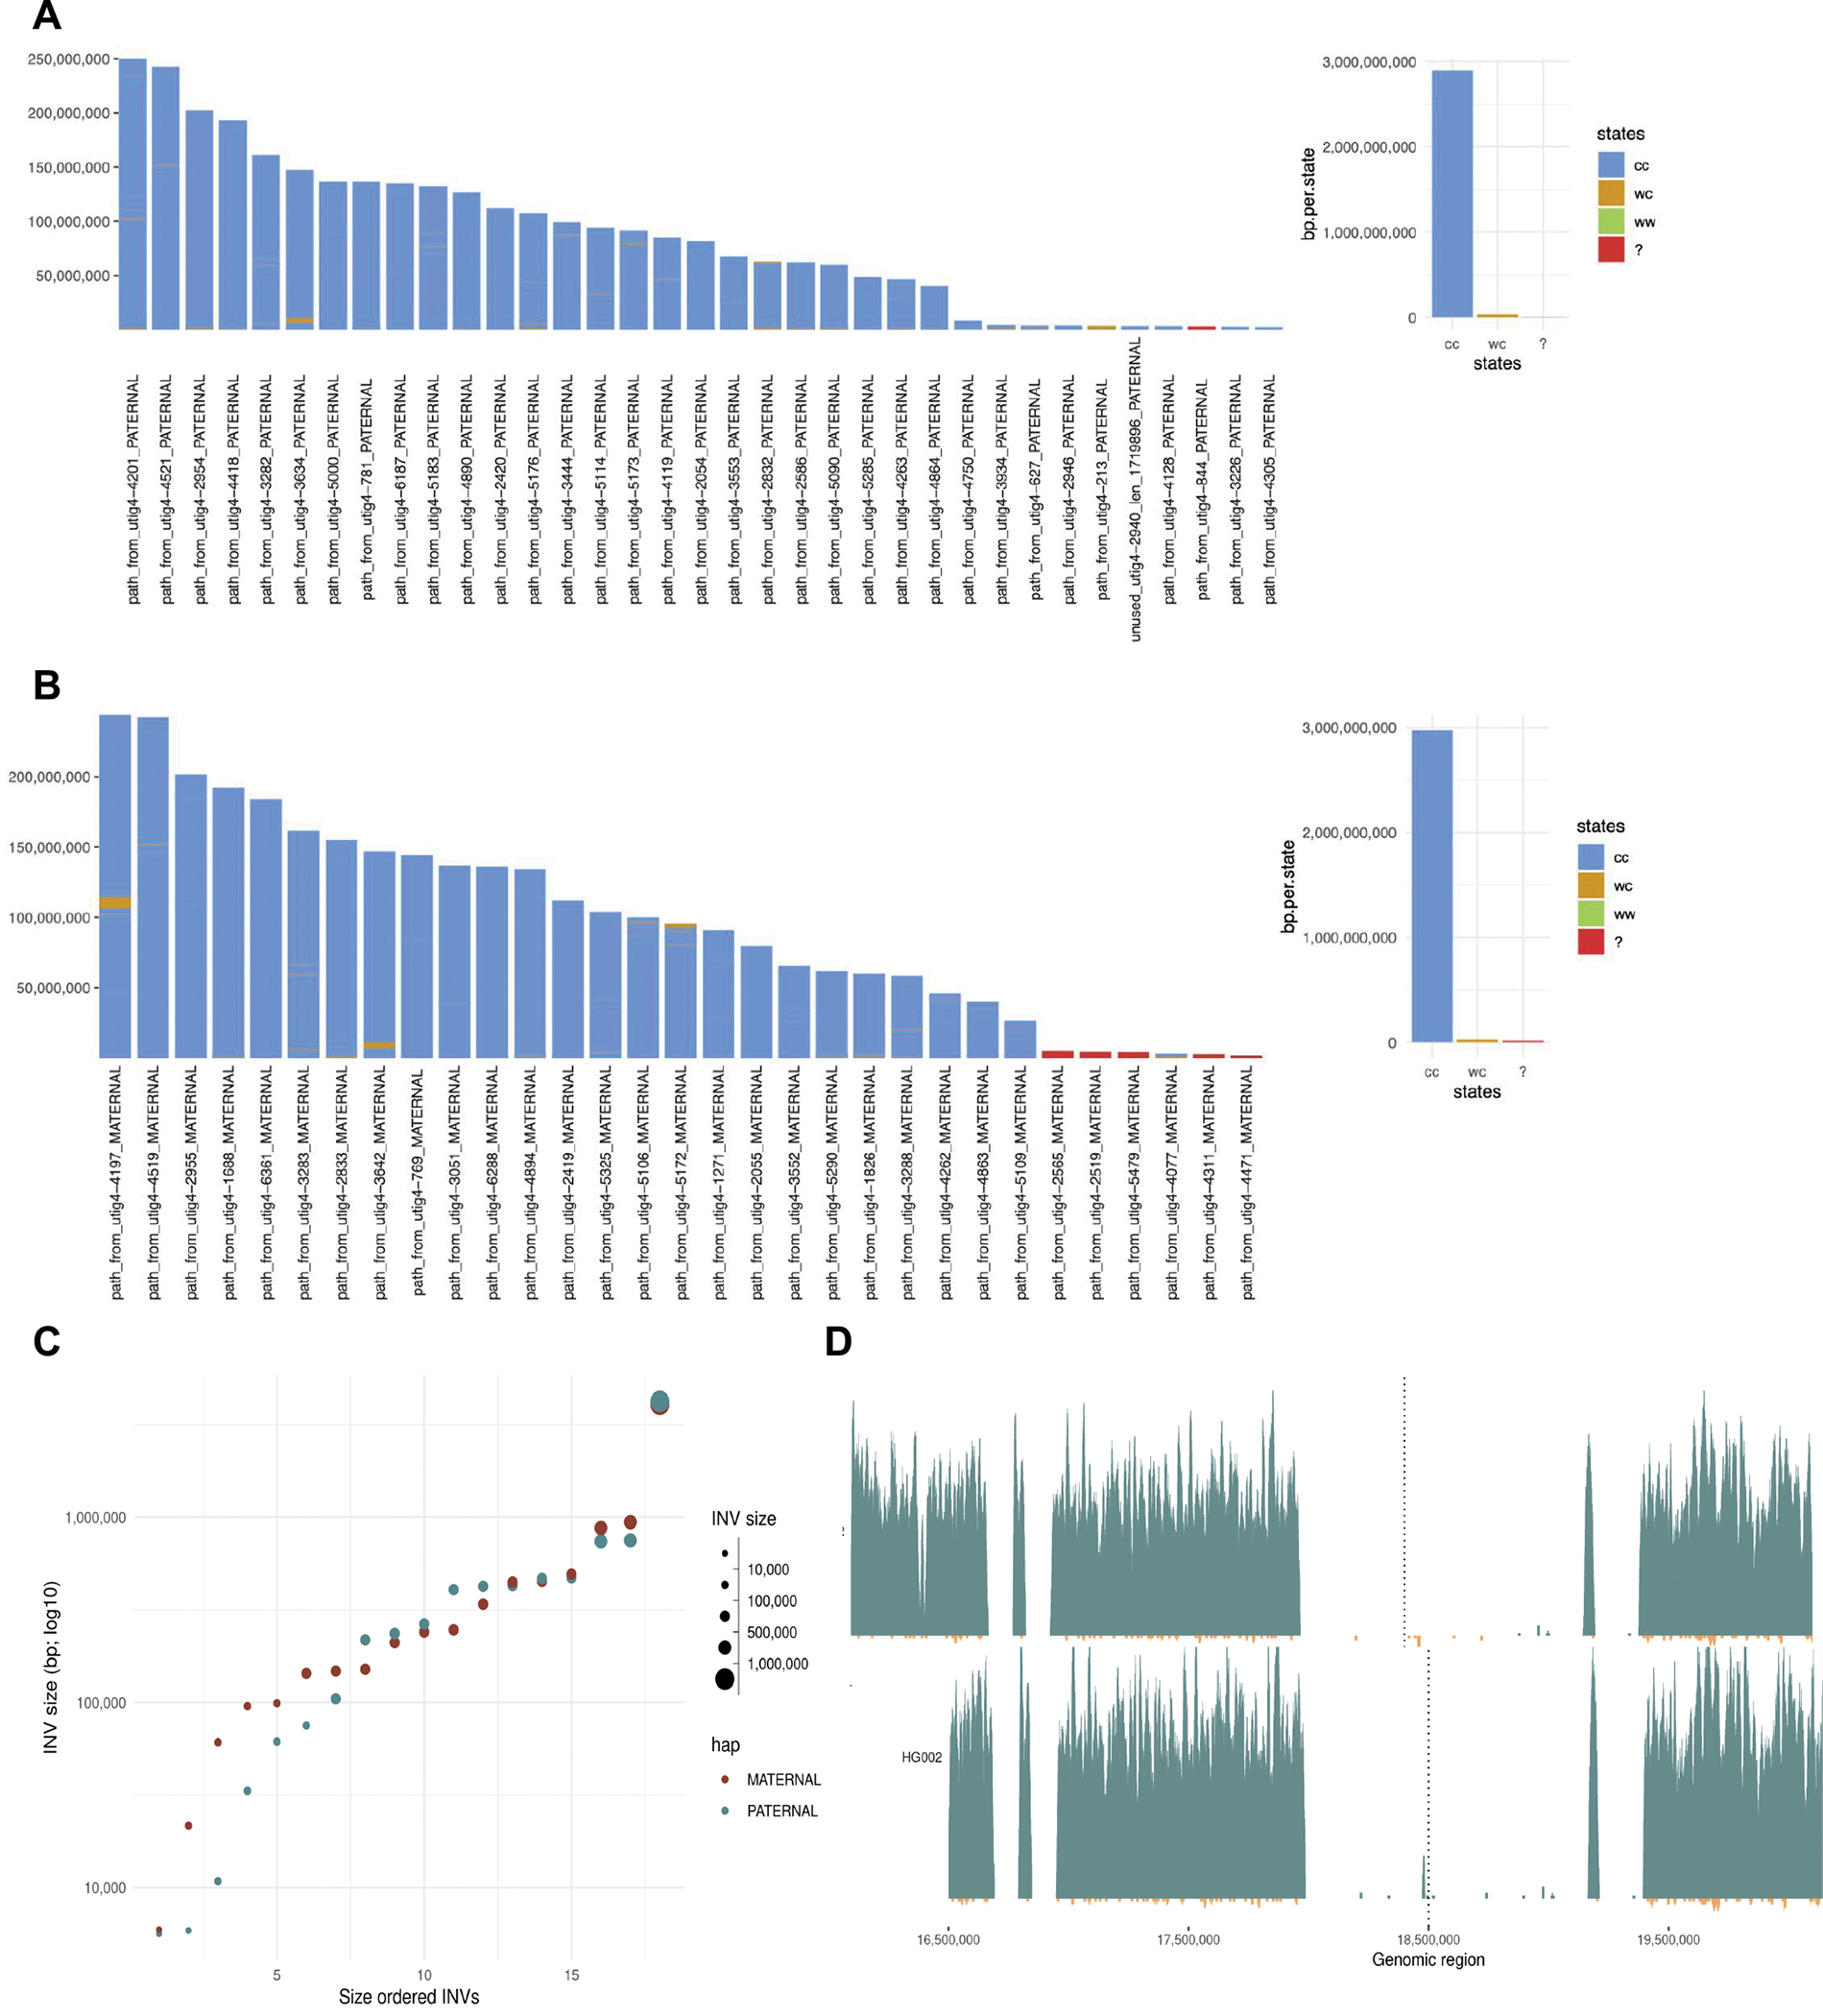
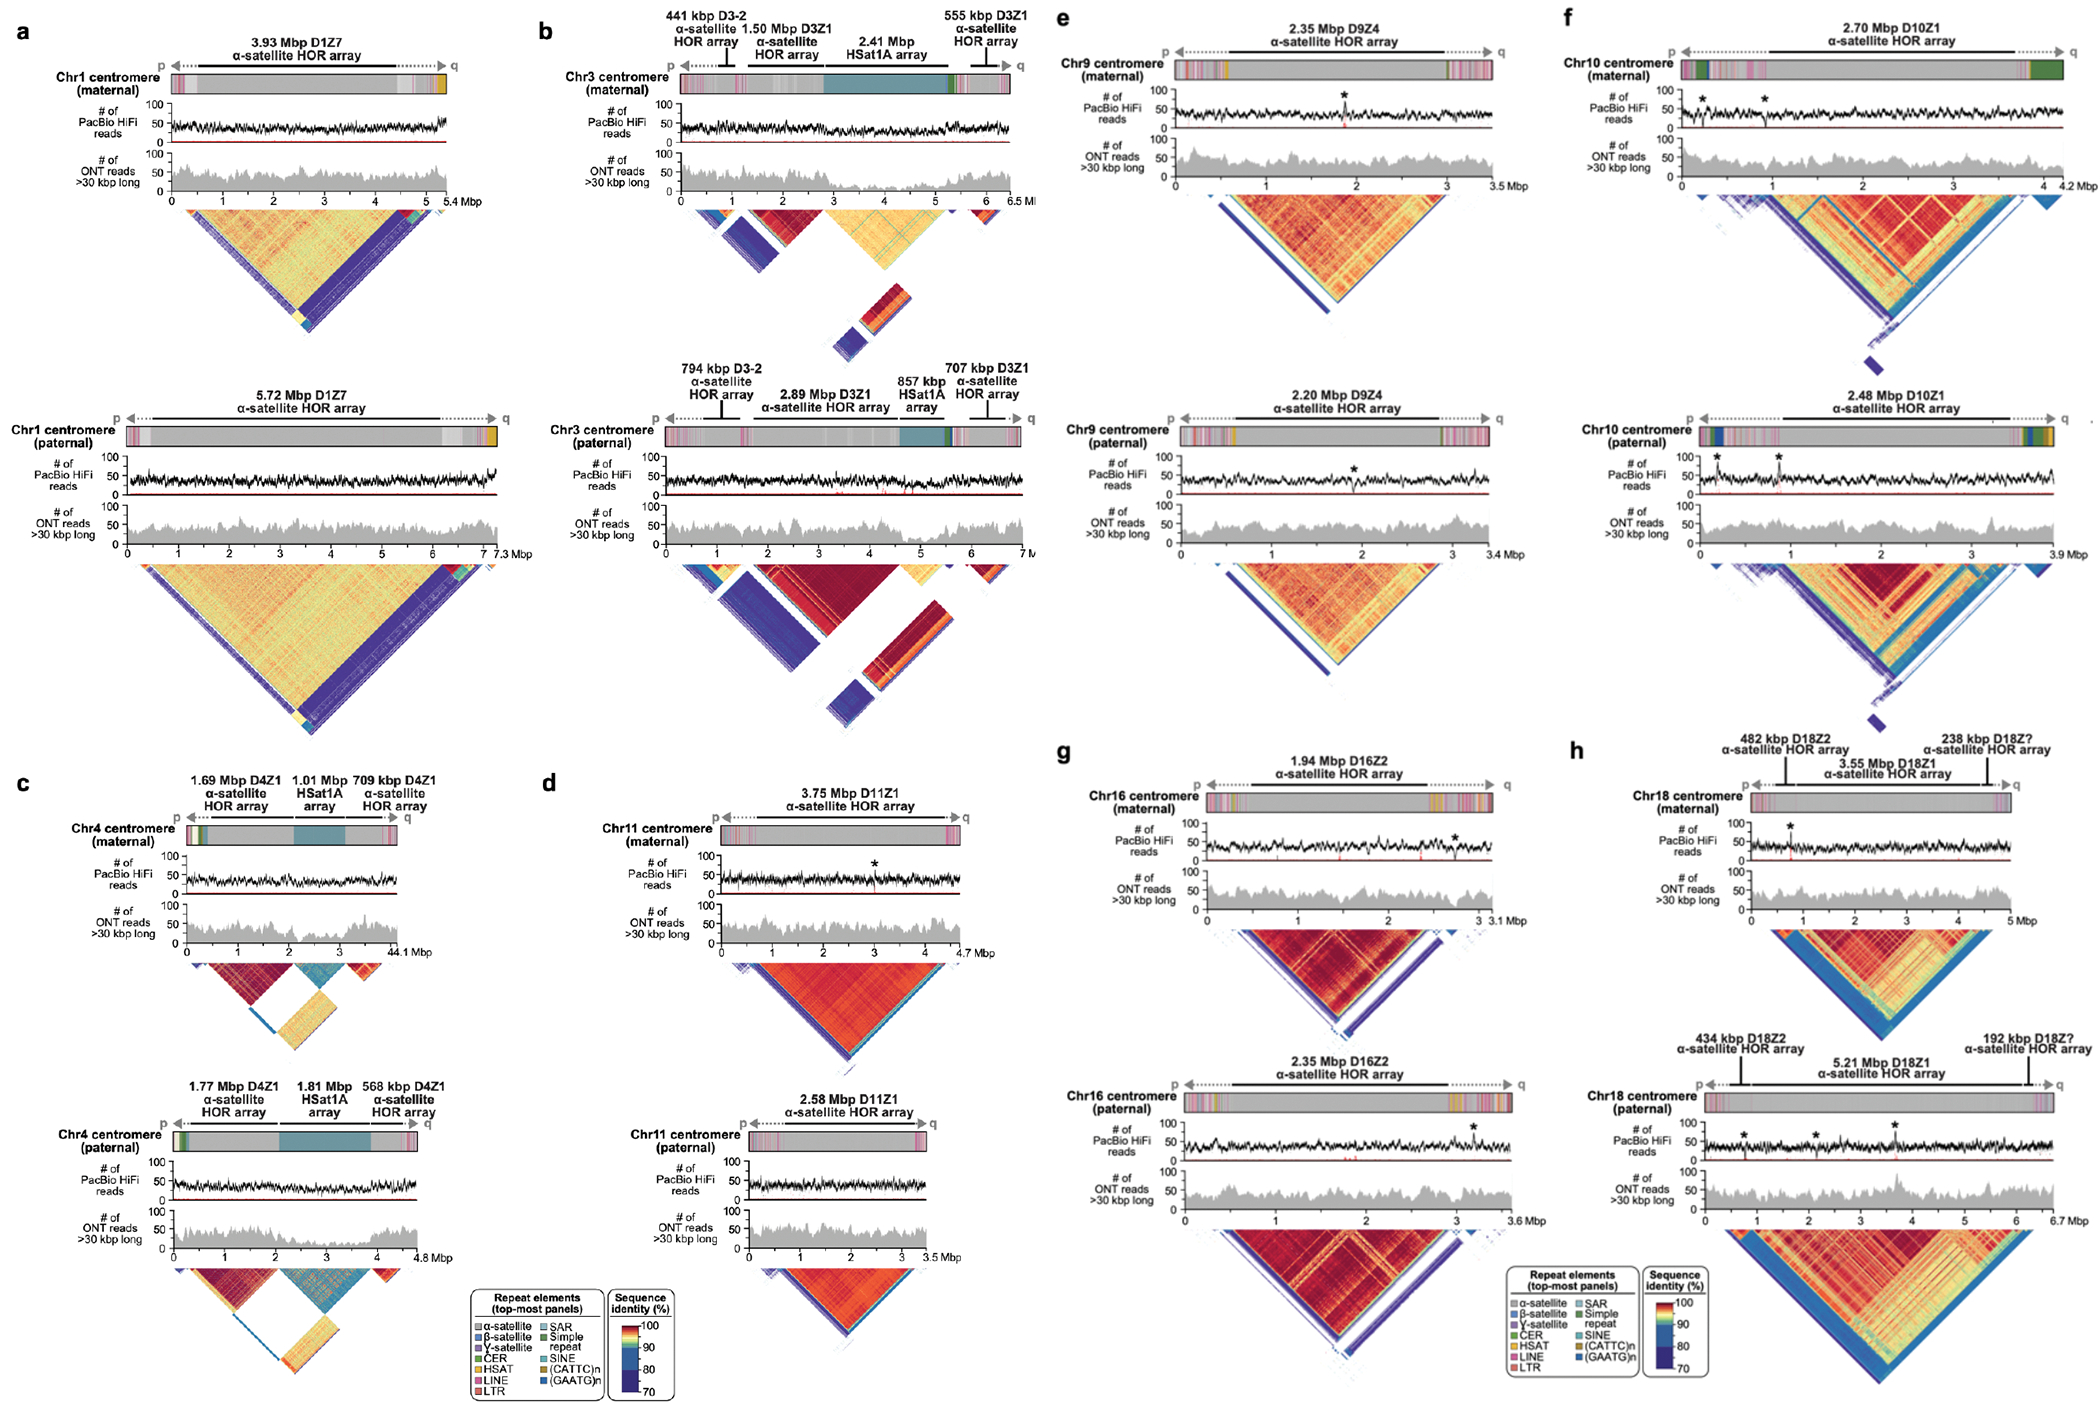
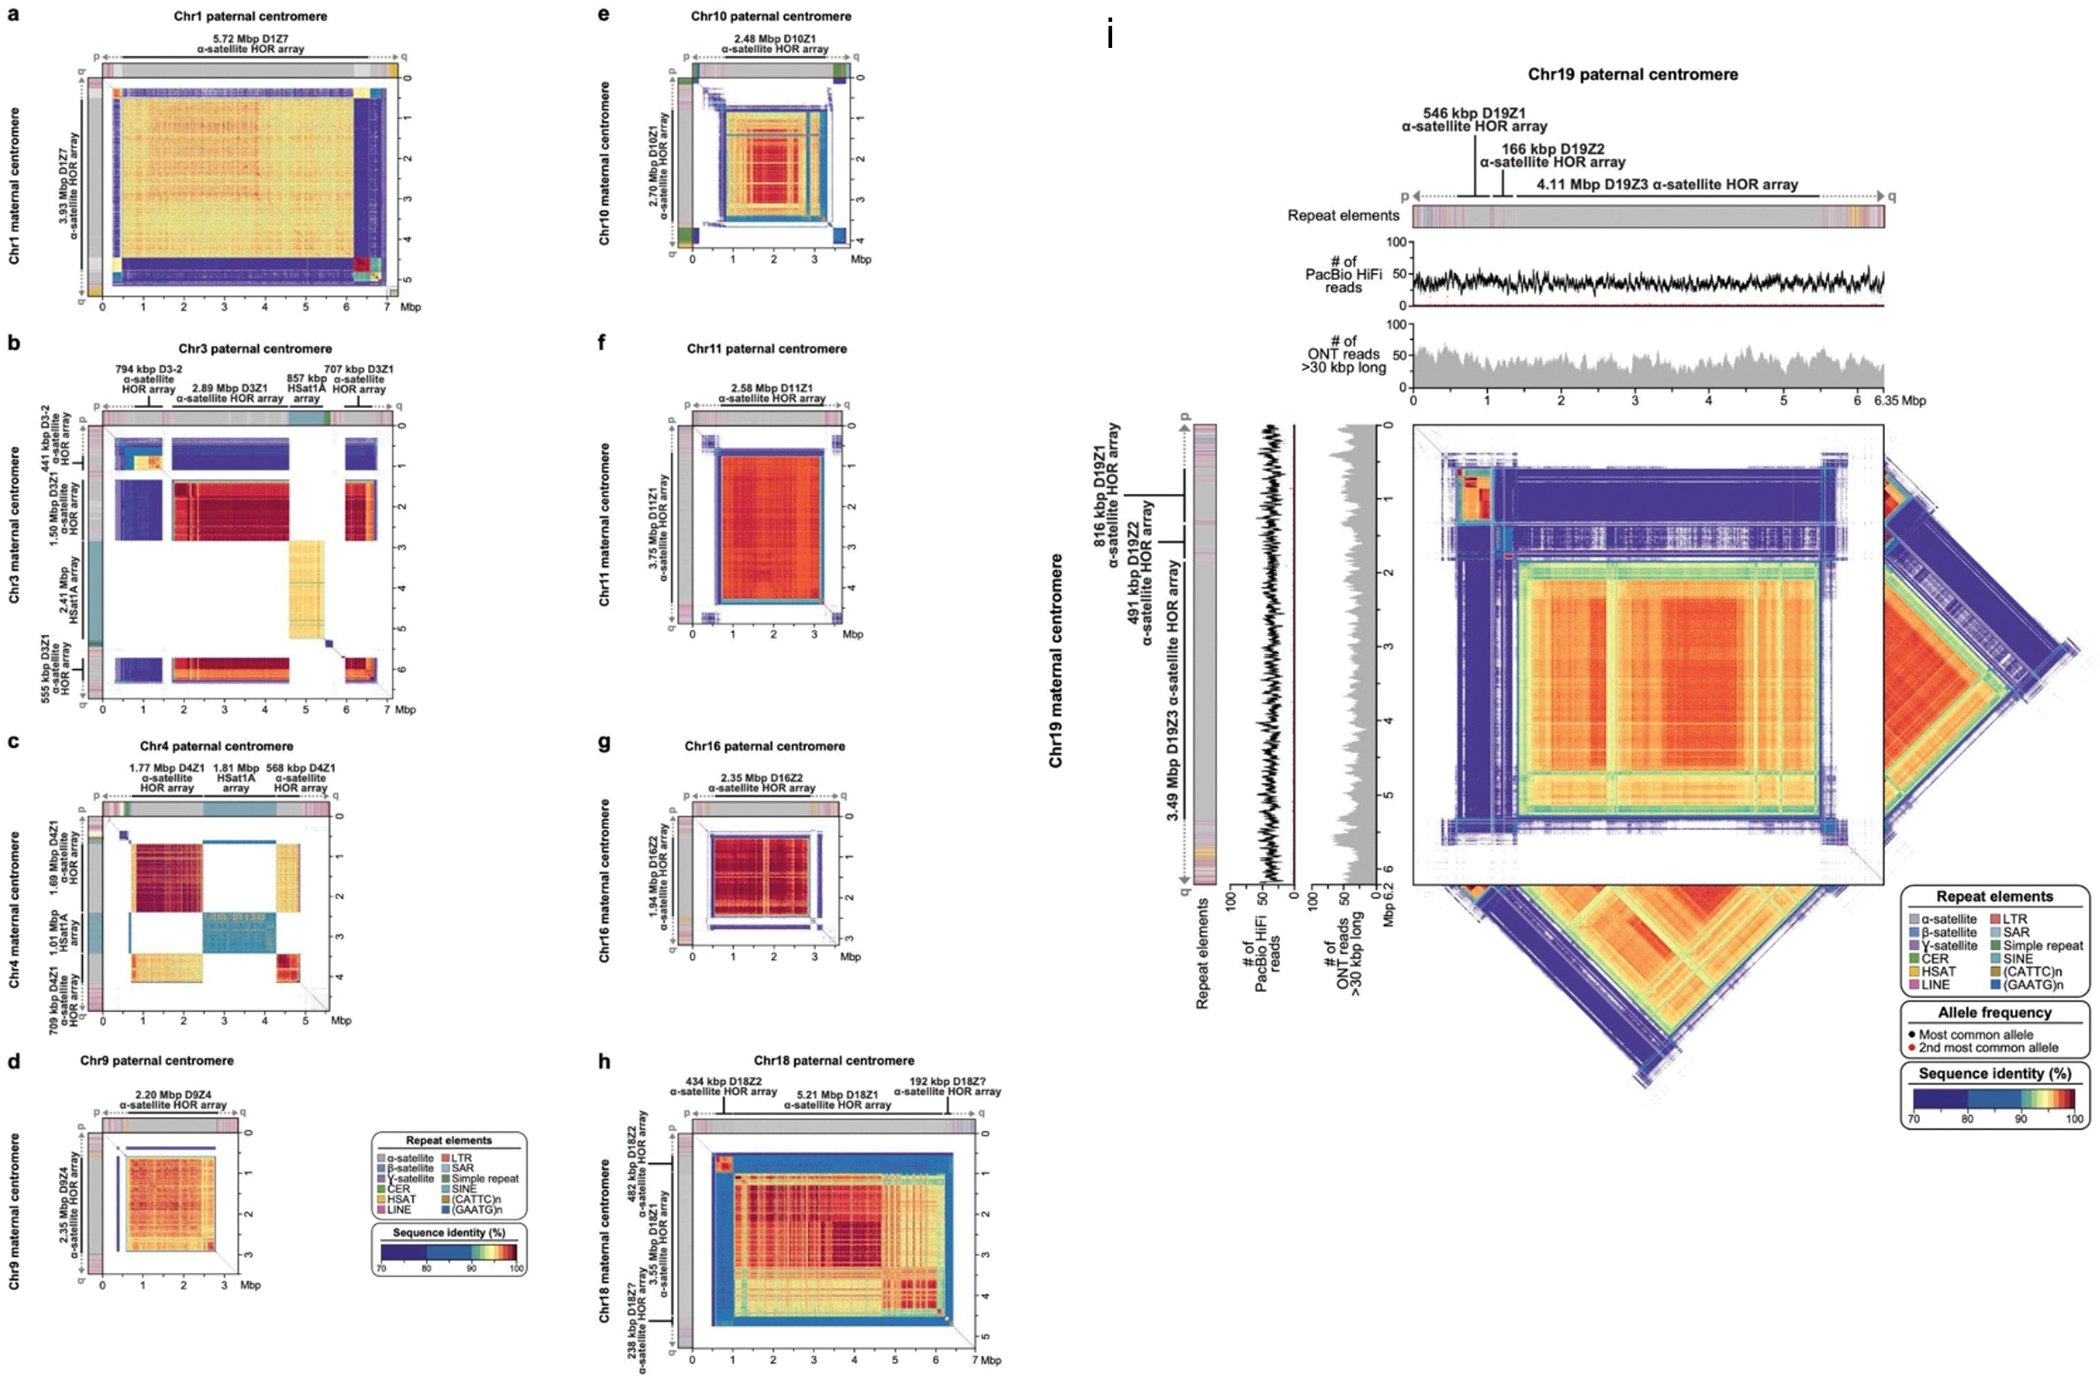
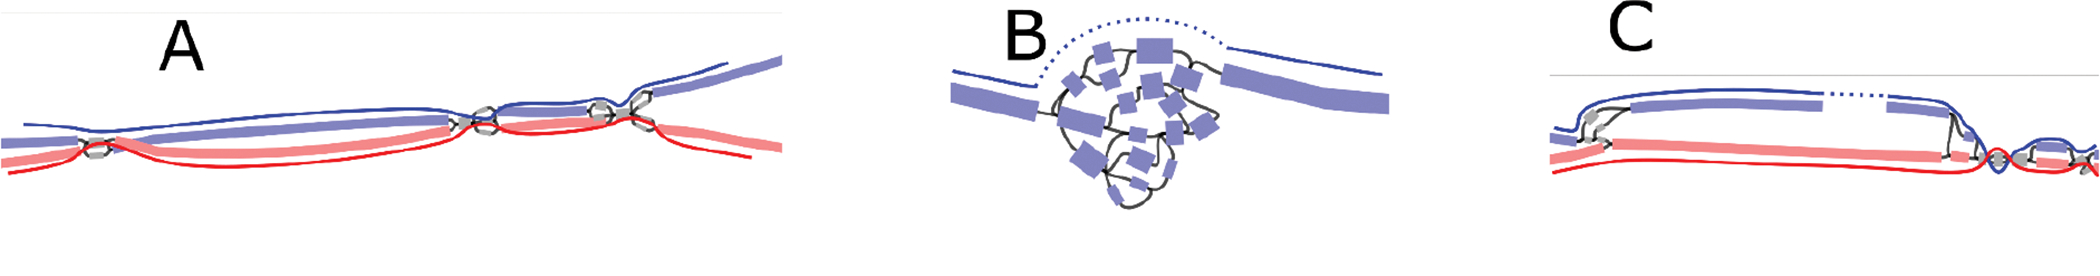
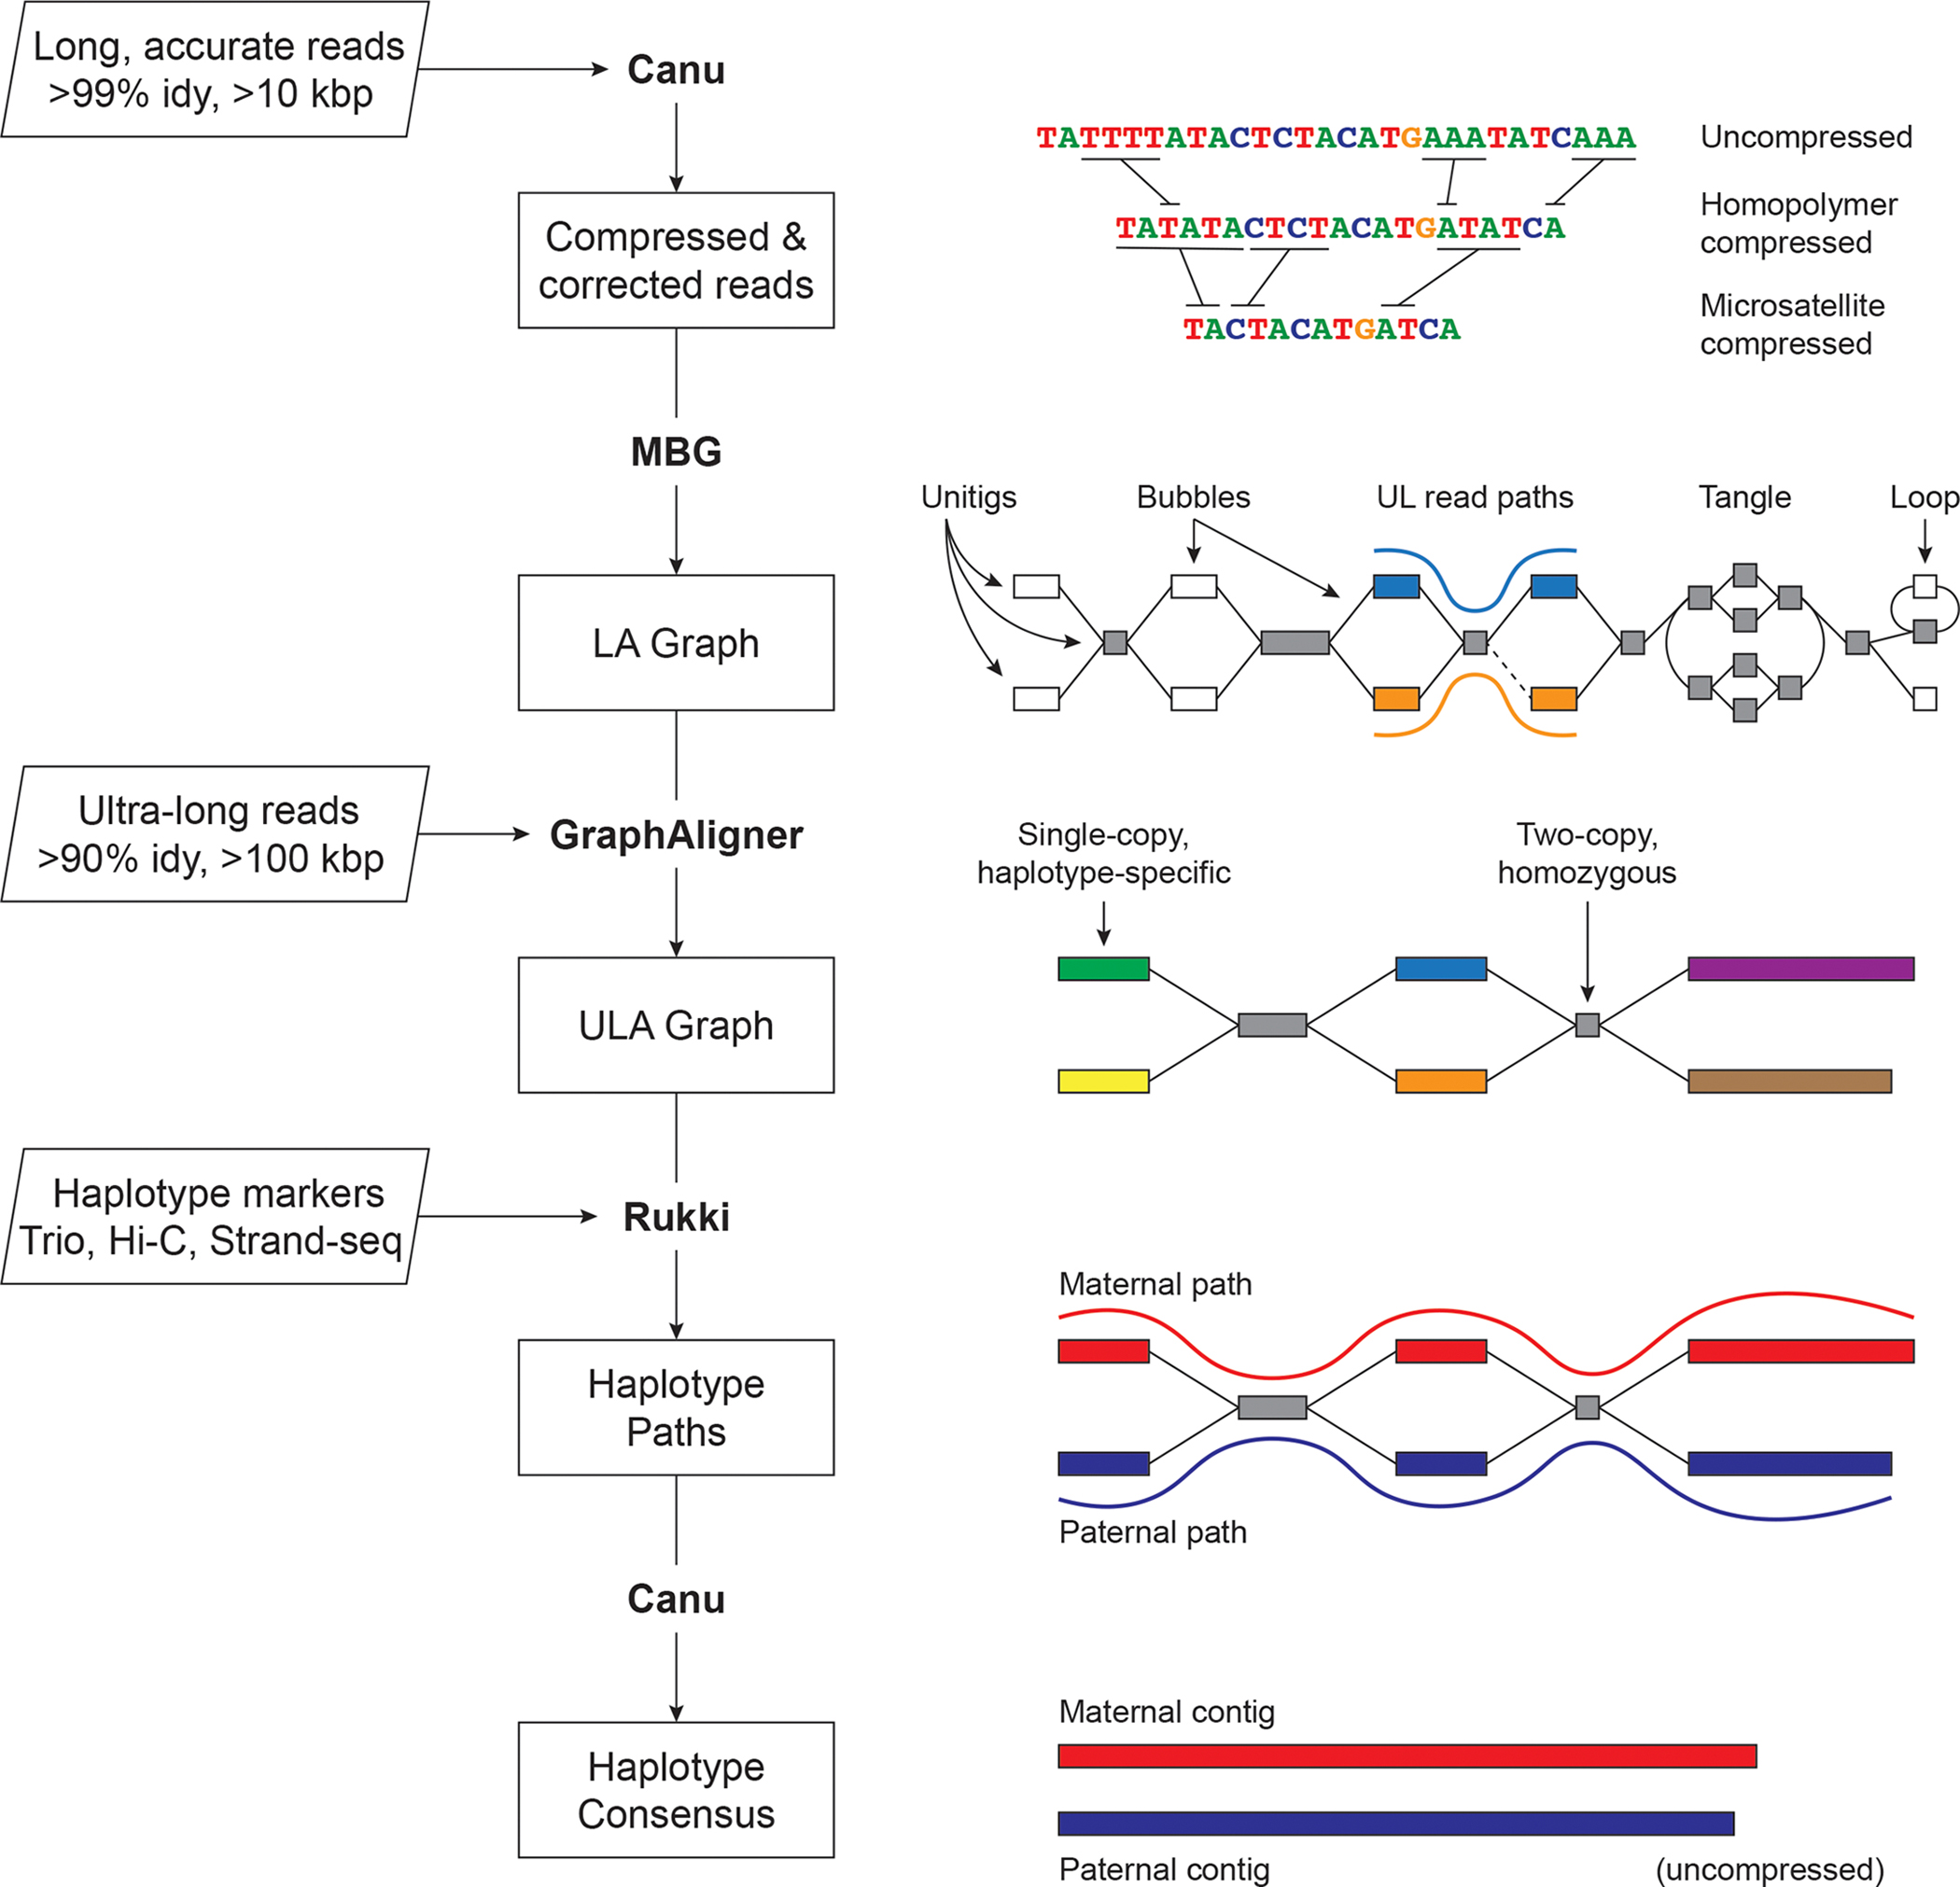
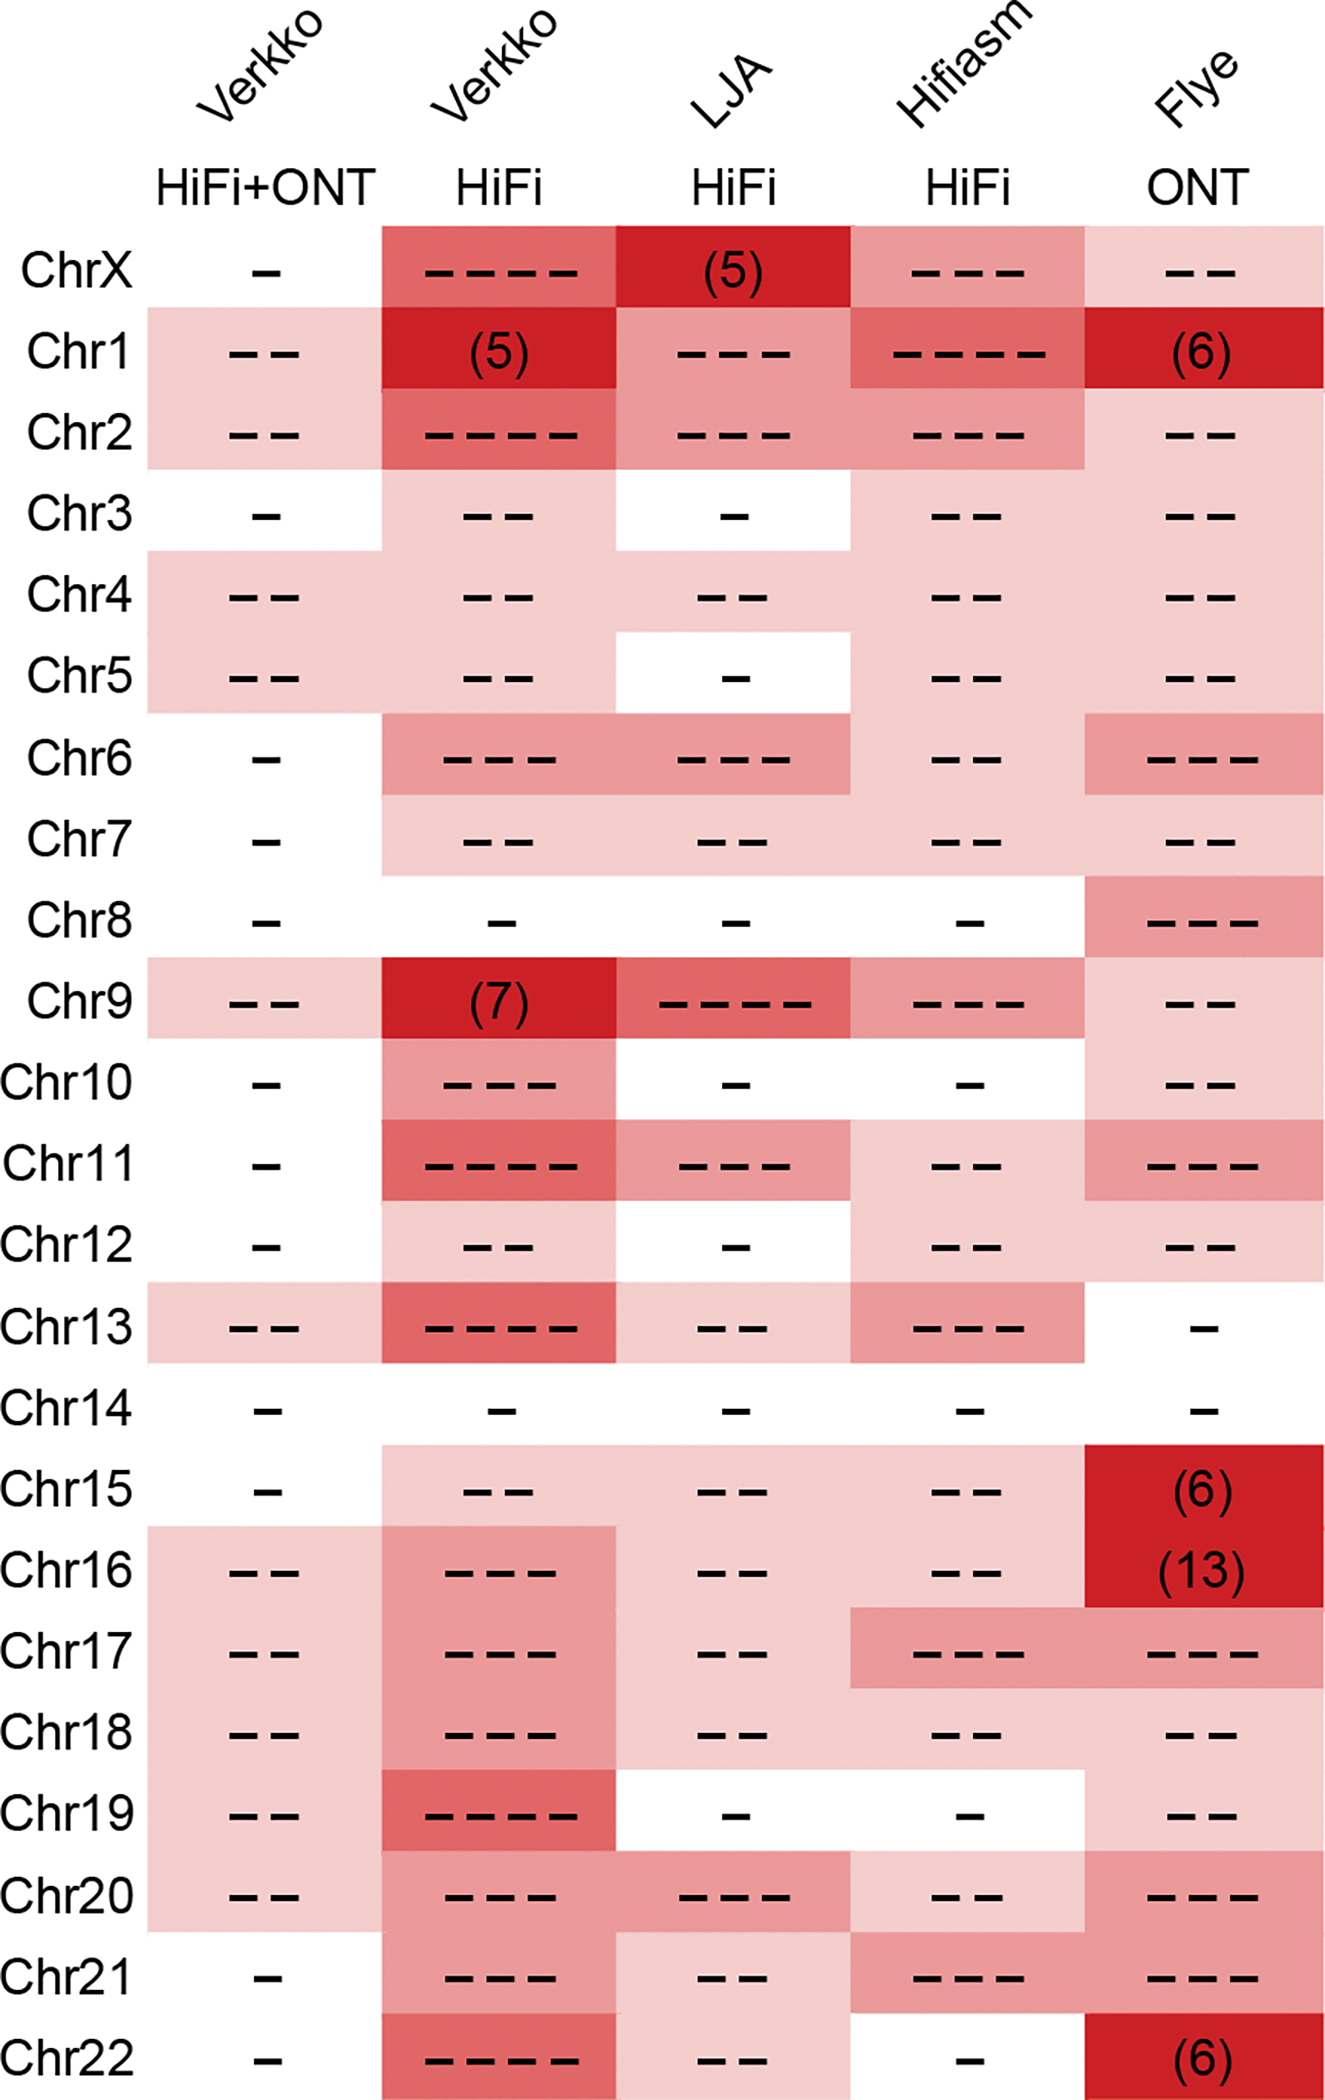
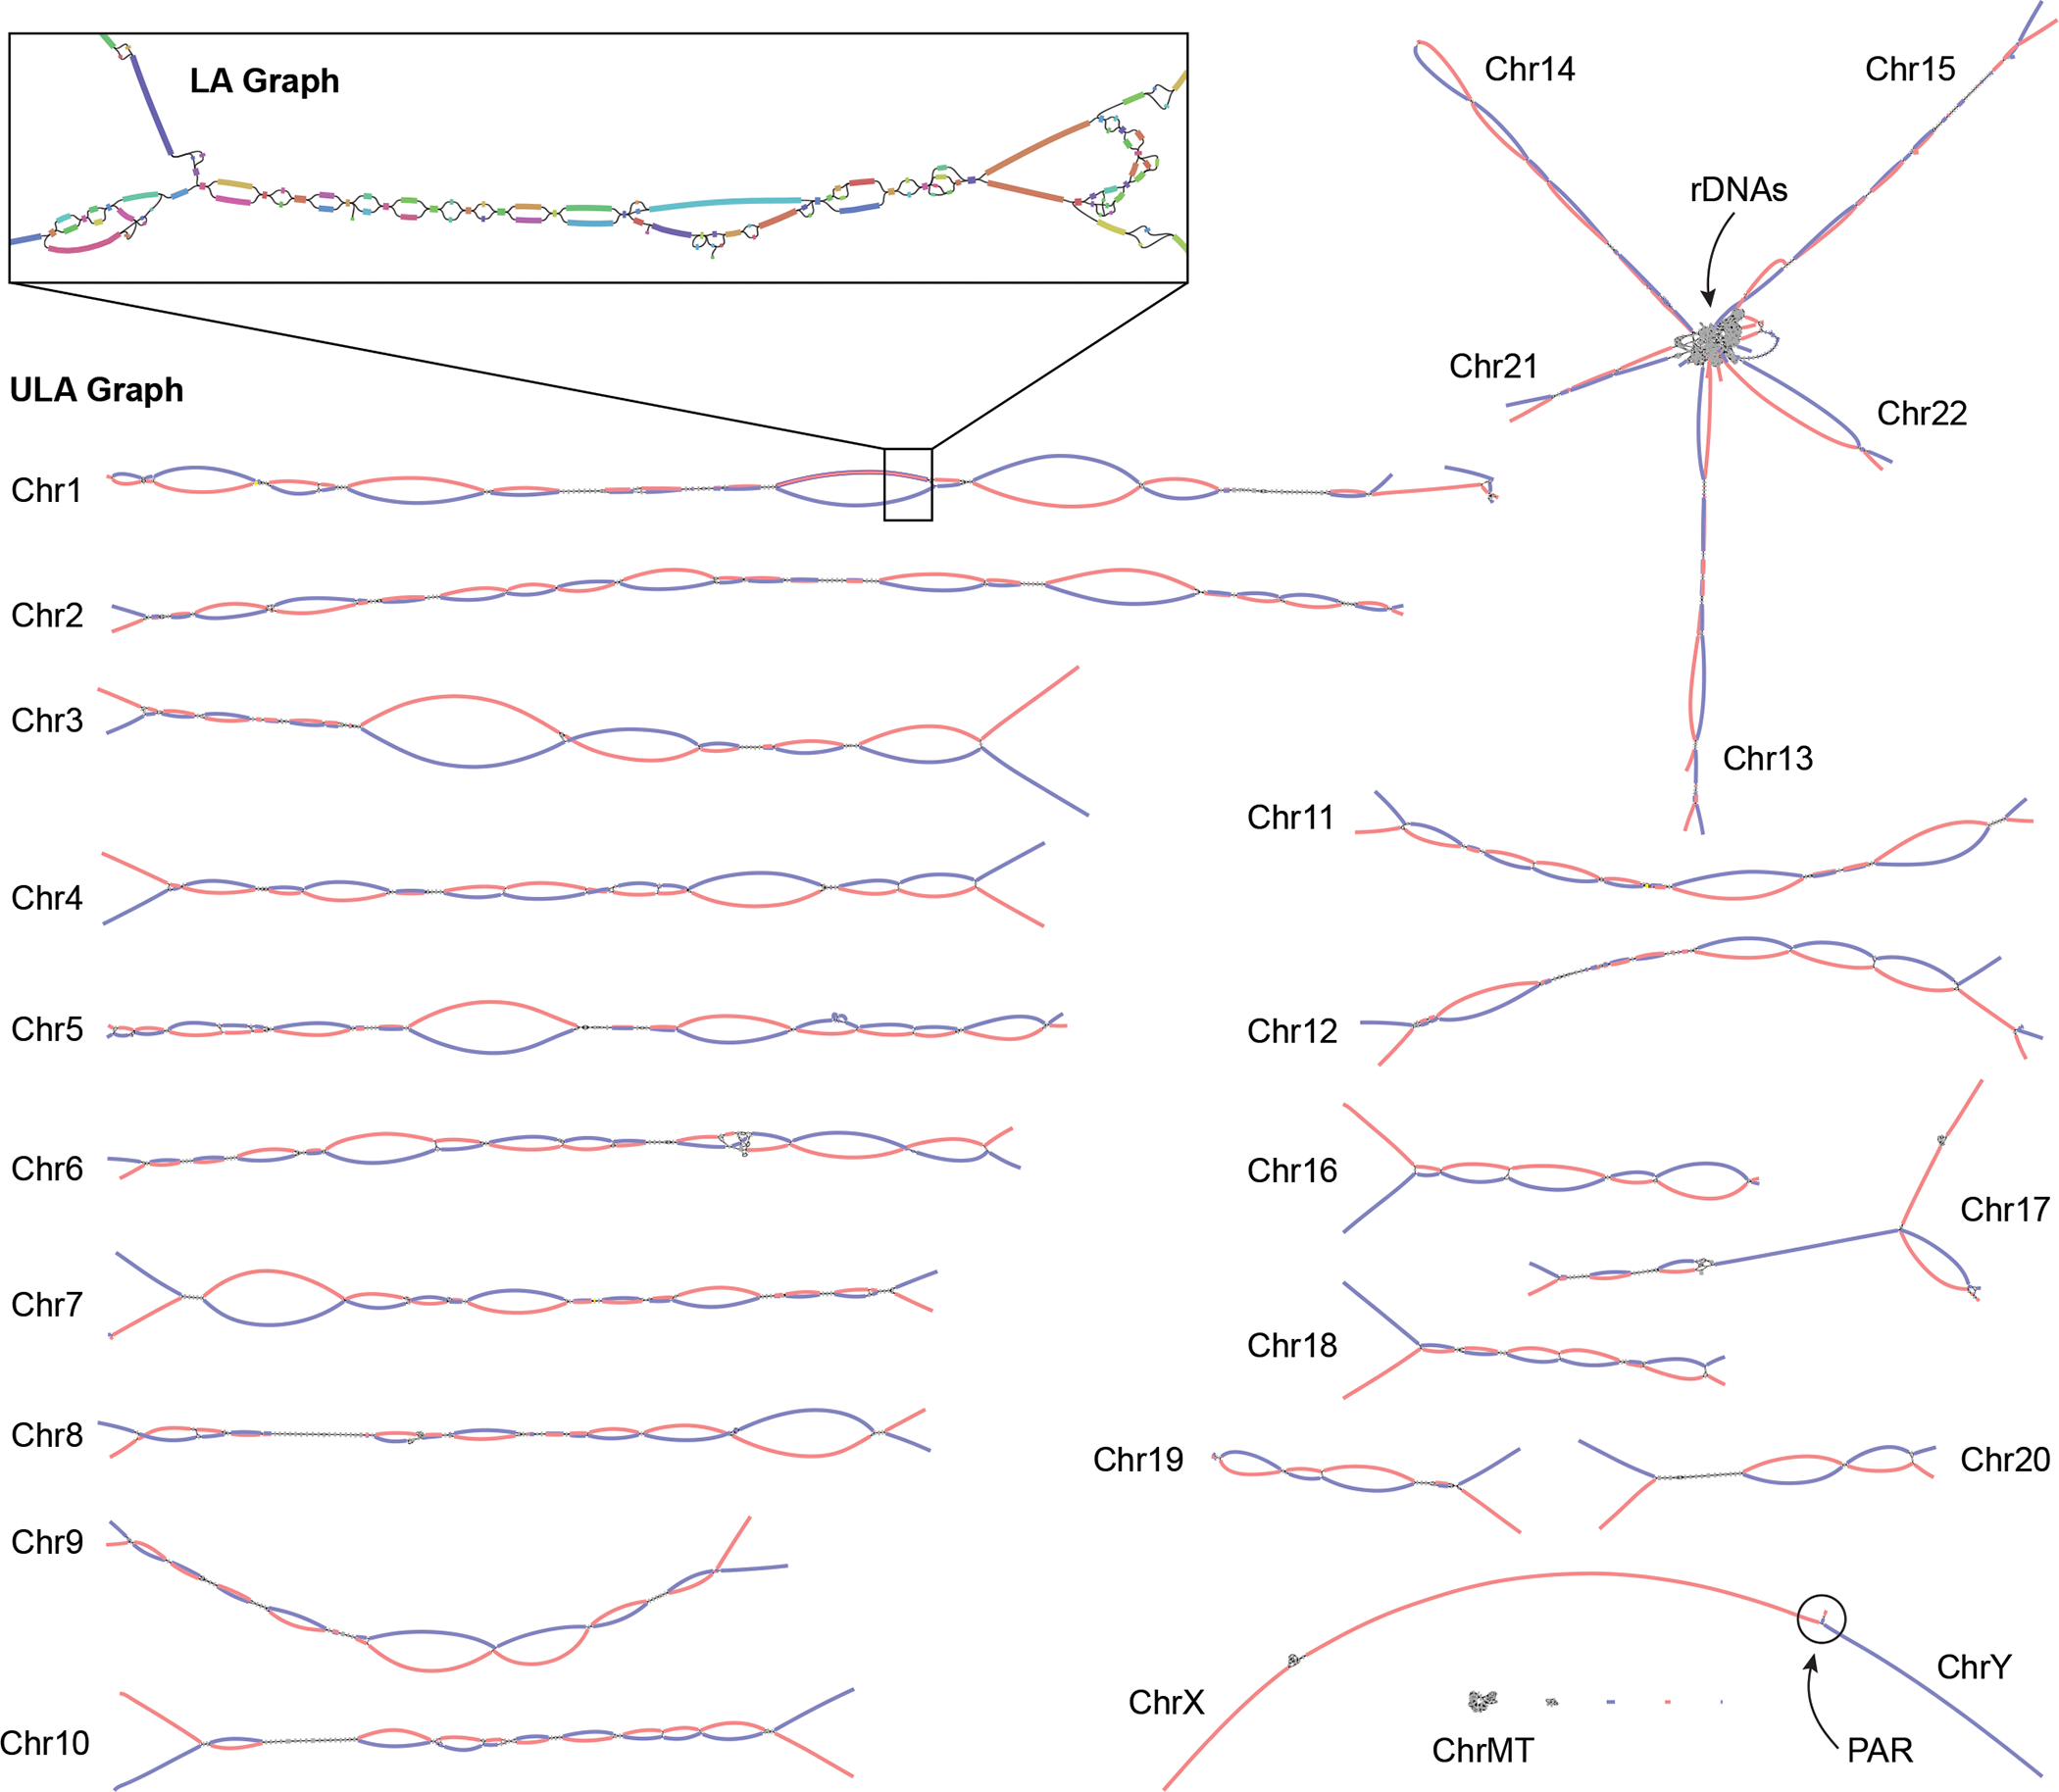
The Telomere-to-Telomere consortium recently assembled the first truly complete sequence of a human genome. To resolve the most complex repeats, this project relied on manual integration of ultra-long Oxford Nanopore sequencing reads with a high-resolution assembly graph built from long, accurate PacBio high-fidelity reads. We have improved and automated this strategy in Verkko, an iterative, graph-based pipeline for assembling complete, diploid genomes. Verkko begins with a multiplex de Bruijn graph built from long, accurate reads and progressively simplifies this graph by integrating ultra-long reads and haplotype-specific markers. The result is a phased, diploid assembly of both haplotypes, with many chromosomes automatically assembled from telomere to telomere. Running Verkko on the HG002 human genome resulted in 20 of 46 diploid chromosomes assembled without gaps at 99.9997% accuracy. The complete assembly of diploid genomes is a critical step towards the construction of comprehensive pangenome databases and chromosome-scale comparative genomics.


Conflict of interest statement

Competing interest declaration

EEE is on the scientific advisory board of DNAnexus, Inc. SK has received travel funds to speak at events hosted by Oxford Nanopore Technologies. SN is an employee of Oxford Nanopore Technologies. The remaining authors declare no competing interests.

Figures

Extended Data Figure 1.
Extended Data Figure 1.. A. thaliana chromosome unitigs in Verkko (left) vs published assembly chromosomes evaluated by VerityMap (right).
From top to bottom, Chr1, Chr2, Chr3, Chr4, and Chr5. VerityMap compares the spacing of unique k-mers within the HiFi reads to the spacing observed in the assembly. Whenever there is a disagreement, the plot shows a spike at the discrepant location. The x-axis indicates the coordinates along the assembly contig or scaffold while the y-axis shows the fraction of disagreeing reads (0–100%). A disagreement greater than 50% is likely not a heterozygous variant but a true error in the assembly. The BED file produced by VerityMap also indicates the size of the discrepancy, estimated from the difference in k-mer spacing between the reads and the assembly.
Extended Data Figure 2.
Extended Data Figure 2.. Verkko CHM13 assembly sub-graphs.
A. The remaining unresolved regions in CHM13 chromosomes 5, 9 and 16, visualized using Bandage, with the correct resolution marked in red paths. Left: Chr5 has a spurious edge causing a cycle, and three spurious low-coverage nodes which were not removed by bubble popping since they are a part of the cycle. Middle: Chr9 has a spurious edge. Right: Chr16 has two spurious edges, and one missing edge (dashed red curve). The spurious non-genomic edges are caused by noisy ONT alignments switching between highly similar repeats in the LA graph, while the missing edge is caused by low HiFi coverage. B. rDNA cluster mixing in CHM13 chromosomes 13, 14, and 21, visualized using Bandage. Each chromosome has a separate rDNA tangle. There are two cross-chromosomal connections by erroneous low coverage (<4x) nodes circled in red. For all three chromosomes, the remainder of the p and q arms are contained in the long unitigs shown.
Extended Data Figure 3.
Extended Data Figure 3.. VerityMap discrepant reads plot for CHM13 HiFi and ONT unitigs assembled by Verkko (left) and CHM13 v1.1 (right).
A. The assemblies for Chromosome 4. The Verkko assembly has no regions where a large fraction of reads are deviated even though QUAST marks an error at approximately 52 Mb. This corresponds to a position in the reference with a large fraction of deviated reads and an estimated 19 kb discrepancy. B. same for Chromosome 17. There are no regions with a large fraction (>50%) of discrepant reads in the Verkko assembly despite QUAST reporting an error at approximately 25 Mb on the reference. This corresponds to an approximately 3 kb discrepancy identified by VerityMap in CHM13 v1.1.
Extended Data Figure 4.
Extended Data Figure 4.. Merqury haplotype blob plots.
A. HG002 downsampled Verkko B. HG002 downsampled DeepConsensus HiFi Verkko and C. HG002 full-coverage Verkko assemblies. The Hi-C phased assembly is on the left and the trio-phased assembly is on the right. Each contig/scaffold is a circle on the plot, with the size scaled based on contig/scaffold length. The x-axis shows the number of maternal markers while the y-axis shows the number of paternal markers. Contigs which lie along either the x-axis or y-axis show no haplotype errors and are consistently maternal or paternal. Contigs which mixed haplotypes would appear along the diagonal but are not observed in these plots, indicating an accurately phased assembly.
Extended Data Figure 5.
Extended Data Figure 5.. IGV views of a recently published HG002 diploid assembly of paternal Chromosome 10 (top) and the Verkko full-coverage trio assembly of the same chromosome (bottom).
The tracks show the maternal (red) and paternal (blue) markers. The centromere location is shown in gray. The published assembly has extensive switching within the centromere array, indicated by the presence of maternal markers and the absence of paternal markers. In contrast, the Verkko assembly centromere shows only paternal markers. The Verkko paternal centromere array is shorter but shows no signs of mis-assembly (Extended Data Figure 8) indicating the larger array in the published assembly is likely due to the incorrect insertion of maternal sequence. Overall, the Verkko assembly is more continuous, with 0 gaps vs 4, and a lower hamming error rate, 0.03%, versus 1.98% compared to the published assembly.
Extended Data Figure 6.
Extended Data Figure 6.. Strand-seq validation of the full-coverage Verkko trio assembly and HPRC manually curated assembly .
The maternal haplotype is shown along the top row and the paternal along the bottom row. Leftmost: alignment-based scaffold assignment to the maternal haplotype (top) and paternal haplotype (bottom) for the full-coverage Verkko assembly. Almost all chromosomes are a single color, indicating that Verkko scaffolds resolved most chromosomes end-to-end. The only exceptions are in the acrocentrics, where some of the scaffolds could not be assigned due to low mappability and maternal Chromosome 6 and paternal Chromosomes 5 which are each composed of two large scaffolds. Over 99.7% of the scaffold bases could be assigned to chromosomes. Middle: the cluster assignment for the maternal haplotype (top) and paternal haplotype (bottom) based on Strand-seq data for the full-coverage Verkko assembly. Here, cluster ID is assigned to each 200 kb window in a scaffold. In case of large scale chromosomal mis-joins, we expect to see multiple colors in a chromosome. The Verkko assembly is consistent with scaffolds all representing a single chromosome bin. Once again, >99.7% of the scaffold bases can be assigned using Strand-seq. Only 2 and 4 Mb of sequence not scaffolded by Verkko could be assigned to the maternal and paternal haplotypes, respectively. Right: The cluster assignment for the maternal haplotype (top) and the paternal haplotype (bottom) based on Strand-seq data for the HPRC manually curated assembly. Here, cluster ID is assigned to each 200 kb window in a scaffold. In case of large scale chromosomal mis-joins, we expect to see multiple colors in a chromosome. A smaller fraction of contigs (and a slightly lower fraction of bases) was assigned than for the Verkko assembly, despite the combination of technologies and manual curation. This may be due to shorter contigs from unresolved repeats which are resolved through Verkko’s ONT integration. There is also visible chromosome mixing within the acrocentric chromosomes unlike in the Verkko result.
Extended Data Figure 7.
Extended Data Figure 7.. Strand-seq structural variant analysis for Verkko full-coverage assembly.
The states assigned to each scaffold in the paternal (A) and maternal (B) for the full-coverage Verkko trio assembly. Strand-seq reads aligned to each assembly are genotype based on their directionality into three possible strand states. Crick-Crick (‘cc’) state in which both homologs in Strand-seq data map in direct orientation and thus such regions are consistent with Strand-seq directional information. Watson-Watson (‘ww’) state in which both homologs in Strand-seq data map in inverted orientation and are indicative of assembly misorientation or unresolved homozygous inversion. Lastly, there are a few (<1% of bases) Watson-Crick (‘wc’) where there is a mixture of Watson and Crick reads and such regions are indicative of heterozygous inversions between haplotypes or might also be cause by low-mappability regions for short Strand-seq reads. C. The size of the heterozygous inversion versus the count of inversions of that size in the maternal and paternal haplotypes of the full-coverage Verkko trio assembly. These regions have confident Strand-seq alignments and normal copy number so these regions indicate potential true heterozygous variation between the haplotypes. D. Strand-seq alignments to the reference Chromosome Y before it was corrected (top) and full-coverage Verkko trio Chromosome Y assembly (bottom). Each plot shows Strand-seq directional read coverage reported as binned (bin size: 10,000, step size: 1,000) read counts represented as vertical bars above (teal; Crick read counts) and below (orange; Watson read counts) the midline. The top plot shows an inversion (dashed line) where directly oriented reads (Crick; teal) switch to inversely oriented reads (Watson, orange) and then back to directly oriented reads. The Verkko assembly in contrast is consistent with only Crick reads present in the same location (dashed line).
Extended Data Figure 8.
Extended Data Figure 8.. Full-coverage Verkko trio assemblies of chromosome 1 (a), 3 (b), 4 (c), 11 (d), 9 (e), 10 (f), 16 (g), and 18 (h) centromeric regions in the HG002 genome.
Both maternal and paternal haplotypes are shown, with repeat element annotation shown on top, followed by PacBio HiFi coverage, ONT coverage, and StainedGlass plots. As with the Chromosome 19 centromeres (Fig. 4), the maternal and paternal haplotypes show large-scale structural variation, with alpha-satellite HOR arrays sizes varying by tens to hundreds of kb. Sites with discrepant HiFi mappings (low coverage or high coverage) are marked with an asterisk. There are few sites in the centromeres, and the artifacts are localized and often inconsistent between ONT and HiFi alignments, indicating the assembly is overall of high quality. To further validate assembly accuracy, we intersected centromere array locations with VerityMap errors and found that in all but four cases (two on the Chr1 paternal centromere, Chr9 paternal centromere, and Chr10 maternal centromere), the errors were short (≤1 kb) or lower frequency (≤50% of the reads). VerityMap also identified one issue, with ≥50% of reads deviating in the Chr4 maternal centromere. However, this was not visible in the NucFreq , plots above, and the region only had a total of three mapped reads.
Extended Data Figure 9.
Extended Data Figure 9.. Comparison of the HG002 maternal and paternal full-coverage Verkko trio assemblies for the centromeric regions of chromosomes 1 (a), 3 (b), 4 (c), 9 (d), 10 (e), 11 (f), 16 (g), 18 (h), and 19 (i) in the HG002 genome.
The plots show the similarity between the two haplotypes, with the maternal haplotype on the y-axis and the paternal on the x-axis. The centromeric regions show varying ɑ-satellite HOR array sizes and sequence identity between the two haplotypes, consistent with earlier reports that indicate that centromeric HOR arrays often expand and contract due to their repetitive nature and their propensity for unequal crossing over and gene conversion events. For Chromosome 19, as in Figure 4, the tracks show the repeat annotations and read coverages. The triangles show the self-similarity within each haplotype for comparison.
Extended Data Figure 10.
Extended Data Figure 10.. Examples of haplotype scaffolding by Rukki in the HG002 genome.
The nodes are colored according to their haplotype assignments. Nodes with at least 100 total markers where 90% of the markers agree are colored: red for maternal, blue for paternal. Nodes with less than 100 markers are colored gray for unassigned. The haplotype paths are marked with solid curves with dotted curves for gaps. (A) A well behaved genomic region consisting of phased heterozygous bubbles, homozygous nodes, and spurious nodes caused by sequencing errors. Where possible, Rukki connects the nodes attributed to the same haplotype across the homozygous regions, producing two phased unitigs without gaps. (B) A tangle within one haplotype. Rukki scaffolds across the tangle (dotted line), reporting an estimated size of the tangled region. (C) A gap in the paternal haplotype. Rukki uses haplotype assignments and the topology of the graph to scaffold across the gap (dotted line), and estimates the size of the gap based on the size of the paired haplotype.
Figure 1.
Figure 1.. Verkko assembly workflow.
Inputs are on the left, with program outputs listed in rectangles. Key components of the pipeline are highlighted, including Canu , MBG , GraphAligner , and Rukki (Online Methods). Using the outputs of these tools, Verkko performs successive rounds of processing and graph resolution. Input reads are first homopolymer compressed and error corrected, and remain so throughout the process. MBG also compresses microsatellites to aid graph construction, but only internally. The first graph output by Verkko is an accurate, high-resolution de Bruijn graph built from the long, accurate reads (LA Graph). This is a node-labeled graph comprising unitigs (nodes) and their adjacency relationships (edges). Ultra-long reads are then aligned to the LA graph to identify read paths (blue curve, orange curve), and Verkko uses them for phasing bubbles, filling gaps (dotted edge), and resolving loops and tangles. The resulting simplified graph (ULA Graph) is typically composed of single-copy, haplotype specific unitigs, separated by two-copy, homozygous unitigs that could not be phased from the read data alone. Haplotype-specific markers are then used to label nodes in the ULA graph and identify haplotype paths through the graph (maternal, red; paternal, blue). These paths are converted to haplotype-specific contigs using a consensus algorithm that recovers the homopolymers.
Figure 2.
Figure 2.. Continuity of assembled CHM13 chromosomes.
The minimum number of continuous alignments needed to cover 85% of each chromosome (LGA85) is represented by the number of dashes, or plain numbers when ≥5. Higher numbers are shaded progressively darker. Alignments were taken from QUAST output versus the CHM13v1.1 reference, after filtering errors at heterozygous sites and potential erroneous regions in the reference as in Table 1. Verkko using HiFi data alone is comparable to other HiFi-based assemblies ,, but Verkko combining HiFi and ONT data has the most complete and correct chromosomes (12).
Figure 3.
Figure 3.. Verkko assembly graph of the HG002 diploid genome.
ULA graph integrating both PacBio HiFi and ONT ultra-long reads visualized using Bandage. Inset shows a portion of the LA graph with multiple bubbles, tangles, and tips prior to resolution using the ultra-long reads. This particular region contains stretches of homozygosity and exact repeats that could not be resolved by HiFi alone. After integration of the ONT data, the corresponding region in the ULA graph is resolved into two linear haplotypes. Each chromosome in HG002 is mostly resolved as a single connected component, with the exception of the acrocentric (13, 14, 15, 21, and 22) and sex chromosomes (X and Y), which are joined by the highly similar rDNA arrays and pseudoautosomal regions (PAR), respectively. The final unitigs in the ULA graph have been colored after assembly by trio-derived haplotype markers (maternal, red; paternal, blue). Using this information to determine haplotype paths through the graph, Verkko was able to completely assemble 20 chromosomal haplotypes in HG002 from telomere to telomere without gaps.
Figure 4.
Figure 4.. Comparison of the maternal (a) and paternal (b) Chr19 centromeric regions in HG002.
Each haplotype is annotated with its repeat structure (top-most track), HOR structure, PacBio HiFi coverage, and ONT coverage. Dark gray indicates reads with low mapping quality, which may be due to either mis-assembly or repetitive regions in the genome. Bars indicate the sum of clipped bases within each window along the assembly (Supplementary Table 9). Last, the triangle, corresponding to the upper-triangular portion of a dot-plot rotated so the diagonal is the x-axis and colored by identity, shows sequence similarity within each haplotype . Both haplotypes reveal the presence of three higher-order repeat (HOR) arrays (D19Z1, D19Z2, and D19Z3) that vary in size and structure.

References

    1. Logsdon GA, Vollger MR & Eichler EE Long-read human genome sequencing and its applications. Nat. Rev. Genet. 21, 597–614 (2020). - PMC - PubMed
    1. Wenger AM et al. Accurate circular consensus long-read sequencing improves variant detection and assembly of a human genome. Nature Biotechnology vol. 37 1155–1162 (2019). - PMC - PubMed
    1. Jain M et al. Nanopore sequencing and assembly of a human genome with ultra-long reads. Nat. Biotechnol. 36, 338–345 (2018). - PMC - PubMed
    1. Shafin K et al. Nanopore sequencing and the Shasta toolkit enable efficient de novo assembly of eleven human genomes. Nat. Biotechnol. (2020) doi:10.1038/s41587-020-0503-6. - DOI - PMC - PubMed
    1. Nagarajan N & Pop M Sequencing and genome assembly using next-generation technologies. Methods in molecular biology (Clifton, N.J.) vol. 673 1–17 (2010). - PubMed