

Agreement test of P value versus Bayes factor for sample means comparison: analysis of articles from the Angle Orthodontist journal
- PMID: 36797687
- PMCID: PMC9933385
- DOI: 10.1186/s12874-023-01858-z
Agreement test of P value versus Bayes factor for sample means comparison: analysis of articles from the Angle Orthodontist journal
Abstract
Background: Researchers are cautioned against misinterpreting the conventional P value, especially while implementing the popular t test. Therefore, this study evaluated the agreement between the P value and Bayes factor (BF01) results obtained from a comparison of sample means in published orthodontic articles.
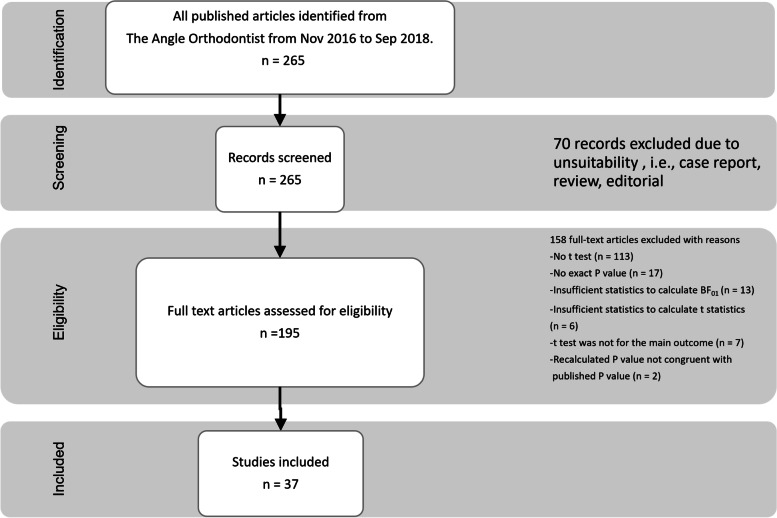
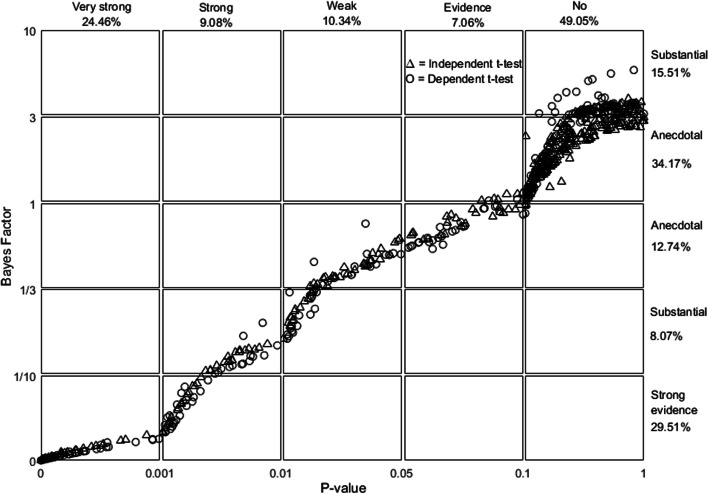
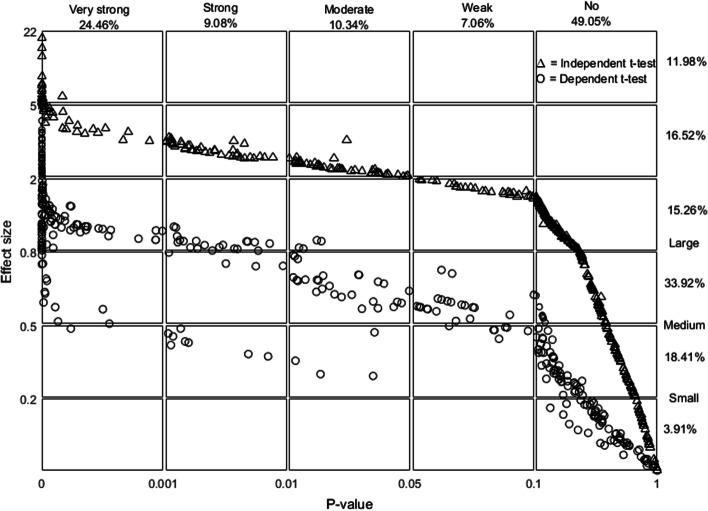
Methods: Data pooling was undertaken using the modified PRISMA flow diagram. Per the inclusion criteria applied to The Angle Orthodontist journal for a two-year period (November 2016 to September 2018), all articles that utilised the t test for statistical analysis were selected. The agreement was evaluated between the P value and Bayes factor set at 0.05 and 1, respectively. The percentage of agreement and Kappa coefficient were calculated. Plotting of effect size against P value and BF01 was analysed.
Results: From 265 articles, 82 utilised the t test. Of these, only 37 articles met the inclusion criteria. The study identified 793 justifiable t tests (438 independent-sample and 355 dependent-sample t tests) for which the agreement percentage and Kappa coefficient were found to be 93.57% and 0.87, respectively. However, when anecdotal evidence (1/3 < BF01 < 3) was considered, almost half of the studies missed statistical significance. Furthermore, two-thirds of the significantly reported P values (0.01 < P < 0.05; 30 independent-sample and 20 dependent-sample t tests) showed only anecdotal evidence (1/3 < BF01 < 1). Moreover, BF01 indicated moderate evidence (BF01 > 3) for approximately one-third of the total studies, with nonsignificant P values (P > 0.05). Furthermore, accompanying the P values, the effect sizes, especially for studies with independent-sample t tests, were very high with a strong potential to show substantive significance. Although it is best to extend the statistical calculation of a doubted P value (just below 0.05), especially for orthodontic innovation, orthodontists may reach a balanced decision relying on cephalometric measurements.
Conclusions: The Kappa coefficient indicated perfect agreement between the two methods. BF01 restricted this judgement to approximately half of them, with two-thirds of these studies showing nonsignificant P values. Simple extensions of statistical calculations, especially effect size and BF01, can be useful and should be considered when finalising statistical analyses, especially for orthodontic studies without cephalometric analysis.
Keywords: Agreement test; Bayes factor; Effect side; Orthodontics; P value.
© 2023. The Author(s).
Conflict of interest statement
The authors declare no competing interests.
Figures

Similar articles
-
Association between study design and citation counts of articles published in the American Journal of Orthodontics and Dentofacial Orthopedics and Angle Orthodontist.Orthodontics (Chic.). 2012;13(1):184-91. Orthodontics (Chic.). 2012. PMID: 22567631
-
A Bayesian analysis of non-significant rehabilitation findings: Evaluating the evidence in favour of truly absent treatment effects.Ann Phys Rehabil Med. 2021 Jul;64(4):101425. doi: 10.1016/j.rehab.2020.07.008. Epub 2020 Oct 6. Ann Phys Rehabil Med. 2021. PMID: 32805456 Review.
-
Does published orthodontic research account for clustering effects during statistical data analysis?Eur J Orthod. 2012 Jun;34(3):287-92. doi: 10.1093/ejo/cjr122. Epub 2011 Oct 19. Eur J Orthod. 2012. PMID: 22015822
-
Skeletal muscle properties and vascular function do not differ between healthy, young vegan and omnivorous men.Eur J Sport Sci. 2022 Apr;22(4):559-568. doi: 10.1080/17461391.2021.1923814. Epub 2021 May 19. Eur J Sport Sci. 2022. PMID: 33905293
-
Evaluating the Strength of Evidence in Favor of Rehabilitation Effects: A Bayesian Analysis.Ann Phys Rehabil Med. 2022 Jan;65(1):101503. doi: 10.1016/j.rehab.2021.101503. Epub 2021 Nov 14. Ann Phys Rehabil Med. 2022. PMID: 33667720 Review.
Cited by
-
Improved emotion differentiation under reduced acoustic variability of speech in autism.BMC Med. 2024 Mar 14;22(1):121. doi: 10.1186/s12916-024-03341-y. BMC Med. 2024. PMID: 38486293 Free PMC article.
References
-
- Oaks M. Statistical Inference: A Commentary for the Social and Behavioral Sciences. New York: Wiley; 1986.
-
- Burger JB, Wolpert RL. The likelihood principle. Hayward CA: Institute of Mathematical Statistics. 1988. https://jstor.org/stable/4355509. Accessed 10 June 2022.
-
- Altman D. Practical Statistics for Medical Research. London: Chapman and Hall CRC; 1991.
-
- Fisher R. Statistical Methods for Research Workers. Edinburgh: Oliver & Boyd; 1925.
-
- Neyman J, Pearson ES. On the problem of the most efficient tests of statistical hypotheses. Philos Trans R Soc London Ser A, Contain Pap a Math or Phys Character. 1933;231:289–337.
Publication types
MeSH terms
LinkOut - more resources
Full Text Sources
Medical
Miscellaneous
