. 2023 Feb 16;21(1):35.
doi: 10.1186/s12915-023-01530-4.

Gene expression differences consistent with water loss reduction underlie desiccation tolerance of natural Drosophila populations

Affiliations

Gene expression differences consistent with water loss reduction underlie desiccation tolerance of natural Drosophila populations

Vivien Horváth et al. BMC Biol. .

Abstract

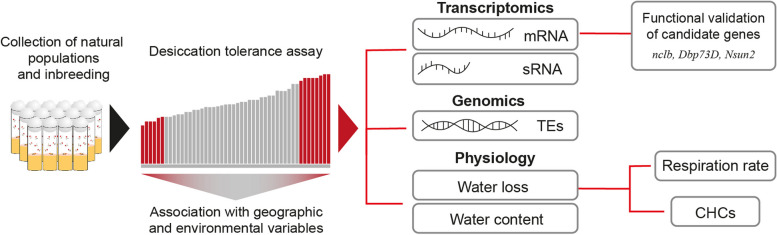
Background: Climate change is one of the main factors shaping the distribution and biodiversity of organisms, among others by greatly altering water availability, thus exposing species and ecosystems to harsh desiccation conditions. However, most of the studies so far have focused on the effects of increased temperature. Integrating transcriptomics and physiology is key to advancing our knowledge on how species cope with desiccation stress, and these studies are still best accomplished in model organisms.

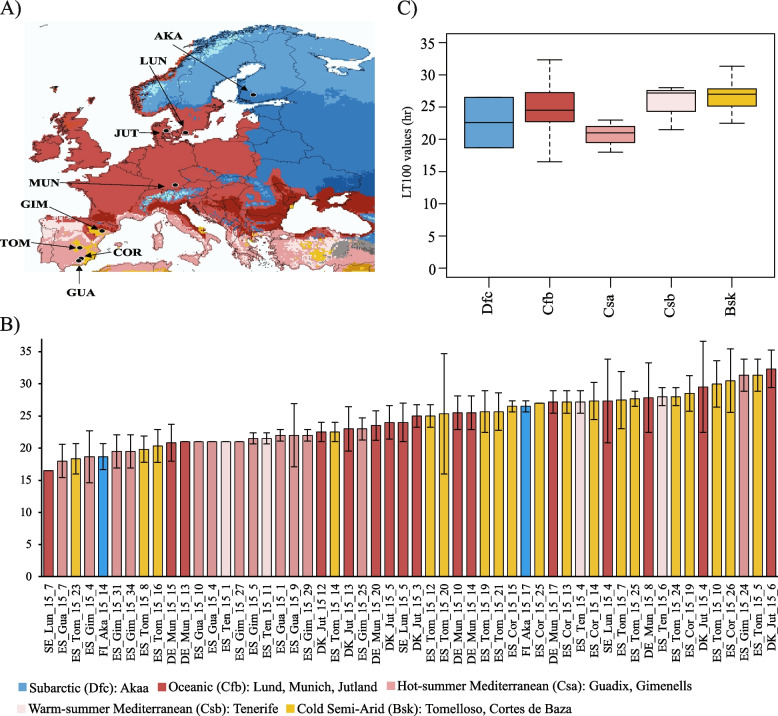
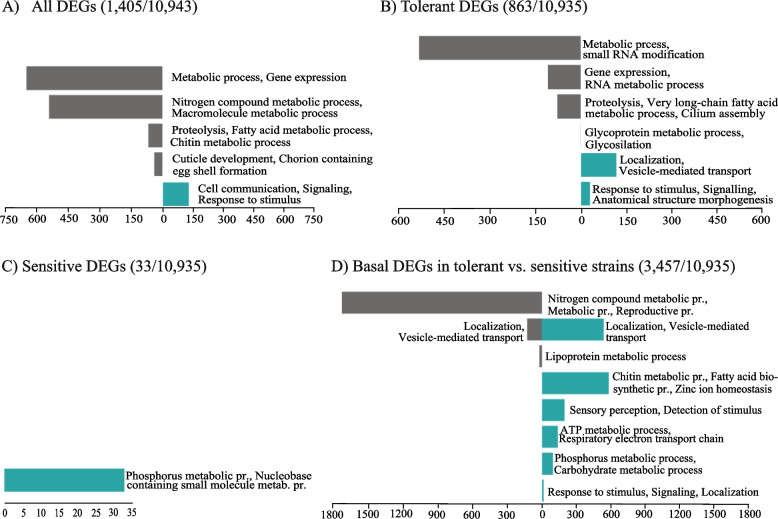
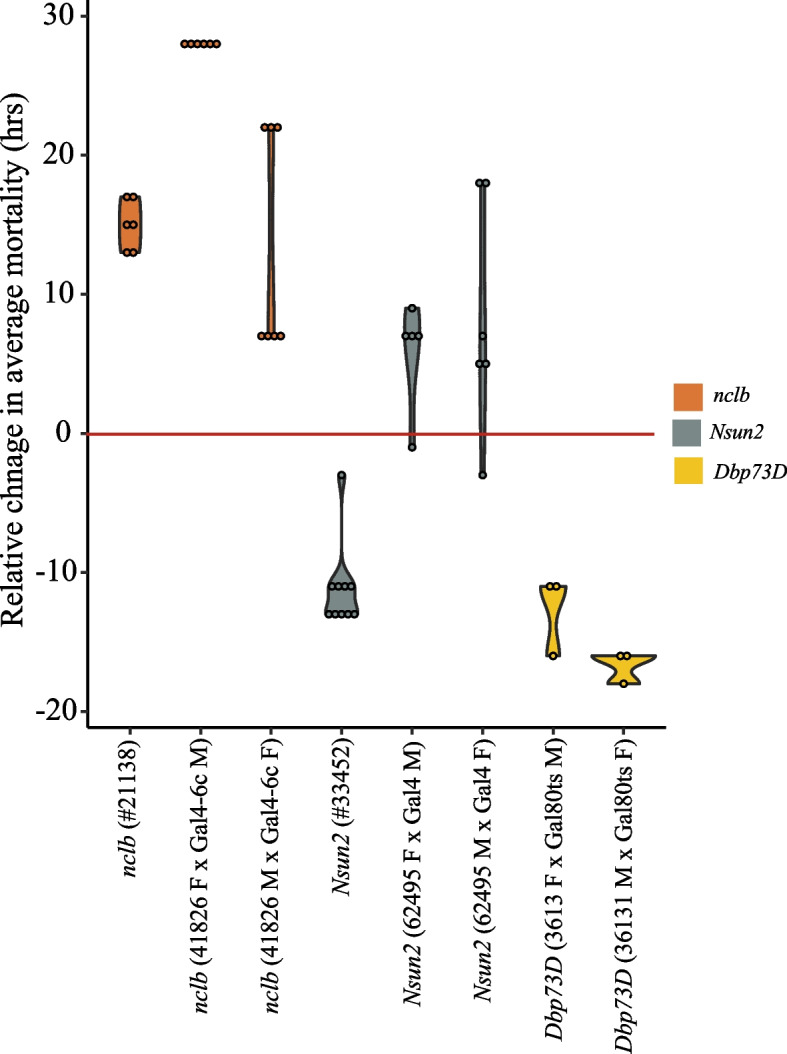
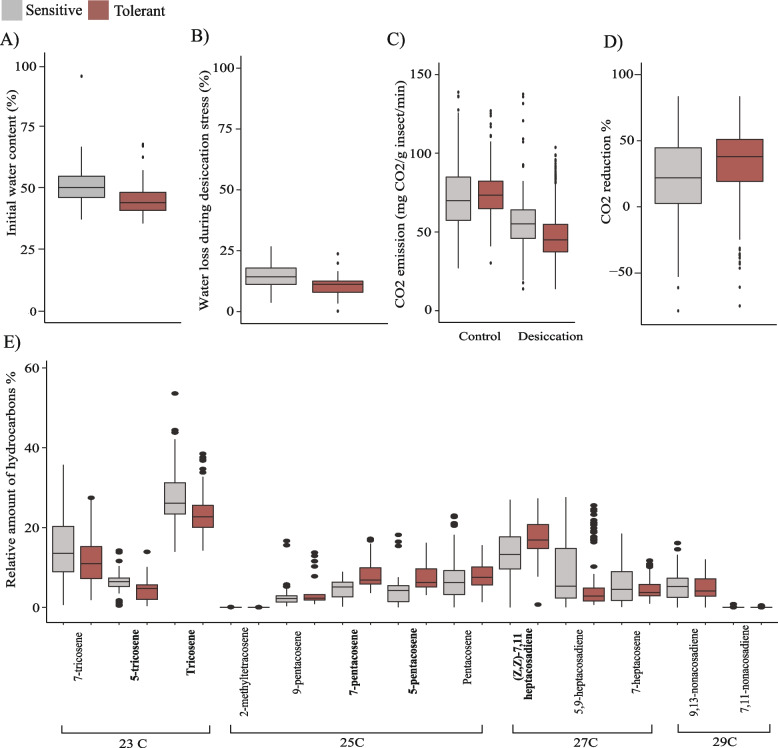
Results: Here, we characterized the natural variation of European D. melanogaster populations across climate zones and found that strains from arid regions were similar or more tolerant to desiccation compared with strains from temperate regions. Tolerant and sensitive strains differed not only in their transcriptomic response to stress but also in their basal expression levels. We further showed that gene expression changes in tolerant strains correlated with their physiological response to desiccation stress and with their cuticular hydrocarbon composition, and functionally validated three of the candidate genes identified. Transposable elements, which are known to influence stress response across organisms, were not found to be enriched nearby differentially expressed genes. Finally, we identified several tRNA-derived small RNA fragments that differentially targeted genes in response to desiccation stress.

Conclusions: Overall, our results showed that basal gene expression differences across individuals should be analyzed if we are to understand the genetic basis of differential stress survival. Moreover, tRNA-derived small RNA fragments appear to be relevant across stress responses and allow for the identification of stress-response genes not detected at the transcriptional level.

Keywords: Cuticular hydrocarbons; Insect physiology; Post-transcriptional regulation; Respiration rate; Water content; tRFs.


Conflict of interest statement

The authors declare that they have no competing interests.

Figures

Fig. 1
Fig. 1
Schematic representation of the analyses performed in this work. Flies were collected from nine European populations and inbred for up to 21 generations. Desiccation tolerance was measured for all the wild-derived strains and association with geographic and environmental variables was performed to investigate the variation in desiccation tolerance across strains. Transcriptomics, genomics, and physiological assays were performed with the subset of strains from the extremes of the phenotypic distribution. Three of the genes identified in the differential gene expression analysis were functionally validated. To further analyze the differences in water loss identified, both respiration rate assays and characterization of the cuticular hydrocarbon composition was performed
Fig. 2
Fig. 2
Natural variation in desiccation survival across European natural D. melanogaster populations. A Geographical origin of the nine populations analyzed in this study. The location of the populations is indicated with arrows in a map of Europe colored based on the Köppen-Geiger climate zones, except for Tenerife, which is not shown in the map (Additional file 1. Table S1). B Desiccation survival of European natural populations. LT100 values for the 59 inbred strains (three replicates/strain) that showed less than 10% control mortality are shown (Additional file 3. Table S2A). The Y-axis represents the average hour when the flies in all the replicates were dead, and the X-axis represents the individual strains colored by the climate zone in which they were collected. Data are presented as mean values ± SD. C Boxplot of the distribution of the LT100 values of the strains, grouped by climate zones (Additional file 3. Table S2A). The boxplot shows the median (the horizontal line in the box), 1st and 3rd quartiles (lower and upper bounds of box, respectively), and minimum and maximum (lower and upper whiskers, respectively)
Fig. 3
Fig. 3
Biological process GO enrichment of the differentially expressed gene clusters identified by Transcriptogramer. A GO enrichment of the DEGs when all six strains (three tolerant and three sensitive) were analyzed together (Additional file 4: Table S3A). B GO enrichment of the DEGs in tolerant strains (Additional file 4: Table S3B). C GO enrichment of the DEGs in sensitive strains (Additional file 4: Table S3C). D GO enrichment of the DEGs in basal conditions when comparing tolerant vs sensitive strains (Additional file 4: Table S3D). In all the plots, the X-axis represents the number of genes contained in the clusters. Gray indicates enrichment for downregulated genes, while blue indicates enrichment for the upregulated genes. In parenthesis, the number of DEGs/number of genes analyzed are given. For each condition, three replicates of three tolerant and three replicates of three sensitive strains were sequenced
Fig. 4
Fig. 4
Functional validation of nclb, Nsun2, and Dbp73D genes. Relative change in average mortality at the end of the desiccation assay comparing gene disruption and knock-down (RNAi) strains for the three candidate desiccation-responsive genes with control strains. At least three replicates were analyzed in all cases. Additional file 8C: TableS7C
Fig. 5
Fig. 5
Desiccation-related physiological traits and cuticular hydrocarbon variation in natural European populations. A Initial water content in sensitive and tolerant strains (10 tolerant and 10 sensitive strains, 10 replicates/strain; Additional file 11: Table S10A). B Percentage of water loss during desiccation stress in sensitive and tolerant strains (10 tolerant and 10 sensitive strains, 4–5 replicates/strain, except one strain with 3 and one strain with 2 replicates; Additional file 11: Table S10B). C Respiration rate under control and desiccation stress conditions in sensitive and tolerant strains (three tolerant and three sensitive strains, 3 replicates/strain; Additional file 12: Table S11B-G). D Percentage of CO2 decrease (respiration) in response to desiccation stress in sensitive and tolerant strains (three tolerant and three sensitive strains, 3 replicates/strain; Additional file 12: Table S11B-G). E Relative amount of cuticular hydrocarbons in sensitive (gray) and tolerant (red) strains. Hydrocarbons that showed significant differences between sensitive and tolerant strains are depicted in bold (10 tolerant and 10 sensitive strains, 7–10 replicates except for one strain with 4 replicates; Additional file 13: Table S12). All boxplots show the median (the horizontal line in the box), 1st and 3rd quartiles (lower and upper bounds of box, respectively), and minimum and maximum (lower and upper whiskers, respectively)

Similar articles

Cited by

References

    1. Wheeler N, Watts N. Climate change: from science to practice. Curr Environ Health Rep. 2018;5(1):170–178. - PMC - PubMed
    1. Parmesan C. Ecological and evolutionary responses to recent climate change. Annu Rev Ecol Evol Syst. 2006;37(1):637–669.
    1. Stott P. Climate change. How climate change affects extreme weather events. Science. 2016;352(6293):1517–8. - PubMed
    1. Waldvogel AM, Feldmeyer B, Rolshausen G, Exposito-Alonso M, Rellstab C, Kofler R, et al. Evolutionary genomics can improve prediction of species’ responses to climate change. Evol Lett. 2020;4(1):4–18. - PMC - PubMed
    1. Grillakis MG. Increase in severe and extreme soil moisture droughts for Europe under climate change. Sci Total Environ. 2019;660:1245–1255. - PubMed

Publication types