. 2023 Feb 16;24(1):27.
doi: 10.1186/s13059-023-02866-4.

DNA methylation entropy as a measure of stem cell replication and aging

Affiliations

DNA methylation entropy as a measure of stem cell replication and aging

Himani Vaidya et al. Genome Biol. .

Erratum in

Abstract

Background: Epigenetic marks are encoded by DNA methylation and accumulate errors as organisms age. This drift correlates with lifespan, but the biology of how this occurs is still unexplained. We analyze DNA methylation with age in mouse intestinal stem cells and compare them to nonstem cells.

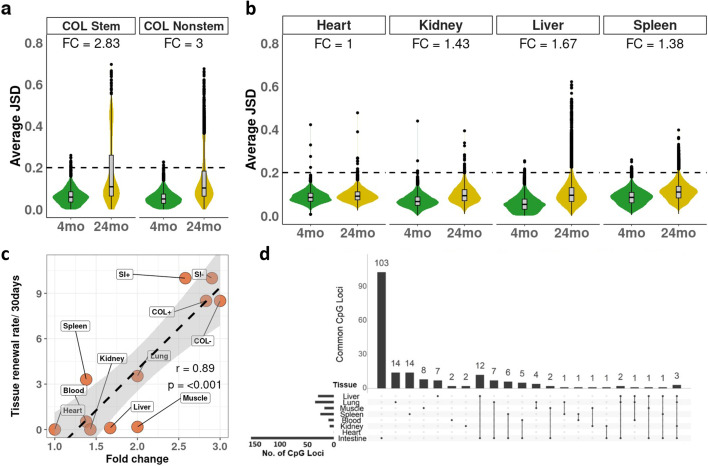
Results: Age-related changes in DNA methylation are identical in stem and nonstem cells, affect most prominently CpG islands and correlate weakly with gene expression. Age-related DNA methylation entropy, measured by the Jensen-Shannon Distribution, affects up to 25% of the detectable CpG sites and is a better measure of aging than individual CpG methylation. We analyze this entropy as a function of age in seven other tissues (heart, kidney, skeletal muscle, lung, liver, spleen, and blood) and it correlates strikingly with tissue-specific stem cell division rates. Thus, DNA methylation drift and increased entropy with age are primarily caused by and are sensors for, stem cell replication in adult tissues.

Conclusions: These data have implications for the mechanisms of tissue-specific functional declines with aging and for the development of DNA-methylation-based biological clocks.

Keywords: Aging; Cell division; DNA methylation; Epigenetic clock; Stem cell.


Conflict of interest statement

The authors declare that they have no competing interests.

Figures

Fig. 1
Fig. 1
Methylation changes in stem cells correlate highly with their progeny. a Schematic diagram of experimental procedures. Mice were sacrificed at 4, 12, 18, or 24 months and intestines separated into the upper small intestine (USI), lower small intestine (LSI), and colon (COL). Stem cells were separated by sorting for Lgr5-GFP + cells. Reduced representation bisulfite sequencing (RRBS) and RNA-seq were done on the samples. b Principal component analysis (PCA) of 180,496 CpG sites common across 4 age groups and 3 tissues. Colon samples form a different cluster than small intestinal samples (PC1), and the spread along PC2 corresponds to an increasing age. c Volcano plots showing methylation differences between stem cells (Lgr5 − GFP +) and nonstem cells (Lgr5 − GFP −) in young and old mouse colon samples. Each volcano plot indicates the number and percent of CpG sites that are differentially methylated (Methylation change >  ± 5%, q-value < 0.05). d Volcano plots showing methylation differences between young (4 months) and old (24 months) samples in stem cells and nonstem cells. e Scatterplot of CpG sites that change significantly between 4 months versus 24 months in either stem cells, nonstem cells, or both in COL, USI, and LSI
Fig. 2
Fig. 2
Aging and differentiation target distinct genomic compartments. a Histogram of Spearman correlation coefficients (r) derived from permutation analysis of 125,077 CpG sites( all samples, stem and Nonstem). Significantly (empirical p-value < 0.05, r >|0.5|) hypermethylated CpG sites are in red and hypomethylated sites are in green. b PCA plot constructed using the 8102 CpG sites from the permutation test that significantly change with age. c Odds ratios that CpG sites in given genomic regions (Promoter-CpGi, nonPromoter-CpGi, Promoter-nonCpGi, nonPromoter-nonCpGi) are more likely to gain methylation with age (top) or lose methylation with age (bottom). d Differential methylation analysis between the colon and small intestine (Upper small intestine + Lower small intestine) samples e. PCA plot constructed using the 5227 CpG sites that significantly change between the colon and small intestine in the differential methylation analysis. f Odds ratios that CpG sites in given genomic regions (Promoter-CpGi, nonPromoter-CpGi, Promoter-nonCpGi, nonPromoter-nonCpGi) are more likely to be hypermethylated in the colon (top) or be hypomethylated in the colon (bottom) compared to the small intestine. g Venn diagram showing the overlap of CpG sites that change significantly with age or significantly between colon vs small intestine, either sites that gain methylation (left) or sites that lose methylation (right). h Venn diagram showing the overlap of CpG sites that change with age significantly in the permutation analysis in the intestine with 8000 CpG sites common across multiple tissues (blood, heart, kidney, liver, lung, skeletal muscle, spleen, small intestine, and colon) with high standard deviation in methylation values in the same CpG sites
Fig. 3
Fig. 3
Gene expression changes with age and DNA methylation in the colon. a PCA plot constructed using all expressed genes in the intestinal epithelium of the upper small intestine (USI), lower small intestine (LSI), and colon (COL) at ages 4, 12, and 24 months. b Volcano plot showing differential gene expression between young (4 months) and old (24 months) colon samples. c, d Bar plots showing the relationship between DNA methylation (x-axis) and gene expression (average log2rpkm) on the y-axis in the nonCpG island (c) and promoter- CpG island (d) compartments. e, f Scatterplots showing the correlation between DNA methylation change and gene expression change for promoter CpG sites selected based on significance in the permutation analysis. Sites were further divided into those genes that are expressed in young mice (left) and those that are silenced at baseline (right). The plots show a weak but significant negative correlation between methylation change and expression change, for those genes that are expressed at baseline
Fig. 4
Fig. 4
Aging but not differentiation leads to increasing entropy. a-b. Example methylation profiles of epialleles (4 CpGs on chr7 at positions 38,557,438, 38,557,457, 38,557,459, and 38,557,489) that have a large change in methylation entropy with age. Each row represents data from four consecutive CpG sites in a single sequenced allele (black: methylated, gray: unmethylated). a The left shows colon stem cells (Lgr5-GFP +) in a young (4 months) mouse vs the same loci at the right in old (24 months) mouse. (b) Same as a, but colon nonstem cells (Lgr5 − GFP −). c PCA plot constructed using Jensen-Shannon distances (JSDs) for 270 epialleles detected in all samples. The PCA shows clustering by age but not by tissue of origin. d Scatterplots showing the change in Jensen-Shannon distance (JSD) on the x-axis vs change in methylation on the y-axis in the colon between (left) young and old stem cells (Lgr5 − GFP +), and (right) young and old nonstem cells (Lgr5 − GFP −). e Scatterplot of CpG sites that have a JSD > 0.2 in old (24 months) in either stem cells, nonstem cells, or both in COL, USI, and LSI
Fig. 5
Fig. 5
Change in entropy in different tissues. a Average Jensen-Shannon sistances for each locus (JSD) in young (4 months) and old (24 months) mice in the colon (COL) in both stem (Lgr5 − GFP +) and nonstem (Lgr5 − GFP −) cells (fold change calculation in the “Methods” section). b Same as a for the given tissue. c Scatterplot of fold change in JSD with age on the x-axis vs 30-day tissue renewal rate on the y-axis: COL +  = colon stem cells, COL −  = colon nonstem cells, SI +  = small intestine (USI + LSI) stem cells, SI −  = small intestine (USI + LSI) nonstem cells. d UpSet plots of commonly detected loci with Jensen-Shannon distance (JSD) > 0.2 in different organs (liver, lung, muscle, spleen, blood, kidney, heart, and intestines)

References

    1. López-Otín C, Blasco MA, Partridge L, Serrano M, Kroemer G. The Hallmarks of Aging. Cell. 2013;153(6):1194–1217. doi: 10.1016/j.cell.2013.05.039. - DOI - PMC - PubMed
    1. Issa J-P. Aging, DNA methylation and cancer. Crit Rev Oncol Hematol. 1999;32(1):31–43. doi: 10.1016/S1040-8428(99)00019-0. - DOI - PubMed
    1. Fuke C, Shimabukuro M, Petronis A, Sugimoto J, Oda T, Miura K, et al. Age related changes in 5-methylcytosine content in human peripheral leukocytes and placentas: an HPLC-based study. Ann Hum Genet. 2004;68(Pt 3):196–204. doi: 10.1046/j.1529-8817.2004.00081.x. - DOI - PubMed
    1. Issa J-PJ, Ottaviano Y, Celano P, Hamilton SR, Davidson NE, Baylin SB. Methylation of the oestrogen receptor CpG island links ageing and neoplasia in human colon. Nature Genetics. 1994;7(4):536–40. doi: 10.1038/ng0894-536. - DOI - PubMed
    1. Bjornsson HT. Intra-individual Change Over Time in DNA Methylation With Familial Clustering. JAMA. 2008;299(24):2877. doi: 10.1001/jama.299.24.2877. - DOI - PMC - PubMed

Publication types