

The effects of exceeding low-risk drinking thresholds on self-rated health and all-cause mortality in older adults: the Tromsø study 1994-2020
- PMID: 36797780
- PMCID: PMC9933408
- DOI: 10.1186/s13690-023-01035-0
The effects of exceeding low-risk drinking thresholds on self-rated health and all-cause mortality in older adults: the Tromsø study 1994-2020
Abstract
Background: Based on findings of increasing alcohol consumption in older adults, it is important to clarify the health consequences. Using data from the Tromsø study, we aimed to investigate the relationship between different levels of alcohol consumption in old adulthood and self-rated health trajectories and all-cause mortality.
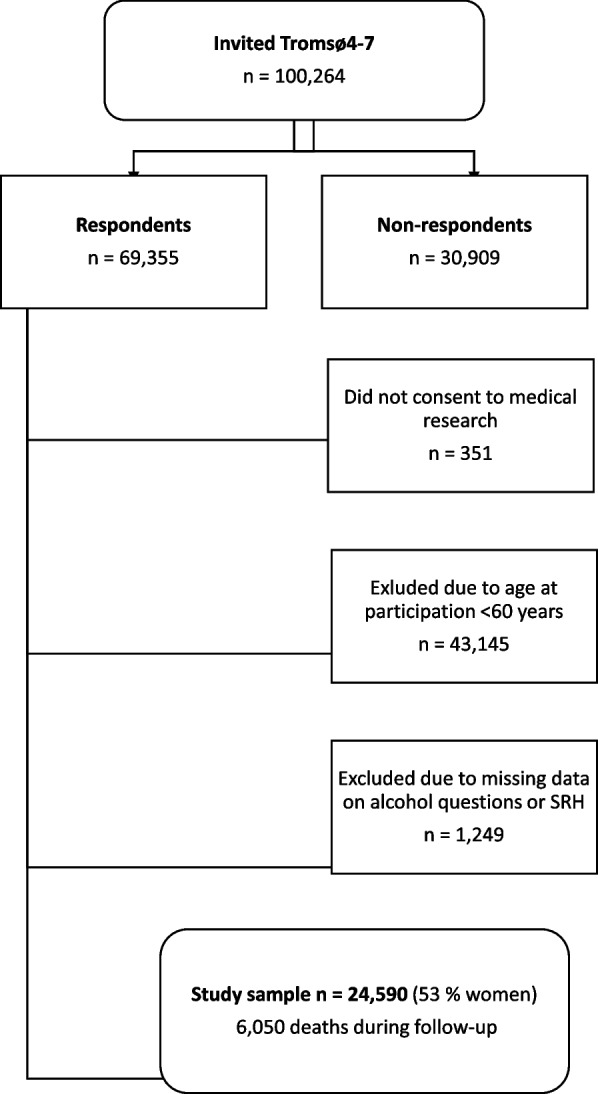
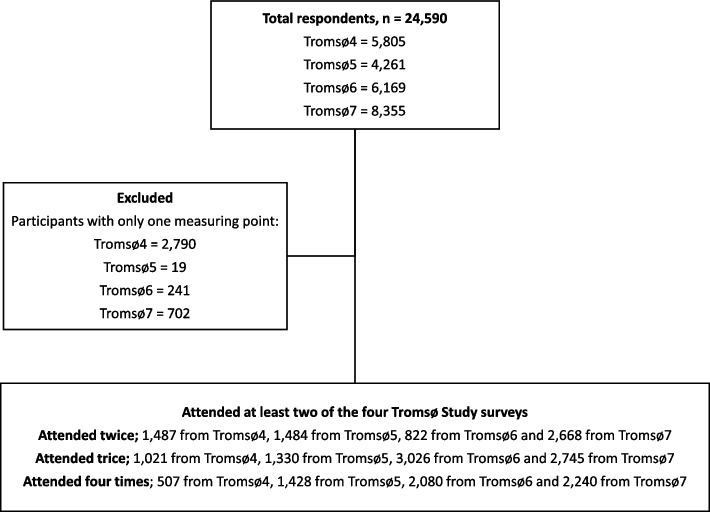
Methods: This is an epidemiological study utilizing repeated measures from the Tromsø study cohort. It allows follow-up of participants from 1994 to 2020. A total of 24,590 observations of alcohol consumption were made in older adults aged 60-99 (53% women).
Primary outcome measures: Self-rated health (SRH) and all-cause mortality. SRH was reported when attending the Tromsø study. Time of death was retrieved from the Norwegian Cause of Death Registry. The follow-up time extended from the age of study entry to the age of death or end of follow-up on November 25, 2020.
Predictor: Average weekly alcohol consumption (non-drinker, < 100 g/week, ≥100 g/week). We fitted two-level logistic random effects models to examine how alcohol consumption was related to SRH, and Cox proportional hazards models to examine its relation to all-cause mortality. Both models were stratified by sex and adjusted for sociodemographic factors, pathology, biometrics, smoking and physical activity. In addition, all the confounders were examined for whether they moderate the relationship between alcohol and the health-related outcomes through interaction analyses.
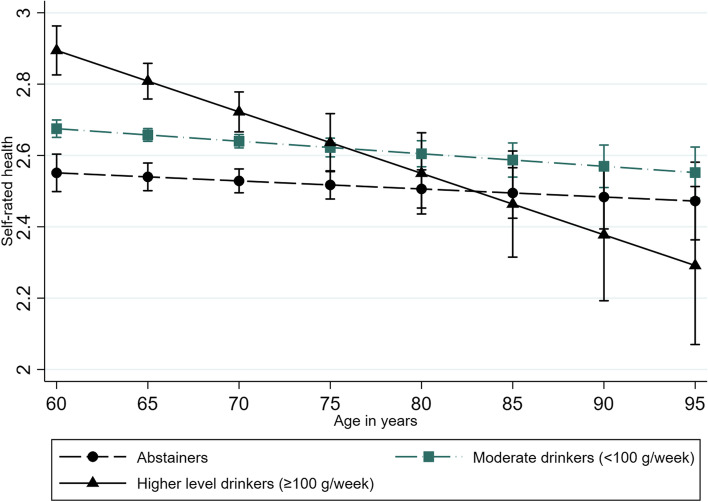
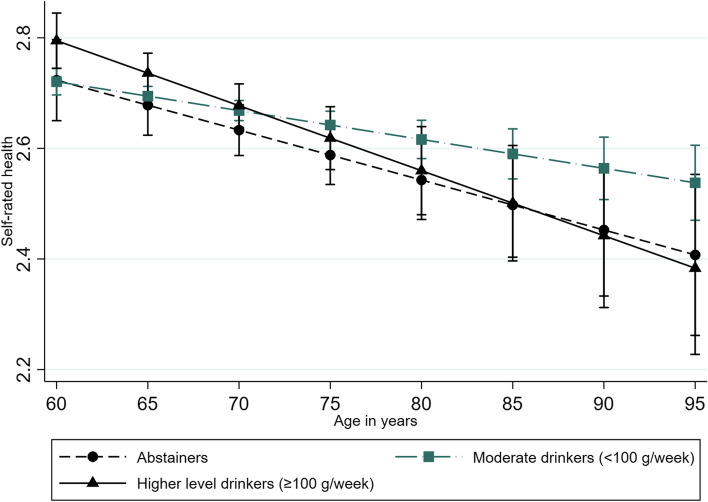
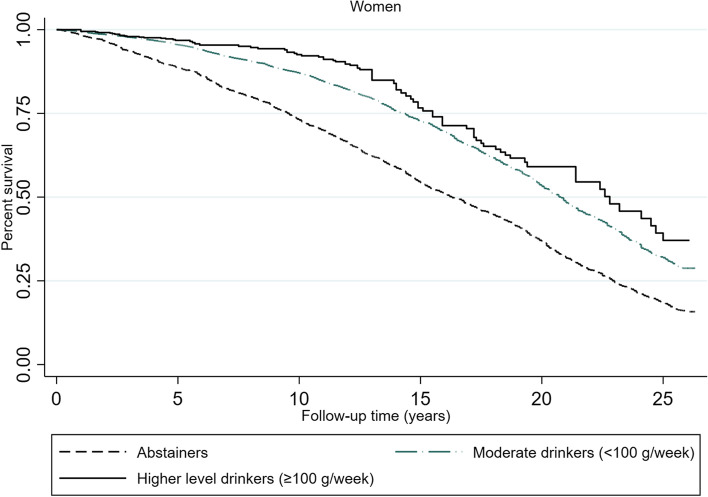
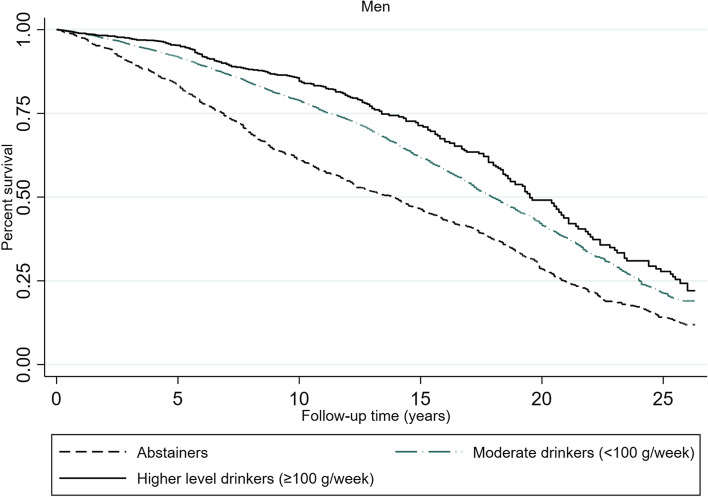
Results: We found that women who consumed ≥100 g/week had better SRH than those who consumed < 100 g/week; OR 1.85 (1.46-2.34). This pattern was not found in men OR 1.18 (0.99-1.42). We identified an equal mortality risk in both women and men who exceeded 100 g/week compared with those who consumed less than 100 g/week; HR 0.95 (0.73-1.22) and HR 0.89 (0.77-1.03), respectively.
Conclusions: There was no clear evidence of an independent negative effect on either self-rated health trajectories or all-cause mortality for exceeding an average of 100 g/week compared to lower drinking levels in this study with up to 25 years follow-up. However, some sex-specific risk factors in combination with the highest level of alcohol consumption led to adverse effects on self-rated health. In men it was the use of sleeping pills or tranquilisers and ≥ 20 years of smoking, in women it was physical illness and older age.
Keywords: Alcohol consumption; Longitudinal study; Mental distress; Mortality; Norway; Older adults; Self-rated health; The Tromsø study.
© 2023. The Author(s).
Conflict of interest statement
The authors declare no competing interests.
Figures
References
-
- Hallgren M, Högberg P, Andréasson S. Health effects, consumption trends and related issues Background report commissioned by the Swedish Ministry of Health and Social Affairs for discussion at the EU Expert Conference on Alcohol and Health. 2009. Alcohol consumption among elderly European Union citizens.
-
- Stelander LT, Høye A, Bramness JG, Selbæk G, Lunde LH, Wynn R, et al. The changing alcohol drinking patterns among older adults show that women are closing the gender gap in more frequent drinking: the Tromsø study, 1994-2016. Subst Abuse Treat Prev Policy. 2021;16(1):45. doi: 10.1186/s13011-021-00376-9. - DOI - PMC - PubMed
Grants and funding
LinkOut - more resources
Full Text Sources
