

Exploration of the anti-hyperuricemia effect of TongFengTangSan (TFTS) by UPLC-Q-TOF/MS-based non-targeted metabonomics
- PMID: 36797795
- PMCID: PMC9933412
- DOI: 10.1186/s13020-023-00716-w
Exploration of the anti-hyperuricemia effect of TongFengTangSan (TFTS) by UPLC-Q-TOF/MS-based non-targeted metabonomics
Abstract
Background: TongFengTangSan (TFTS) is a commonly used Tibetan prescription for gout treatment. Previously, TFTS (CF) was confirmed to have a significant uric acid-lowering effect. However, the anti-hyperuricemia mechanisms and the main active fractions remain unclear. The current study aimed to investigate the anti-hyperuricemia mechanism using metabolomics and confirm the active CF fraction.
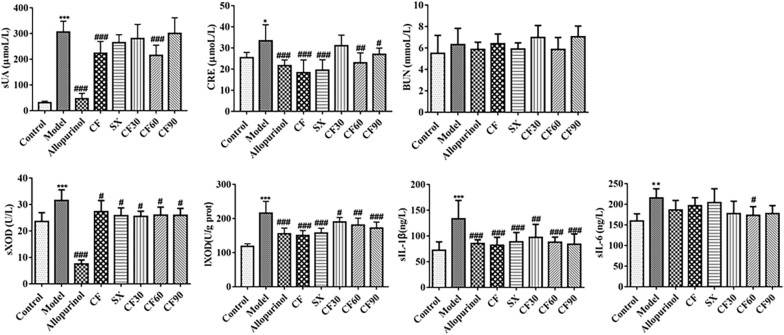
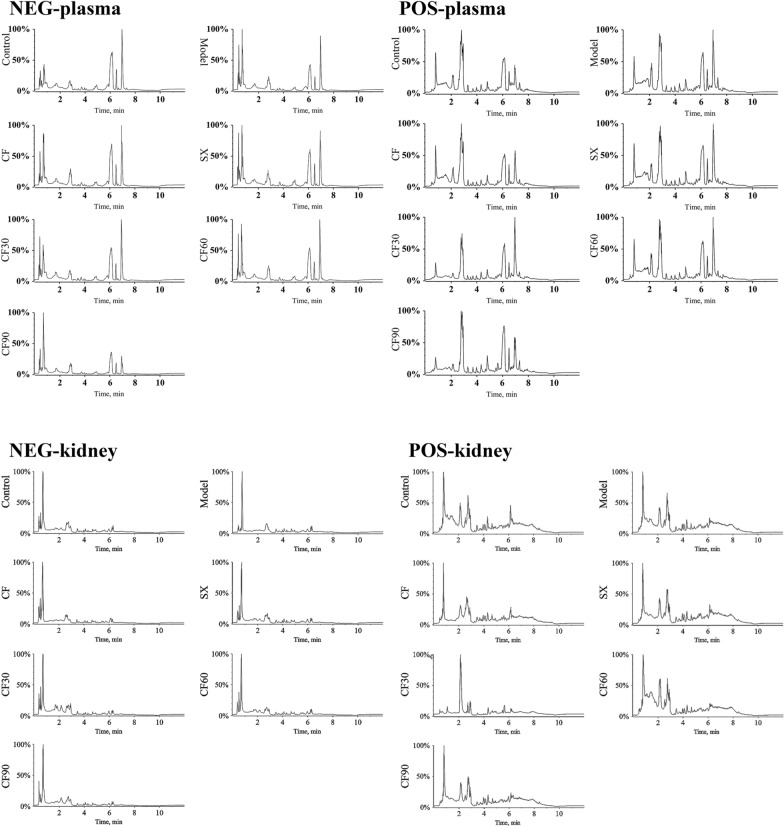
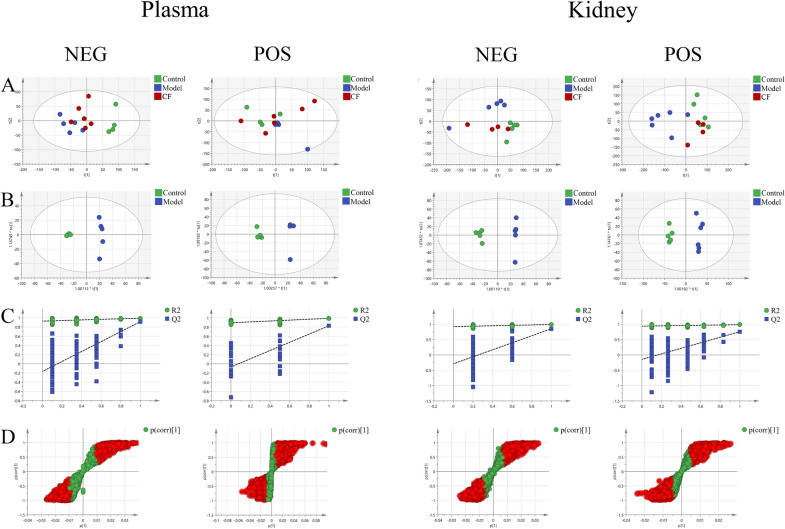
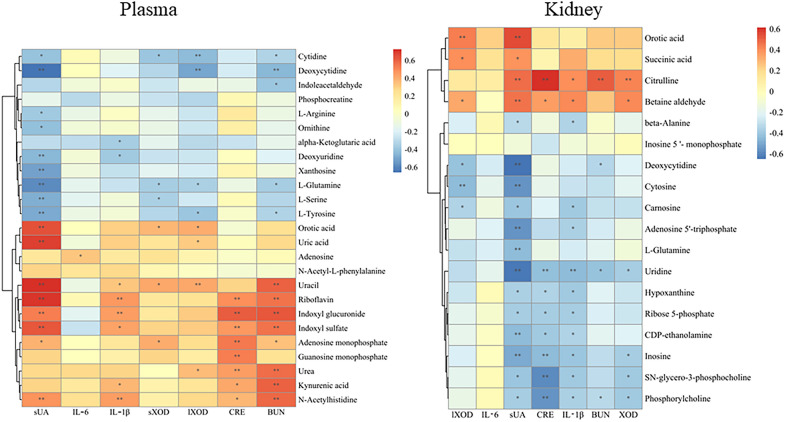
Methods: The hyperuricemia model was established through intraperitoneal injection containing 100 mg/kg potassium oxonate and 150 mg/kg hypoxanthine by gavage. We used serum uric acid (sUA), creatinine (CRE), blood urea nitrogen (BUN), xanthine oxidase (XOD) activity, interleukin-6 (IL-6) and interleukin-1β (IL-1β) as indicators to evaluate the efficacy of CF and the four fractions (SX, CF30, CF60, and CF90). The anti-hyperuricemia mechanism of CF was considered through non-targeted metabolomics depending on the UPLC-Q-TOF-MS technology. Principle component analysis (PCA) and orthogonal partial least squares-discriminant analysis (OPLS-DA) helped explore the potential biomarkers in hyperuricemia. Moreover, the differential metabolites and metabolic pathways regulated by CF and four fractions were also assessed.
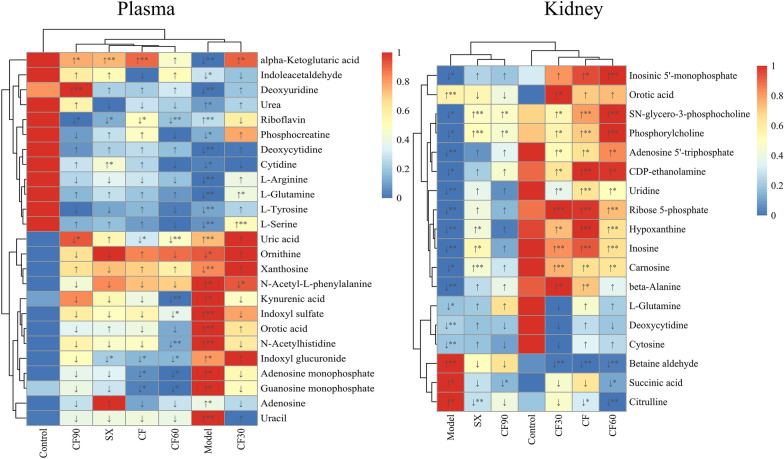
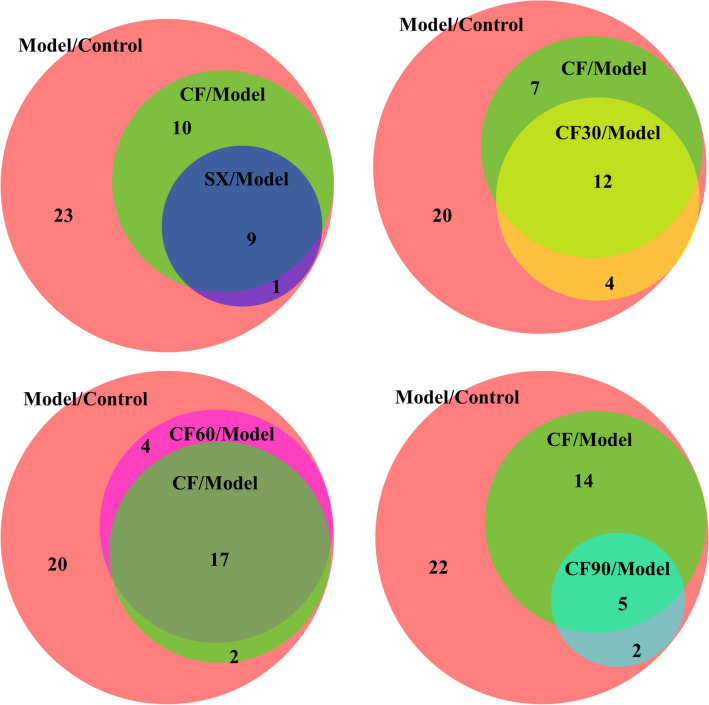
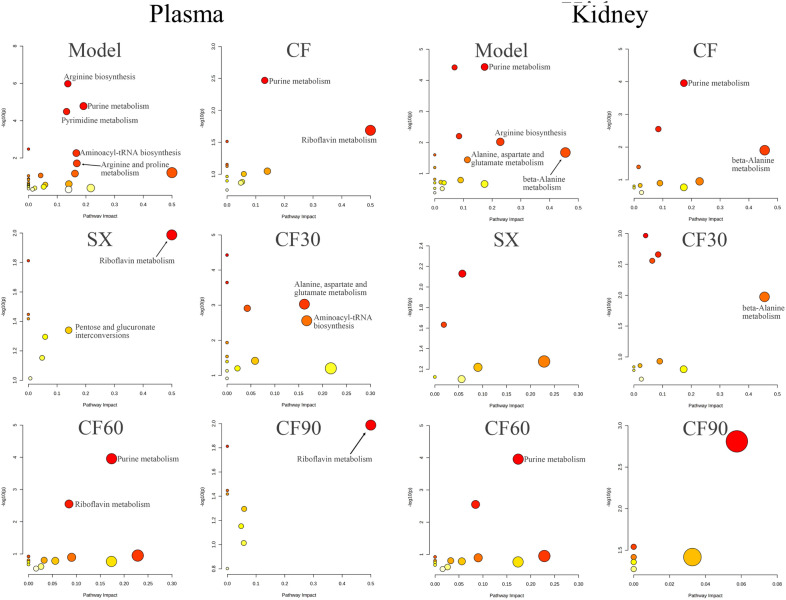
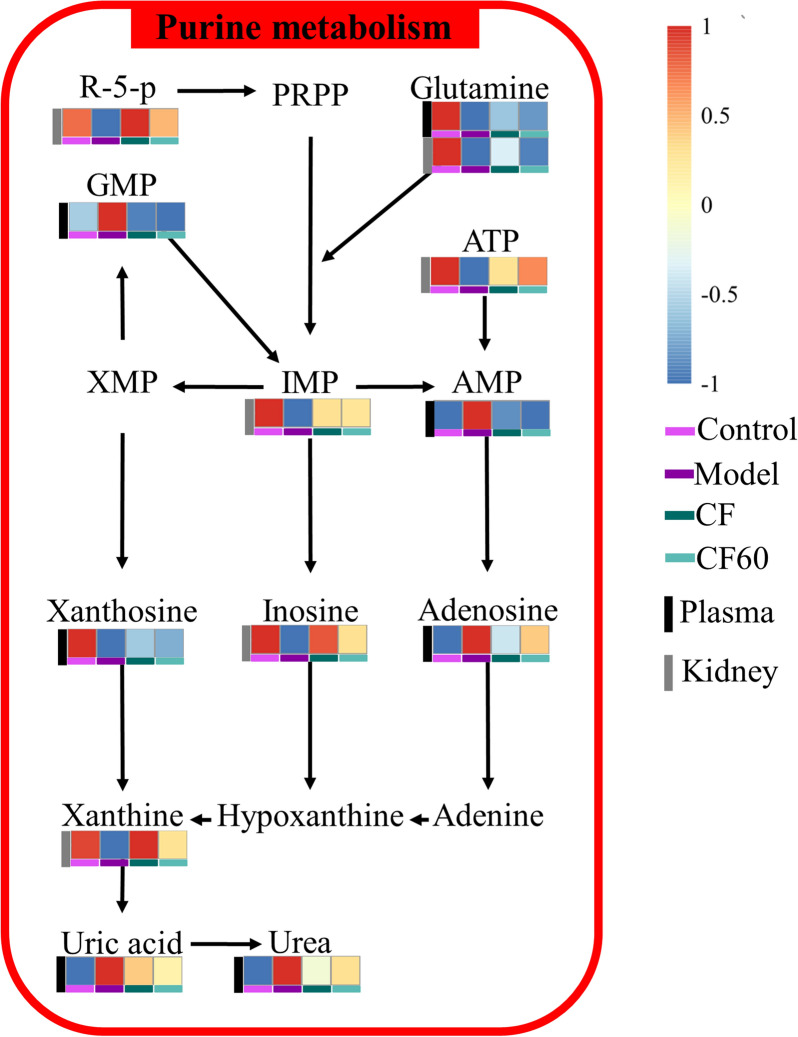
Results: CF revealed a significant anti-hyperuricemia effect by down-regulating the level of sUA, sCRE, sIL-1β, and XOD. SX, CF30, CF60, and CF90 differed in the anti-hyperuricemia effect. Only CF60 significantly lowered the sUA level among the four fractions, and it could be the main efficacy fraction of TFTS. Forty-three differential metabolites were identified in hyperuricemia rats from plasma and kidney. Pathway analysis demonstrated that seven pathways were disrupted among hyperuricemia rats. CF reversed 19 metabolites in hyperuricemia rats and exerted an anti-hyperuricemia effect by regulating purine metabolism. CF60 was the main active fraction of TFTS and exerted a similar effect of CF by regulating purine metabolism.
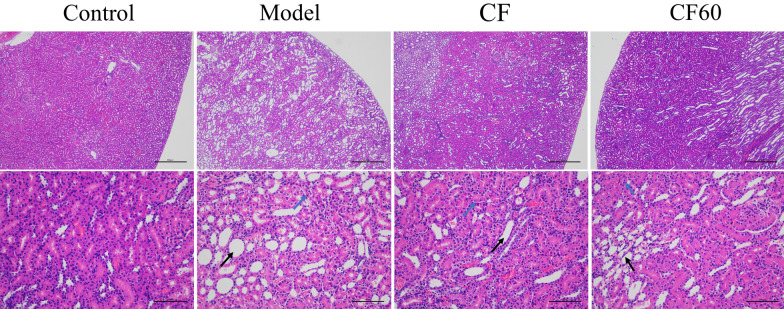
Conclusions: CF and CF60 could exert an anti-hyperuricemia effect by regulating the abnormal purine metabolism because of hyperuricemia while improving intestinal and renal function. CF60 could be the main active fraction of TFTS.
Keywords: Hyperuricemia; Mechanism; Metabolomics; TFTS.
© 2023. The Author(s).
Conflict of interest statement
The authors declare that they have no competing interests.
Figures
References
Grants and funding
LinkOut - more resources
Full Text Sources
