. 2023 Apr;22(4):e13784.
doi: 10.1111/acel.13784. Epub 2023 Feb 16.

Age-related changes to adipose tissue and peripheral neuropathy in genetically diverse HET3 mice differ by sex and are not mitigated by rapamycin longevity treatment

Affiliations

Age-related changes to adipose tissue and peripheral neuropathy in genetically diverse HET3 mice differ by sex and are not mitigated by rapamycin longevity treatment

Jake W Willows et al. Aging Cell. 2023 Apr.

Abstract

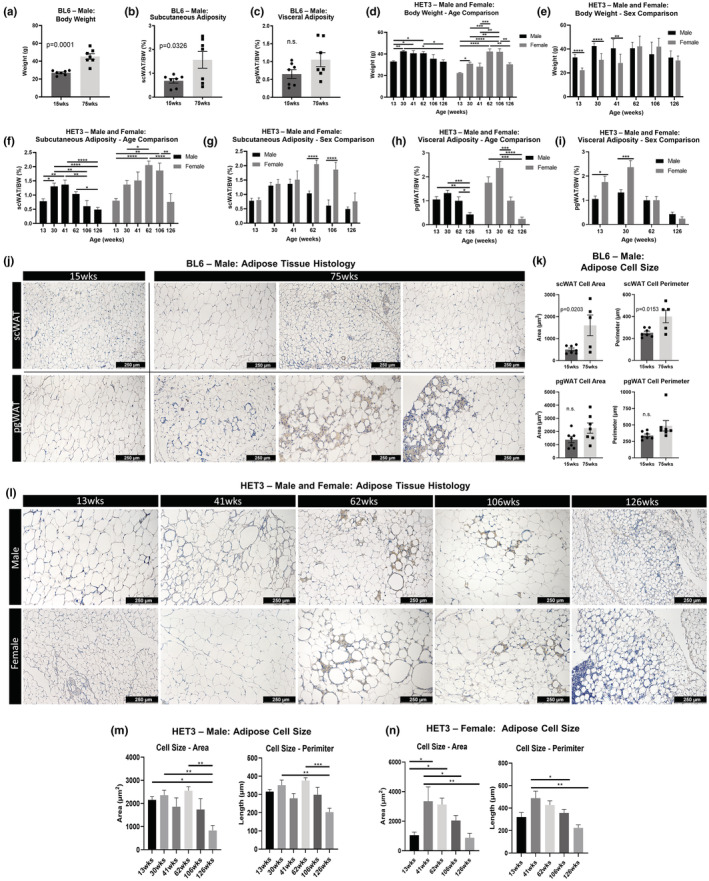
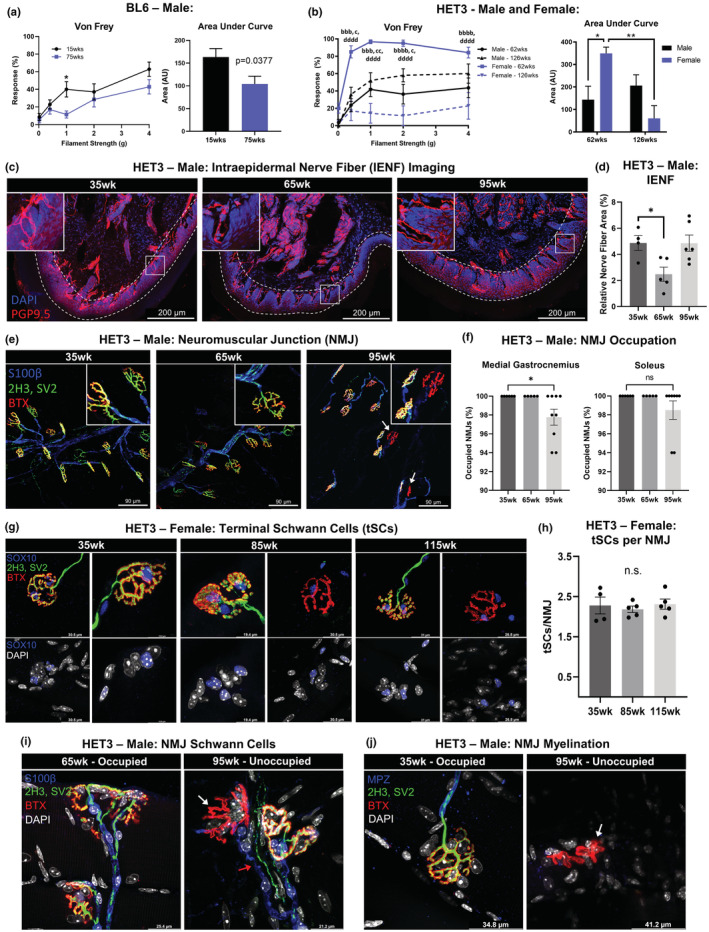
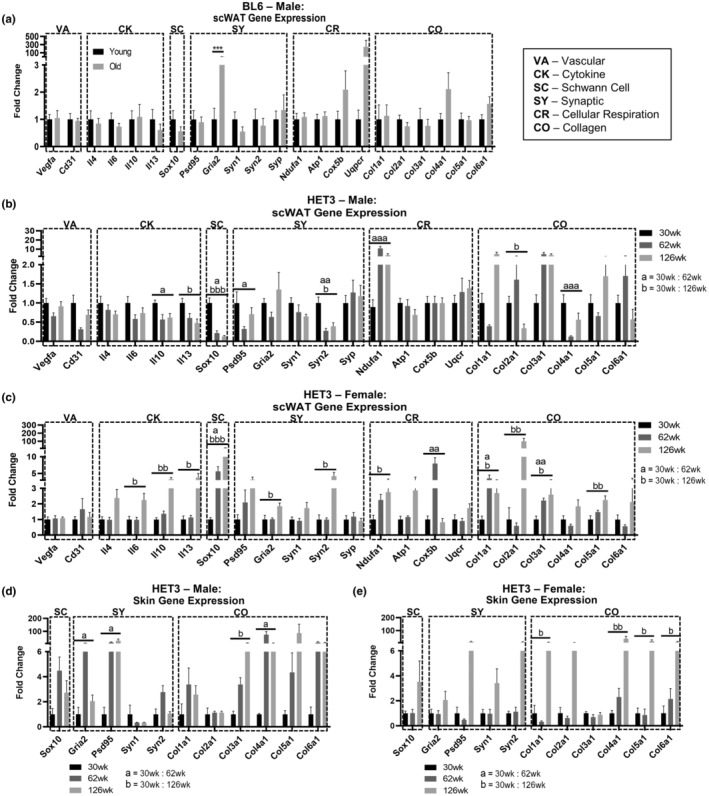
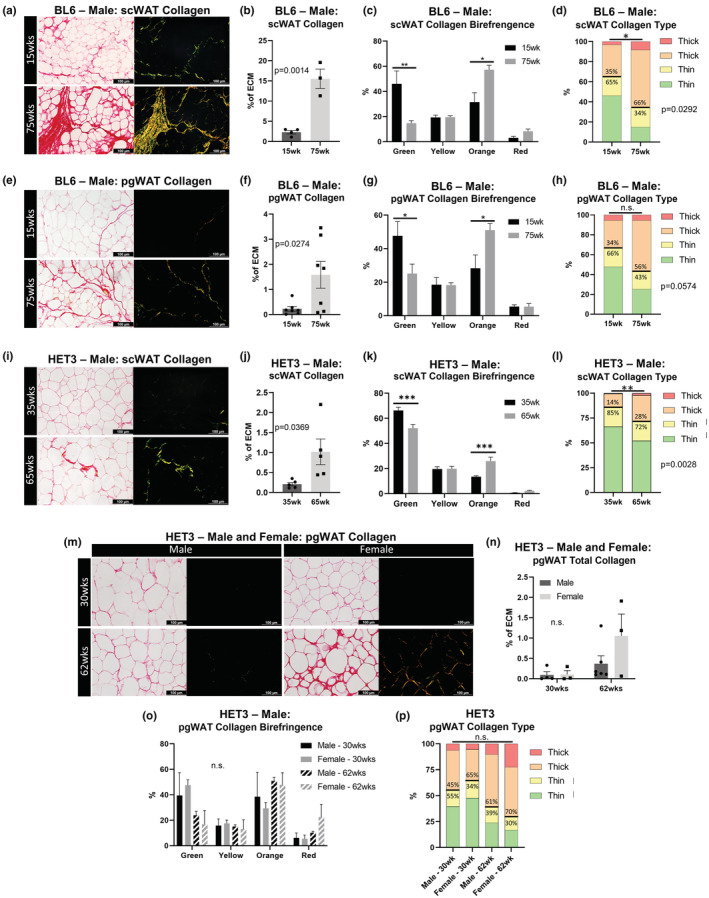
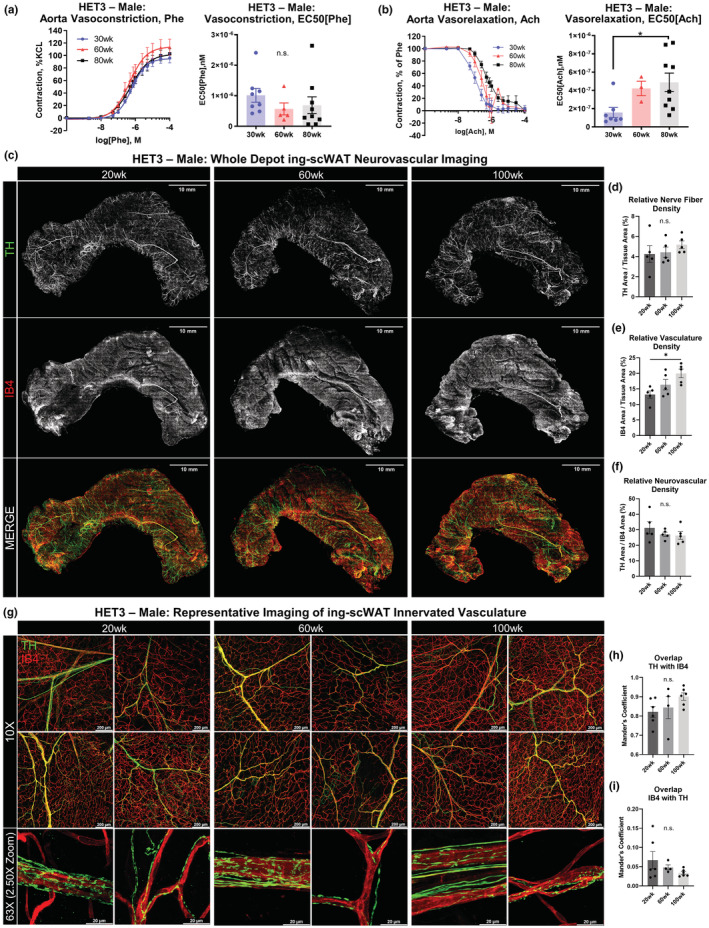
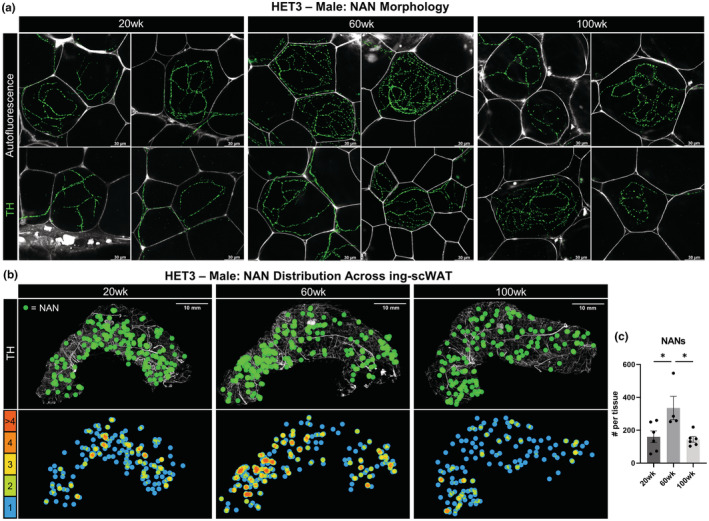
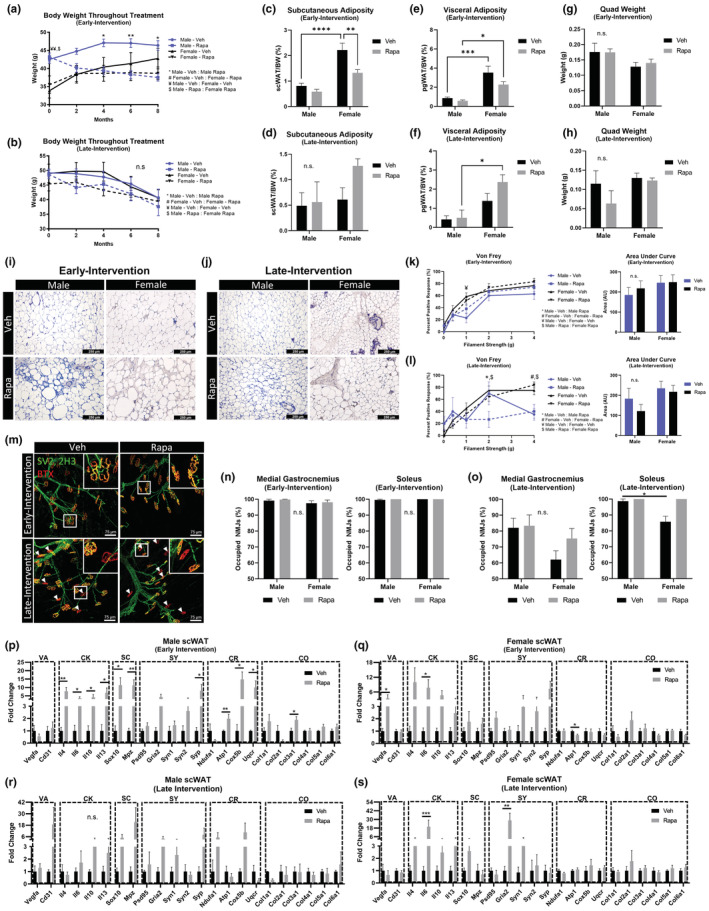
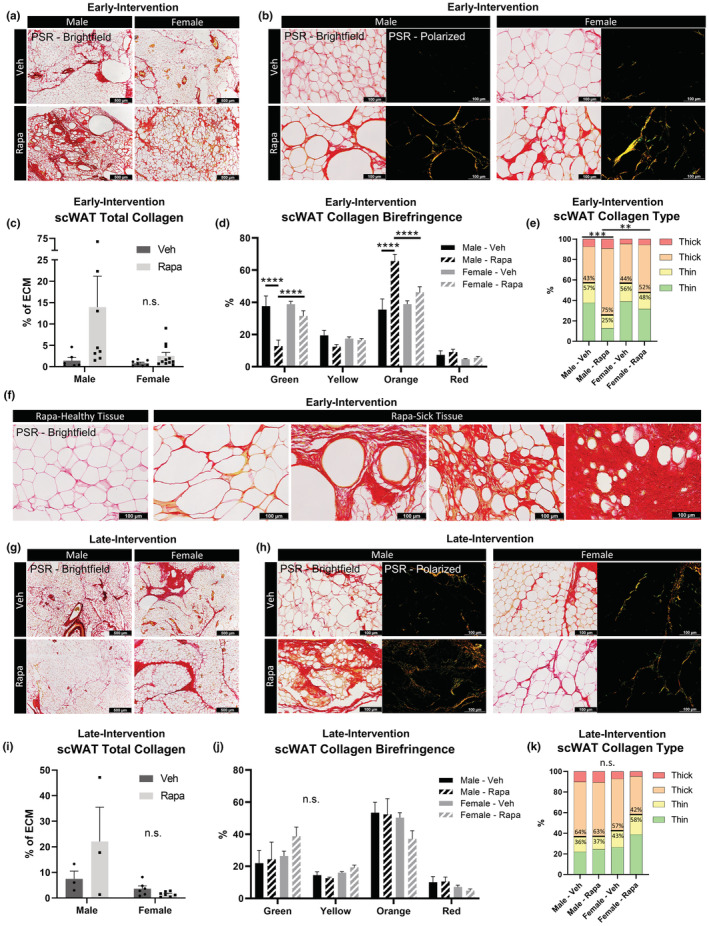
Neural communication between the brain and adipose tissues regulates energy expenditure and metabolism through modulation of adipose tissue functions. We have recently demonstrated that under pathophysiological conditions (obesity, diabetes, and aging), total subcutaneous white adipose tissue (scWAT) innervation is decreased ('adipose neuropathy'). With advanced age in the C57BL/6J mouse, small fiber peripheral nerve endings in adipose tissue die back, resulting in reduced contact with adipose-resident blood vessels and other cells. This vascular neuropathy and parenchymal neuropathy together likely pose a physiological challenge for tissue function. In the current work, we used the genetically diverse HET3 mouse model to investigate the incidence of peripheral neuropathy and adipose tissue dysregulation across several ages in both male and female mice. We also investigated the anti-aging treatment rapamycin, an mTOR inhibitor, as a means to prevent or reduce adipose neuropathy. We found that HET3 mice displayed a reduced neuropathy phenotype compared to inbred C56BL/6 J mice, indicating genetic contributions to this aging phenotype. Compared to female HET3 mice, male HET3 mice had worse neuropathic phenotypes by 62 weeks of age. Female HET3 mice appeared to have increased protection from neuropathy until advanced age (126 weeks), after reproductive senescence. We found that rapamycin overall had little impact on neuropathy measures, and actually worsened adipose tissue inflammation and fibrosis. Despite its success as a longevity treatment in mice, higher doses and longer delivery paradigms for rapamycin may lead to a disconnect between life span and beneficial health outcomes.

Keywords: HET3 mice; adipose tissue; aging; collagen; fibrosis; neuromuscular junction (NMJ); peripheral neuropathy; rapamycin; sex differences.


Conflict of interest statement

The authors declare no competing interests.

Figures

FIGURE 1
FIGURE 1
Genetic background influences on adiposity with aging. Male C57BL/6J (BL6) mice at 15 and 75 weeks of age were compared for body weight (a). Subcutaneous white adipose tissue (scWAT) and perigondal (pg)WAT weights were used to calculate subcutaneous adiposity (scWAT/body weight) (b) and visceral adiposities (pgWAT/body weight) (c). Male and female HET3 mice at 13, 30, 41, 62, 106, and 126 weeks were compared by age or sex for body weight (d,e), subcutaneous adiposity (f,g), and visceral adiposity (h,i). Hematoxylin staining was performed on BL6 mouse axillary (ax)‐scWAT and pgWAT (j) and cell sizes were quantified by area and perimeter (k). HET3 pgWAT was stained with hematoxylin (l) and cell size was quantified for males (m) and females (n). Three representative images were captured per tissue, quantified, and averaged per tissue per animal (j–n). BL6 mice; N = 3–7. HET3 mice; N = 5–12. Unpaired two‐tailed Student's t‐test (a–c,k). Two‐way ANOVA with Tukey's correction for multiple comparisons (d–i). One‐way ANOVA with Tukey's correction for multiple comparisons (m,n). Error bars are SEMs. n.s. p > 0.05, *p < 0.05, **p < 0.01, ***p < 0.001, ****p < 0.0001.
FIGURE 2
FIGURE 2
Age‐related neuropathy. Von Frey tactile allodynia test was performed on male BL6 mice at 15 and 75 weeks (a) and both male and female HET3 mice at 62 and 126 weeks (b). Compared by age and/or sex at each filament strength as well as for the area under each curve (a,b). Male HET3 mice at 35, 65, and 95 weeks had hind paw skin assessed for intraepidermal nerve fiber (IENF) density via immunolabeling and confocal imaging. Peripheral nerves (PGP9.5) and nuclei (DAPI) (c). Epidermal cell layer indicated by dashed lines (c). Relative nerve fiber density was quantified as the area of TH labeling normalized to epidermal area (d). Medial gastrocnemius and soleus muscles were stained for neuromuscular junction (NMJ) occupation nerve/pre‐synapse (SV2, 2H3), post‐synapse (BTX), and myelin (MPZ) (e). NMJ occupation was quantified and compared by age; 50 NMJs were counted per tissue (f). Terminal Schwann cell (tSC) nuclei were labeled (SOX10) in female HET3 mice at 35 weeks, 85, and 115 weeks and displayed tSCs located at occupied, altered, and unoccupied NMJs (g). Average number of tSCs per NMJ for 50 NMJs (h). NMJs were co‐stained with markers for Schwann cells (S100β) (i) and myelination (MPZ) (j). White arrows point no unoccupied NMJs and red arrow points to Schwann cell leading to unoccupied NMJ (i,j). BL6 mice; N = 7. HET3 mice; N = 4–12. Unpaired two‐tailed Student's t‐test (a). Two‐way ANOVA with Tukey's correction for multiple comparisons (b). One‐way ANOVA with Tukey's correction for multiple comparisons (d,f,h). Error bars are SEMs. n.s. p > 0.05, *p < 0.05, **p < 0.01, ***p < 0.001, ****p < 0.0001. a = male‐62 weeks:male‐126 weeks; b = female‐62 weeks:female‐126 weeks; c = male‐62 weeks:female‐62 weeks; d = male‐126 weeks:female‐126 weeks
FIGURE 3
FIGURE 3
Adipose tissue and skin gene expression changes across aging. Gene expression by qPCR in axillary scWAT from male BL6 mice (a). Gene expression in axillary scWAT of HET3, males (b) and females (c). Gene expression in axillary scWAT of HET3 in males (b) and females (c). Gene expression of HET3 flank skin in males (d) and females (e). Genes organized into functionally similar groups: vasculature (VA), cytokines (CK), Schwann cell (SC), synaptic (SY), cellular respiration (CR), and collagen (CO). BL6 mice; N = 6–7. HET3 mice; N = 5–7. Unpaired two‐tailed Student's t‐test (a). Kruskal–Wallis nonparametric test with Dunn's post hoc for multiple comparisons, corrected p‐values reported (b–d). Error bars are SEMs. n.s. p > 0.05, *p < 0.05, **p < 0.01, ***p < 0.001, ****p < 0.0001. a = 30 weeks:60 weeks, b = 30 weeks:126 weeks
FIGURE 4
FIGURE 4
Adipose tissue collagen distribution across aging. Picrosirius red (PSR) collagen staining and quantification of 7 μm thick adipose tissue sections. Male BL6 scWAT (a–d). Male BL6 pgWAT (e–h). Male HET3 scWAT (i–l). Male and female HET3 pgWAT (m–p). Representative images of the same regional tissue area were captured separately with bright‐field and polarized light at 20× objective magnification (a,e,i,m). Five representative images were captured per tissue per animal. Total collagen was measured as a ratio of birefringent collagen to total PSR staining (b,f,j,n). Changes in specific hues of collagen birefringence (c,g,k,o). Contribution of collagen fiber thickness determined by hue (d,h,l,p). Thin collagen fibers (green and yellow); thick collagen fibers (orange and yellow). BL6 mice; N = 3–7. HET3 mice; N = 3–6. Unpaired two‐tailed Student's t‐test (b,d,f,h,j,l). Two‐way ANOVA with Tukey's correction for multiple comparisons (c,g,k,n,o). One‐way ANOVA with Tukey's correction for multiple comparisons (P). All error bars are SEMs. n.s. p > 0.05, *p < 0.05, **p < 0.01, ***p < 0.001, ****p < 0.0001
FIGURE 5
FIGURE 5
Vascular changes with aging. Wire myography of male HET3 aortic vasoconstriction and (a) and vasorelaxation (b) at 30, 60, and 80 weeks (N = 3–9). Segments of thoracic aorta were contracted with a dose response of phenylephrine. Vessels were then returned to basal tone, and pre‐contracted to 50%–80% maximal phenylephrine‐induced contraction. Dose response curve of acetylcholine was performed to measure vasorelaxation (a). Vasocontraction was normalized to maximal KCl contraction, and vasorelaxation was calculated as percentage of Pre‐contraction (B). EC50 for contraction and relaxation were calculated (a,b). Intact inguinal scWAT depots were excised from male HET3 mice at 20, 60, and 100 weeks and labeled for nerves (tyrosine hydroxylase, TH) and blood vessels (isolectin IB4, IB4). Micrographs of whole tissues were generated from 10× objective magnification confocal images that were tiled together and Z‐maximum intensity projected (c). Representative images of N = 5 tissues are displayed (c). Relative nerve fiber density for the whole tissue was calculated as TH‐labeled area normalized to total tissue area (d). Relative vascular density for the whole tissue was calculated as IB4‐labeled area normalized to total tissue area (e). Relative neurovascular area was calculated as TH area normalized to IB4 area (f). Higher magnification representative maximum intensity projection images were captured at 10× objective magnification or 63× objective magnification with an additional 2.50× confocal zoom applied (g). Colocalization of nerve–blood vessel overlap was performed by comparing Mander's coefficients between groups. Higher values correspond to greater overlap. Overlap was calculated from the 10× objective magnification images of the intact whole tissues (N = 4–6, n = 5) (h,i). Scale bars are 10 mm (c), 200 μm and 20 μm (g). One‐way ANOVA with Tukey's correction for multiple comparisons. All error bars are SEMs. n.s. p > 0.05, *p < 0.05, **p < 0.01, ***p < 0.001, ****p < 0.0001
FIGURE 6
FIGURE 6
Neuro‐adipose nexus (NAN) distribution fluctuates with age. Intact inguinal scWAT depots were excised from male HET3 mice at 20, 60, and 100 weeks and labeled for nerves with TH. NANs were identified by densely varicose axons innervating single adipocytes (visualized with autofluorescence). NAN morphology compared across ages (a). NAN distribution across whole ing‐scWAT depots displayed as a representative tissue from each age group. Individual NANs labeled by a green dots superimposed over the intact tissue (b). Adjacent dot overlap was color coded and displayed below (b). Total number of NANs was counted for each tissue (N = 4–6) (c). Scale bars are 30 μm (a) and 10 mm (b). One‐way ANOVA with Tukey's correction for multiple comparisons. All error bars are SEMs. n.s. p > 0.05, *p < 0.05, **p < 0.01, ***p < 0.001, ****p < 0.0001
FIGURE 7
FIGURE 7
Rapamycin treatment had no effect on age‐related neuropathy in HET3 mice. Male and female HET3 mice were diet‐fed rapamycin (42 ppm) (Rapa) or received standard chow (Veh) for 8 months. Treatment was either started at 30 weeks (early‐intervention) or at 72 weeks (late intervention). Body weights were recorded through duration of treatment (a,b). Subcutaneous (c,d) and visceral (e,f) adiposity, and quad weight (g,h) at time tissue collection. Hematoxylin/Hemalum staining of scWAT (i,j). Von Frey tactile allodynia assay with area under each curve quantified (k,l). Medial gastrocnemius and soleus muscles were stained for NMJ occupation, nerve/pre‐synapse (SV2, 2H3), post‐synapse (BTX). Representative images of medial gastrocnemius muscles (m). White boxes are digital zoom‐ins of NMJs and white arrows mark unoccupied NMJs (m). NMJ occupation was quantified for medial gastrocnemius and soleus for early‐ (n) and late‐intervention groups (o). Gene expression of axillary scWAT was measured by qPCR (p–s). Genes organized into functionally similar groups: vasculature (VA), cytokines (CK), Schwann cell (SC), synaptic (SY), cellular respiration (CR), and collagen (CO). N = 3–12. Two‐way ANOVA with Tukey's correction for multiple comparisons (a–h,k,l,n,o). Mann–Whitney nonparametric test (p–s). All error bars are SEMs. n.s. p > 0.05, *p < 0.05, **p < 0.01, ***p < 0.001, ****p < 0.0001. a = male‐veh:male‐rapa; b = female‐veh:female‐rapa; c = male‐veh:female‐veh; d = male‐rapa:female‐rapa
FIGURE 8
FIGURE 8
Rapamycin treatment started early in life increased scWAT fibrosis. PSR staining of scWAT from early‐intervention (a–f) versus late‐Intervention (g–k) of rapamycin (42 ppm) treated male and female HET3 mice imaged at 4× objective magnification (a,g). Five representative images of tissue parenchyma were captured separately with bright‐field and polarized light at 20× objective magnification per tissue per animal (b,h). Total collagen was measured as a ratio of birefringent collagen to total PSR staining (c,i). Changes in specific hues of collagen birefringence (d,j). Contribution of collagen fiber thickness determined by hue (e,k). Thin collagen (green and yellow); thick collagen (orange and yellow). N = 3–11. Two‐way ANOVA with Tukey's correction for multiple comparisons (c,d,i,j). One‐way ANOVA with Tukey's correction for multiple comparisons (e,k). All error bars are SEMs. n.s. p > 0.05, *p < 0.05, **p < 0.01, ***p < 0.001, ****p < 0.0001

Similar articles

Cited by

References

    1. Arriola Apelo, S. I. , Neuman, J. C. , Baar, E. L. , Syed, F. A. , Cummings, N. E. , Brar, H. K. , Pumper, C. P. , Kimple, M. E. , & Lamming, D. W. (2016). Alternative rapamycin treatment regimens mitigate the impact of rapamycin on glucose homeostasis and the immune system. Aging Cell, 15(1), 28–38. 10.1111/acel.12405 - DOI - PMC - PubMed
    1. Bjune, J. I. , Stromland, P. P. , Jersin, R. A. , Mellgren, G. , & Dankel, S. N. (2022). Metabolic and epigenetic regulation by estrogen in adipocytes. Front Endocrinol (Lausanne), 13, 828780. 10.3389/fendo.2022.828780 - DOI - PMC - PubMed
    1. Blaszkiewicz, M. , Willows, J. W. , Dubois, A. L. , Waible, S. , DiBello, K. , Lyons, L. L. , Johnson, C. P. , Paradie, E. , Banks, N. , Motyl, K. , Michael, M. , Harrison, B. , & Townsend, K. L. (2019). Neuropathy and neural plasticity in the subcutaneous white adipose depot. PLoS One, 14(9), e0221766. 10.1371/journal.pone.0221766 - DOI - PMC - PubMed
    1. Blaszkiewicz, M. , Wood, E. , Koizar, S. , Willows, J. , Anderson, R. , Tseng, Y. H. , Godwin, J. , & Townsend, K. L. (2020). The involvement of neuroimmune cells in adipose innervation. Molecular Medicine, 26(1), 126. 10.1186/s10020-020-00254-3 - DOI - PMC - PubMed
    1. Bond, S. T. , Calkin, A. C. , & Drew, B. G. (2021). Sex differences in white adipose tissue expansion: Emerging molecular mechanisms. Clinical Science (London, England), 135(24), 2691–2708. 10.1042/CS20210086 - DOI - PubMed

Publication types