Rabies virus uniquely reprograms the transcriptome of human monocyte-derived macrophages
- PMID: 36798087
- PMCID: PMC9927221
- DOI: 10.3389/fcimb.2023.1013842
Rabies virus uniquely reprograms the transcriptome of human monocyte-derived macrophages
Abstract
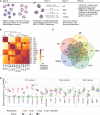
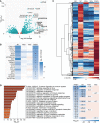
Macrophages are amongst the first immune cells that encounter rabies virus (RABV) at virus entry sites. Activation of macrophages is essential for the onset of a potent immune response, but insights into the effects of RABV on macrophage activation are scarce. In this study we performed high-throughput sequencing on RNA extracted from macrophages that were exposed to RABV for 48 hours, and compared their transcriptional profiles to that of non-polarized macrophages (M0), and macrophages polarized towards the canonical M1, M2a and M2c phenotypes. Our analysis revealed that RABV-stimulated macrophages show high expression of several M1, M2a and M2c signature genes. Apart from their partial resemblance to these phenotypes, unbiased clustering analysis revealed that RABV induces a unique and distinct polarization program. Closer examination revealed that RABV induced multiple pathways related to the interferon- and antiviral response, which were not induced under other classical polarization strategies. Surprisingly, our data show that RABV induces an activated rather than a fully suppressed macrophage phenotype, triggering virus-induced activation and polarization. This includes multiple genes with known antiviral (e.g. APOBEC3A, IFIT/OAS/TRIM genes), which may play a role in anti-RABV immunity.
Keywords: Lyssavirus; RNA sequencing; innate immunity; macrophage polarization; rabies virus (RABV); transcriptomics.
Copyright © 2023 Embregts, Wentzel, Dekker, van IJcken, Stadhouders and GeurtsvanKessel.
Conflict of interest statement
The authors declare that the research was conducted in the absence of any commercial or financial relationships that could be construed as a potential conflict of interest.
Figures


Similar articles
-
Street RABV Induces the Cholinergic Anti-inflammatory Pathway in Human Monocyte-Derived Macrophages by Binding to nAChr α7.Front Immunol. 2021 Feb 19;12:622516. doi: 10.3389/fimmu.2021.622516. eCollection 2021. Front Immunol. 2021. PMID: 33679766 Free PMC article.
-
Identification and Characterization of a Small-Molecule Rabies Virus Entry Inhibitor.J Virol. 2020 Jun 16;94(13):e00321-20. doi: 10.1128/JVI.00321-20. Print 2020 Jun 16. J Virol. 2020. PMID: 32321812 Free PMC article.
-
Transcriptome analysis of IL-10-stimulated (M2c) macrophages by next-generation sequencing.Immunobiology. 2017 Jul;222(7):847-856. doi: 10.1016/j.imbio.2017.02.006. Epub 2017 Feb 20. Immunobiology. 2017. PMID: 28318799 Free PMC article.
-
Status of antiviral therapeutics against rabies virus and related emerging lyssaviruses.Curr Opin Virol. 2019 Apr;35:1-13. doi: 10.1016/j.coviro.2018.12.009. Epub 2019 Feb 10. Curr Opin Virol. 2019. PMID: 30753961 Free PMC article. Review.
-
Regulation of innate immune responses by rabies virus.Animal Model Exp Med. 2022 Oct;5(5):418-429. doi: 10.1002/ame2.12273. Epub 2022 Sep 22. Animal Model Exp Med. 2022. PMID: 36138548 Free PMC article. Review.
Cited by
-
Comparative Transcriptomics Analysis of Foot-and-Mouth Disease Virus-Infected Cell Model Systems.Vet Sci. 2025 Feb 1;12(2):107. doi: 10.3390/vetsci12020107. Vet Sci. 2025. PMID: 40005867 Free PMC article.
-
Selective inhibition of rabies virus gene expression by human miRNAs: a therapeutic approach using the 7mer-m8 model.Virus Genes. 2025 Aug;61(4):474-489. doi: 10.1007/s11262-025-02155-1. Epub 2025 Apr 15. Virus Genes. 2025. PMID: 40234303
-
A comparative analysis of the dendritic cell response upon exposure to different rabies virus strains.PLoS Negl Trop Dis. 2025 Apr 10;19(4):e0012994. doi: 10.1371/journal.pntd.0012994. eCollection 2025 Apr. PLoS Negl Trop Dis. 2025. PMID: 40208887 Free PMC article.
References
-
- Bengtsson H. (2021). matrixStats: Functions that apply to rows and columns of matrices (and to vectors).
-
- Blighe K., Lun A. (2021) PCAtools: Everything principal compenents analysis. Available at: https://github.com/kevinblighe/PCAtools.
Publication types
MeSH terms
Substances
LinkOut - more resources
Full Text Sources
Medical
Molecular Biology Databases

