[Preprint]. 2023 Feb 6:2023.02.05.527215.
doi: 10.1101/2023.02.05.527215.

Prior vaccination enhances immune responses during SARS-CoV-2 breakthrough infection with early activation of memory T cells followed by production of potent neutralizing antibodies

Affiliations

Prior vaccination enhances immune responses during SARS-CoV-2 breakthrough infection with early activation of memory T cells followed by production of potent neutralizing antibodies

Mark M Painter et al. bioRxiv. .

Update in

  • Prior vaccination promotes early activation of memory T cells and enhances immune responses during SARS-CoV-2 breakthrough infection.
    Painter MM, Johnston TS, Lundgreen KA, Santos JJS, Qin JS, Goel RR, Apostolidis SA, Mathew D, Fulmer B, Williams JC, McKeague ML, Pattekar A, Goode A, Nasta S, Baxter AE, Giles JR, Skelly AN, Felley LE, McLaughlin M, Weaver J; Penn Medicine BioBank; Kuthuru O, Dougherty J, Adamski S, Long S, Kee M, Clendenin C, da Silva Antunes R, Grifoni A, Weiskopf D, Sette A, Huang AC, Rader DJ, Hensley SE, Bates P, Greenplate AR, Wherry EJ. Painter MM, et al. Nat Immunol. 2023 Oct;24(10):1711-1724. doi: 10.1038/s41590-023-01613-y. Epub 2023 Sep 21. Nat Immunol. 2023. PMID: 37735592

Abstract

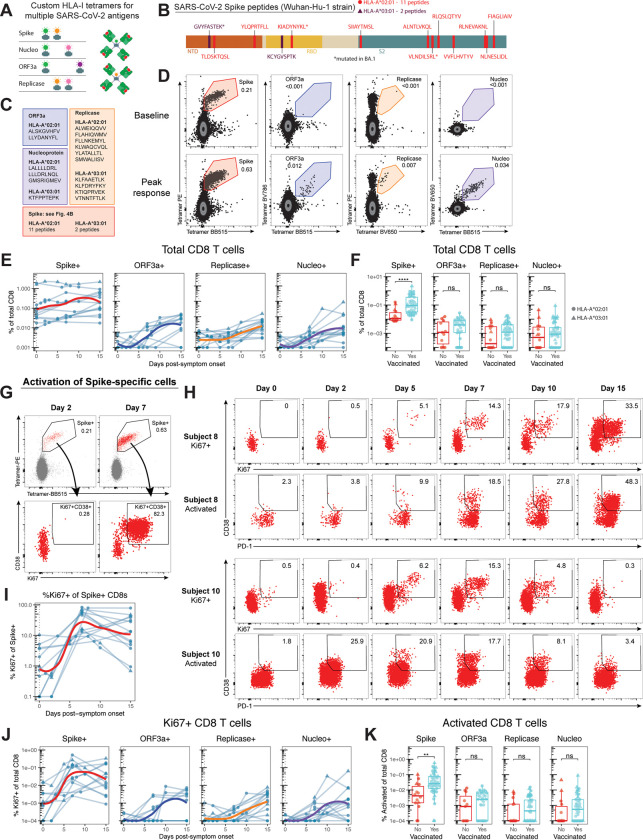
SARS-CoV-2 infection of vaccinated individuals is increasingly common but rarely results in severe disease, likely due to the enhanced potency and accelerated kinetics of memory immune responses. However, there have been few opportunities to rigorously study early recall responses during human viral infection. To better understand human immune memory and identify potential mediators of lasting vaccine efficacy, we used high-dimensional flow cytometry and SARS-CoV-2 antigen probes to examine immune responses in longitudinal samples from vaccinated individuals infected during the Omicron wave. These studies revealed heightened Spike-specific responses during infection of vaccinated compared to unvaccinated individuals. Spike-specific CD4 T cells and plasmablasts expanded and CD8 T cells were robustly activated during the first week. In contrast, memory B cell activation, neutralizing antibody production, and primary responses to non-Spike antigens occurred during the second week. Collectively, these data demonstrate the functionality of vaccine-primed immune memory and highlight memory T cells as rapid responders during SARS-CoV-2 infection.


Conflict of interest statement

Declaration of Interests

E.J.W. is a member of the Parker Institute for Cancer Immunotherapy which supported this study. SEH has received consultancy fees from Sanofi Pasteur, Lumen, Novavax, and Merk for work unrelated to this report. E.J.W. is an advisor for Danger Bio, Janssen, New Limit, Marengo, Pluto Immunotherapeutics Related Sciences, Santa Ana Bio, Synthekine, and Surface Oncology. E.J.W. is a founder of and holds stock in Surface Oncology, Danger Bio, and Arsenal Biosciences. AS is a consultant for Gritstone Bio, Flow Pharma, Moderna, AstraZeneca, Qiagen, Fortress, Gilead, Sanofi, Merck, RiverVest, MedaCorp, Turnstone, NA Vaccine Institute, Emervax, Gerson Lehrman Group and Guggenheim. La Jolla Institute for Immunology has filed for patent protection for various aspects of T cell epitope and vaccine design work.

Figures

Fig. 1:
Fig. 1:. Spike-specific plasmablast expansion during the 1st week of breakthrough infection precedes an increase in neutralizing antibodies during the 2nd week.
A) Schematic overview of a previously-published cohort before and after a 3rd dose of SARS-CoV-2 mRNA vaccine. B) Schematic overview of the longitudinally-sampled Omicron breakthrough infection cohort. C) Wuhan-Hu-1 RBD binding antibody titers after vaccination as previously published (left) and during breakthrough infection (right). D) ELISA endpoint titers for RBD-binding antibodies specific for the indicated SARS-CoV-2 variants. E) Fold change in binding antibody titer from baseline to day 15 for each of the indicated variants. F) D614G neutralizing antibody titers observed after vaccination as previously published (left) and during breakthrough infection (right). G) Omicron BA.1.1 neutralizing antibody titers (left) and the neutralizing ratio of BA.1.1 to D614G observed during breakthrough infection (right). H) Change in neutralizing titers from pre-infection baseline samples calculated as absolute increase (baseline subtracted from observed) for D614G and BA.1.1. I) Neutralizing potency of binding antibodies calculated as the neutralizing titer divided by the paired RBD-binding titer for each variant (e.g. BA.1.1 FRNT50/ BA.1.1 binding antibody titer). Units are arbitrary. J) Schematic overview of the vaccinated versus unvaccinated cross-sectional cohort. K) D614G (left) and BA.1.1 (right) neutralizing antibody titers during infection of vaccinated and unvaccinated individuals. L) Schematic representation of SARS-CoV-2 Spike protein domains, B cell responses, and the flow cytometric approach for identifying antigen-specific memory B cells. M) Representative flow cytometric gating of total and antigen-specific plasmablasts from a single subject. All antigen-specific populations were gated on cells that did not bind a streptavidin decoy probe. Labels above plots indicate the population being displayed after upstream gating. N) Flow cytometric data depicting the frequency of total B cells that are plasmablasts or antigen-specific plasmablasts binding the indicated domains of Spike or Nucleocapsid during breakthrough infection. Thin lines indicate individual subjects sampled longitudinally, solid lines represent a best-fit curve of the mean response over time. Statistics calculated using Wilcoxon test with Benjamini-Hochberg correction for multiple comparisons. Statistics and fold changes without brackets are in comparison to day 0 or the unvaccinated group.
Fig. 2:
Fig. 2:. Vaccination promotes larger Spike-specific memory B cell responses that become activated, expand, and class switch during the second week of breakthrough infection.
A) Representative flow cytometric gating of antigen-specific memory B cells from a single subject. All antigen-specific populations were gated on cells that did not bind a streptavidin decoy probe. Labels above plots indicate the population being displayed after upstream gating. B) Flow cytometric data depicting the frequency of total B cells that are memory B cells binding Spike or Nucleocapsid antigens during Omicron breakthrough infection. C) Frequency of total B cells specific for the indicated domains of Spike during SARS-CoV-2 infection in previously vaccinated or unvaccinated individuals from the cross-sectional cohort. D-E) Percent of Spike-binding memory B cells targeting the S2, NTD, or RBD domains during SARS-CoV-2 infection in the longitudinal cohort (D) and the cross-sectional cohort (E). F) Percent of WT RBD-binding memory B cells that cross bind the indicated variant RBDs during SARS-CoV-2 breakthrough infection of vaccinated individuals from the cross-sectional cohort, separated by the dominant circulating variant at the time of positive test. G) Representative flow cytometry plots from a single subject showing the development of activated WT RBD-specific memory B cells (CD71+) and IgA+ memory B cells during SARS-CoV-2 breakthrough infection. H) Frequency of total B cells that are activated (CD71+) memory B cells and bind Spike or Nucleocapsid antigens during Omicron breakthrough infection. I) Frequency of total B cells that are activated memory B cells and specific for the indicated domains of Spike during SARS-CoV-2 infection in previously vaccinated or unvaccinated individuals. J) Percent of CD71+ Spike-binding memory B cells targeting the S2, NTD, or RBD domains during SARS-CoV-2 infection. K) Frequency of total B cells that are CD71+ and specific for Nucleocapsid or Spike, comparing primary and recall memory B cell responses at day 15 of breakthrough infection. L) Frequency of total B cells that are IgA+ memory B cells and bind Spike or Nucleocapsid antigens during Omicron breakthrough infection. M) Percent of WT and BA.1 RBD-binding B cells that are IgA+ during breakthrough infection. Statistics calculated using Wilcoxon test with Benjamini-Hochberg correction for multiple comparisons.
Fig. 3:
Fig. 3:. Spike-specific CD4 T cells expand during the first week of breakthrough infection while T cell responses to non-Spike SARS-CoV-2 antigens peak at day 15.
A) Representative flow cytometric gating of CD4 (left) and CD8 (right) T cells expressing activation induced markers (AIM) after 24 hours of culture in the absence of peptides (unstim, background) or the indicated peptide megapools. B-C) Background-subtracted frequency of AIM+ (CD200+ CD40L+) CD4 T cells (left), Th1 cells (center, CXCR5− CXCR3+ CCR6−), and cTfh cells (right, CXCR5+) after stimulation with the Spike (B) or non-Spike (C) megapools, calculated as a percent of non-naïve CD4 T cells. D) Comparison of total Spike- and Non-Spike-specific CD4 T cell responses during Omicron infection. E) Background-subtracted frequency of AIM+ (IFNγ+ 41BB+) CD8 T cells after stimulation with the non-Spike or Spike megapools, calculated as a percent of non-naïve CD8 T cells during Omicron infection (left, center) or after a 3rd dose of mRNA vaccine (right). Statistics calculated using Wilcoxon test with Benjamini-Hochberg correction for multiple comparisons.
Fig. 4:
Fig. 4:. Vaccination promotes greater Spike-specific CD8 T cell responses that are activated during the first week of breakthrough infection without impeding primary responses to non-Spike antigens.
A) Schematic representation of multiplex HLA-I/peptide tetramer assay for SARS-CoV-2 antigens using distinct combinations of fluorophore-conjugated streptavidin to assemble tetramers for each antigen. B) Diagram of the SARS-CoV-2 Spike protein highlighting structural domains and indicating peptides included in Spike-specific HLA-I tetramer pools for HLA-A*02:01 (red) and HLA-A*03:01 (purple). C) List of peptides included in HLA-I tetramer pools to identify CD8 T cells targeting SARS-CoV-2 ORF3a, Replicase, and Nucleocapsid. D) Representative flow cytometric gating of antigen-specific CD8 T cells identified using HLA-I tetramers with distinct dual-fluorescence profiles for each antigen. E) Flow cytometric data quantifying the percent of total CD8 T cells that bind HLA-I/peptide tetramers from each antigen during SARS-CoV-2 breakthrough infection. F) Frequency of total CD8 T cells that are specific for the indicated SARS-CoV-2 antigens during SARS-CoV-2 infection in previously vaccinated or unvaccinated individuals. G-H) Representative flow cytometry plots from 3 subjects depicting the activation of Spike-specific CD8 T cells during SARS-CoV-2 breakthrough infection, highlighting peak activation (G) and activation kinetics (H) of Spike-specific CD8 T cells in red. I) Percent of Spike-specific CD8 T cells that express Ki67 and at least one other activation marker (Fig. S3C–D). J) Percent of total CD8 T cells that are antigen-specific and express Ki67 and at least one other activation marker. K) Percent of total CD8 T cells that are antigen-specific and express at least two activation markers during SARS-CoV-2 infection in previously vaccinated or unvaccinated individuals (Fig. S3C–D). Statistics calculated using Wilcoxon test with Benjamini-Hochberg correction for multiple comparisons.
Fig. 5:
Fig. 5:. Vaccination promotes activation of central memory CD8 T cells that peaks during the first week of breakthrough infection.
A) Representative flow cytometric gating of CD8 T cell subsets from bulk CD8 T cells. Numbers in gates represent the percent of total CD8 T cells falling in the gate. Bolded populations are represented in subsequent figures. B) Unbiased dimensionality reduction by Uniform Manifold Approximation and Projection (UMAP) of 16 parameters (see Fig. S4A) from flow cytometric analysis of bulk CD8 T cells from 32 unique samples. Cells are colored by manually gated subsets defined as in A. C) Average distribution of Spike-specific CD8 T cells into manually gated subsets during breakthrough infection. D) The abundance of Spike-specific CD8 T cells in each subset during breakthrough infection, calculated as the percent of total CD8 T cells. Statistics compare later timepoints to the baseline timepoint. E) The magnitude of the Ki67+ Spike-specific CD8 T cell response in each subset during breakthrough infection as a percent of total CD8 T cells, where cells express Ki67 and at least one other activation marker. F) The magnitude of the activated Spike-specific CD8 T cell response in each subset during SARS-CoV-2 infection of previously vaccinated or unvaccinated individuals, calculated as a percent of total CD8 T cells. Activated cells express at least two activation markers. G) The percent Ki67 positivity of Spike-specific CD8 T cells in each subset, where cells express Ki67 and at least one other activation marker. H) The subset distribution of total (top) and Ki67+ (bottom) Spike-specific CD8 T cells at day 7 post-symptom onset for eleven participants with paired pre-infection samples. I) Subset distribution of Ki67+ Spike-specific CD8 T cells at day 7 post-symptom onset. J-M) Correlations within Spike-specific CD8 T cell responses. J) Day 7 percent CM of Spike+ cells and day 7 percent Ki67+ of Spike+ cells, K) day 7 percent CM of Spike+ cells and day 7 total Ki67+, L) day 0 total CM lineage and day 7 total Ki67+, M) day 0 total EM lineage and day 7 total Ki67+. Statistics calculated using Wilcoxon test with Benjamini-Hochberg correction for multiple comparisons.
Fig. 6:
Fig. 6:. Rapid memory T cell activation and pre-existing antibodies represent the early systemic adaptive immune responses during SARS-CoV-2 breakthrough infection.
Overlaid kinetics of immune responses described in Figures 1–5 depicted as the fraction of the peak response observed. The mean response value was calculated for samples at each of pre-infection baseline, day 7, and day 15.

References

    1. Khoury D.S. et al. Neutralizing antibody levels are highly predictive of immune protection from symptomatic SARS-CoV-2 infection. Nature medicine 27, 1205–1211 (2021). - PubMed
    1. Addetia A. et al. Neutralizing antibodies correlate with protection from SARS-CoV-2 in humans during a fishery vessel outbreak with a high attack rate. Journal of clinical microbiology 58, e02107–02120 (2020). - PMC - PubMed
    1. Cao Y. et al. Omicron escapes the majority of existing SARS-CoV-2 neutralizing antibodies. Nature 602, 657–663 (2022). - PMC - PubMed
    1. Andrews N. et al. Covid-19 Vaccine Effectiveness against the Omicron (B.1.1.529) Variant. New England Journal of Medicine 386, 1532–1546 (2022). - PMC - PubMed
    1. Canetti M. et al. Six-Month Follow-up after a Fourth BNT162b2 Vaccine Dose. New England Journal of Medicine 387, 2092–2094 (2022). - PMC - PubMed

Publication types