[Preprint]. 2023 Feb 7:2023.02.06.527285.
doi: 10.1101/2023.02.06.527285.

Mitochondrial metabolism in primary and metastatic human kidney cancers

Affiliations

Mitochondrial metabolism in primary and metastatic human kidney cancers

Divya Bezwada et al. bioRxiv. .

Update in

  • Mitochondrial complex I promotes kidney cancer metastasis.
    Bezwada D, Perelli L, Lesner NP, Cai L, Brooks B, Wu Z, Vu HS, Sondhi V, Cassidy DL, Kasitinon S, Kelekar S, Cai F, Aurora AB, Patrick M, Leach A, Ghandour R, Zhang Y, Do D, McDaniel P, Sudderth J, Dumesnil D, House S, Rosales T, Poole AM, Lotan Y, Woldu S, Bagrodia A, Meng X, Cadeddu JA, Mishra P, Garcia-Bermudez J, Pedrosa I, Kapur P, Courtney KD, Malloy CR, Genovese G, Margulis V, DeBerardinis RJ. Bezwada D, et al. Nature. 2024 Sep;633(8031):923-931. doi: 10.1038/s41586-024-07812-3. Epub 2024 Aug 14. Nature. 2024. PMID: 39143213 Free PMC article.

Abstract

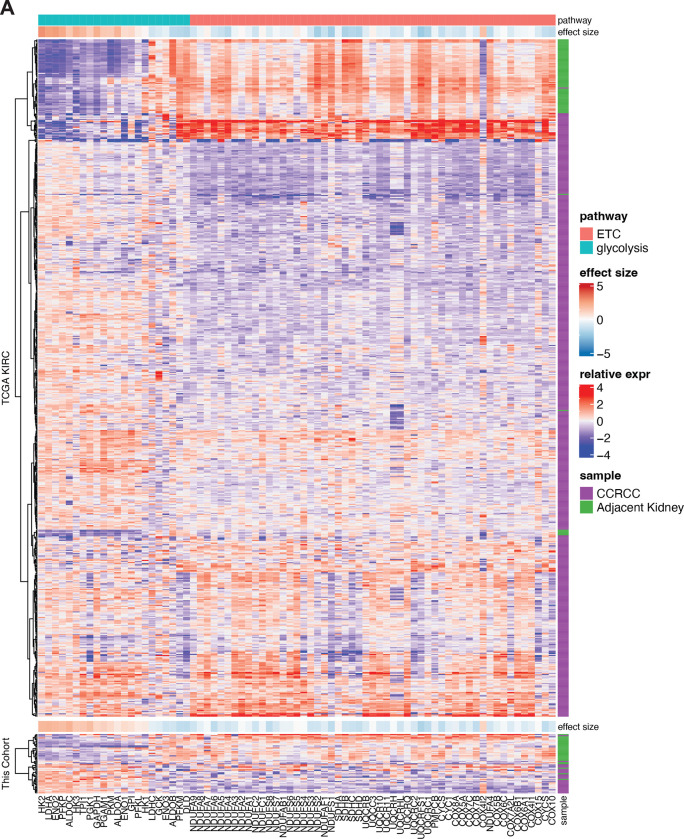
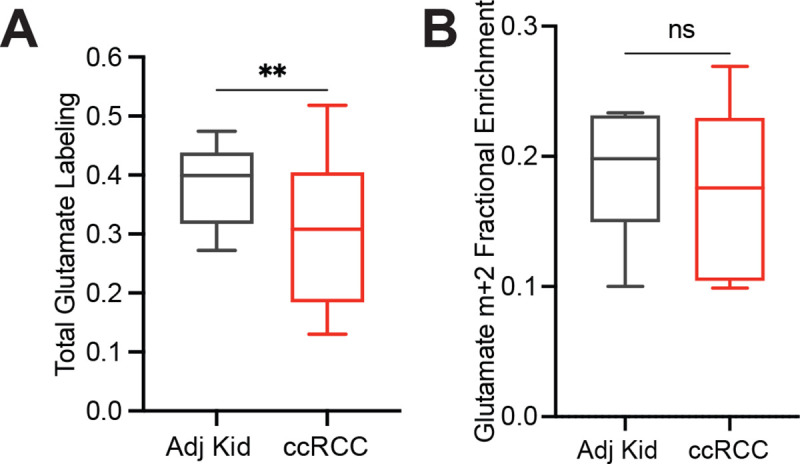
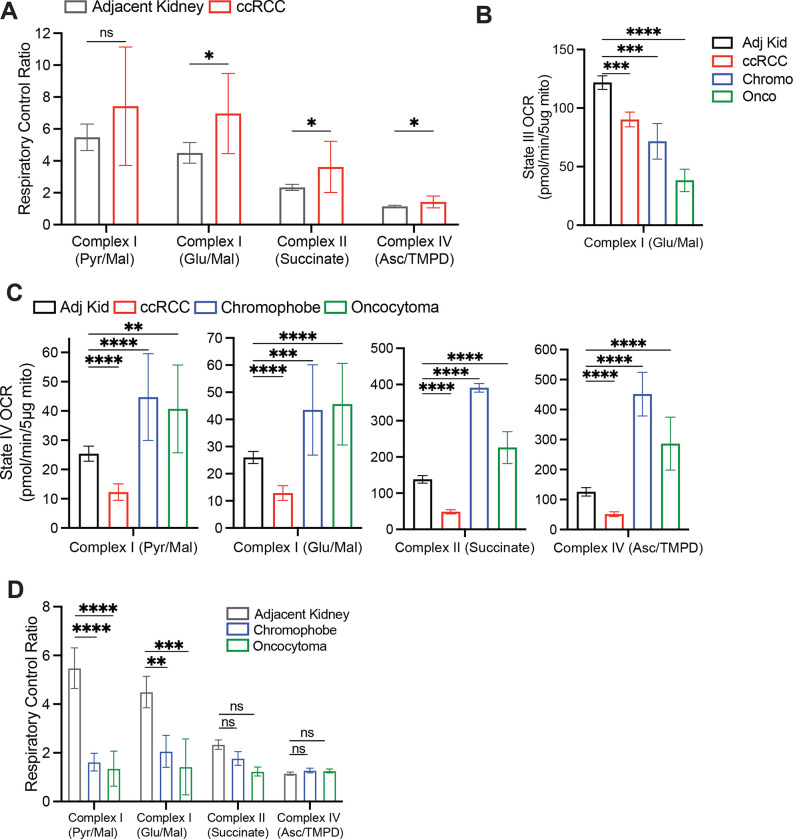
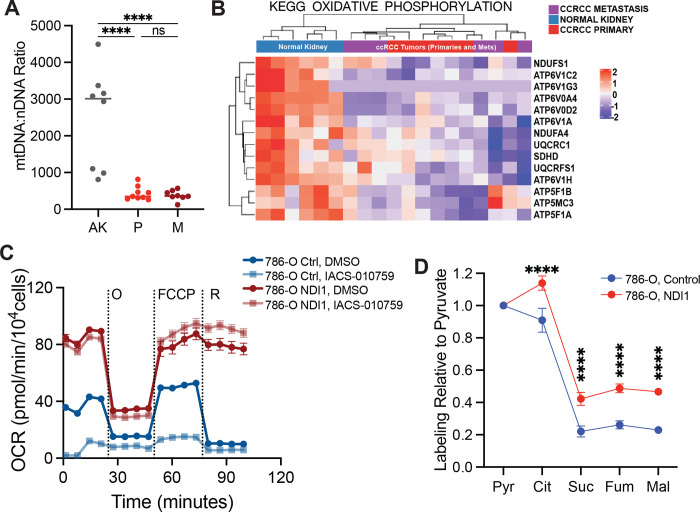
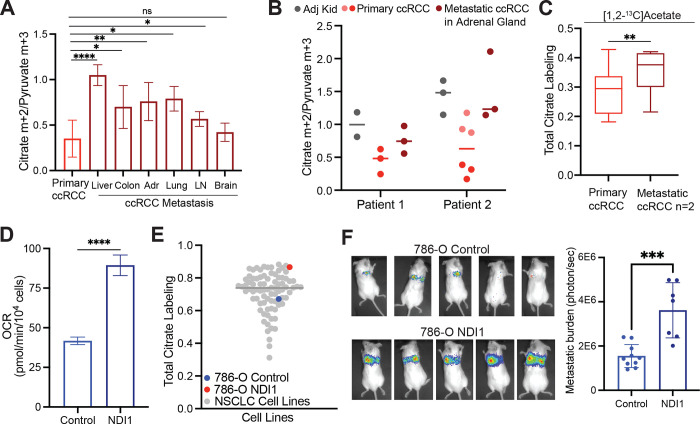
Most kidney cancers display evidence of metabolic dysfunction1-4 but how this relates to cancer progression in humans is unknown. We used a multidisciplinary approach to infuse 13C-labeled nutrients during surgical tumour resection in over 70 patients with kidney cancer. Labeling from [U-13C]glucose varies across cancer subtypes, indicating that the kidney environment alone cannot account for all metabolic reprogramming in these tumours. Compared to the adjacent kidney, clear cell renal cell carcinomas (ccRCC) display suppressed labelling of tricarboxylic acid (TCA) cycle intermediates in vivo and in organotypic slices cultured ex vivo, indicating that suppressed labeling is tissue intrinsic. Infusions of [1,2-13C]acetate and [U-13C]glutamine in patients, coupled with respiratory flux of mitochondria isolated from kidney and tumour tissue, reveal primary defects in mitochondrial function in human ccRCC. However, ccRCC metastases unexpectedly have enhanced labeling of TCA cycle intermediates compared to primary ccRCCs, indicating a divergent metabolic program during ccRCC metastasis in patients. In mice, stimulating respiration in ccRCC cells is sufficient to promote metastatic colonization. Altogether, these findings indicate that metabolic properties evolve during human kidney cancer progression, and suggest that mitochondrial respiration may be limiting for ccRCC metastasis but not for ccRCC growth at the site of origin.


Conflict of interest statement

Declaration of Interests R.J.D. is a founder and advisor at Atavistik Bio, and serves on the Scientific Advisory Boards of Agios Pharmaceuticals, Vida Ventures and Droia Ventures. I.P. has served in Scientific Advisory Boards of Health Tech International, Merck, and Otsuka, and he is co-inventor of patents with Philips Healthcare.

Figures

Extended Data Figure 1:
Extended Data Figure 1:. Studied ccRCC tumours reflect heterogenous ccRCC biology
(A) Correlation of RNA sequencing data from the TCGA KIRC cohort reporting ccRCC tumours versus the ccRCC tumours infused with [U-13C]glucose. Data are plotted as the effect size (Cohen’s d) reflecting the increase (d>0) or decrease (d<0) in mRNA abundance in tumours relative to adjacent kidney. Genes involved in glycolysis and the electron transport chain (ETC) are highlighted as indicated. (B) Matched citrate m+2/pyruvate m+3 ratio from patients infused with [U-13C]glucose. The x-axis indicates 28 different patients in whom both tumour and kidney tissue was available. Patients in whom the average citrate m+2/Pyruvate m+3 ratio was higher in ccRCC tissue are highlighted in grey boxes; this difference reached statistical significance only in patient 28. (C) Enrichment in glycolytic and TCA cycle intermediates associated with glucose oxidation for ccRCC and papillary tumours. Labelling is normalized to the matched adjacent kidney. (D) Total malate labeling (1−(m+0)) from [U-13C]glucose in patients or tissue slices after 3 hours of labeling. All data represent mean ± standard deviation. Statistical significance was assessed using unpaired t-tests (A-C). *P < 0.05, **P < 0.01, ***P < 0.001, ****P<0.0001. Adj Kid = adjacent kidney, ccRCC = clear cell renal cell carcinoma
Extended Data Figure 2:
Extended Data Figure 2:. mRNA abundance of ETC and glycolysis genes in primary ccRCC tumours
(A) mRNA abundance for genes related to glycolysis and the electron transport chain (ETC) in the TCGA KIRC cohort versus the cohort infused with [U-13C]glucose in this study. The ETC genes were selected from the gene ontology cellular component (cc) library combining Complex I-IV. The glycolysis genes are shared genes among the following four gene sets: KEGG_GLYCOLYSIS_GLUCONEOGENESIS, REACTOME_GLYCOLYSIS, HALLMARK_GLYCOLYSIS, WP_GLYCOLYSIS_AND_GLUCONEOGENESIS.
Extended Data Figure 3:
Extended Data Figure 3:. Glutamate enrichment in acetate infused patients
(A) Total labeling (1−(m+0)) of glutamate from ccRCC patients infused with [1,2-13C]acetate. (B) Fractional abundance of glutamate m+2 from ccRCC patients infused with [1,2-13C]acetate. Statistical significance was assessed using unpaired t-tests (A, B). *P < 0.05, **P < 0.01, ***P < 0.001, ****P<0.0001. Adj Kid = adjacent kidney, ccRCC = clear cell renal cell carcinoma
Extended Data Figure 4:
Extended Data Figure 4:. Citrate enrichment in plasma of glutamine infused patients.
(A) Fractional abundance of citrate m+5 in plasma at the time of resection and in ccRCC tumour samples. Statistical significance was assessed using unpaired t-tests (A, B). *P < 0.05, **P < 0.01, ***P < 0.001, ****P<0.0001. ccRCC = clear cell renal cell carcinoma
Extended Data Figure 5:
Extended Data Figure 5:. Respiration of primary human kidney cancers
(A) Respiratory control ratio (RCR) for mitochondria from the adjacent kidney and ccRCCs. RCR is the ratio of State III ADP-stimulated OCR to the State IV basal OCR. (B) State III ADP-stimulated oxygen consumption rates (OCR) from mitochondria isolated from primary human tissues, using glutamate and malate to stimulate Complex I. (C) State IV basal OCR from mitochondria isolated from primary human tissues. Injected substrates are indicated under each complex. (D) Respiratory control ratio (RCR) for chromophobe RCCs and oncocytomas. Panels A-C represent mean ± 95% confidence intervals, and panel D represents mean ± standard deviation. Statistical significance was assessed using an unpaired two tailed parametric t-test (A) or one way analysis of variance (ANOVA) with a multiple comparison adjustment using Tukey’s methods (B-D). ns P>0.05, *P < 0.05, **P < 0.01, ***P < 0.001, ****P<0.0001. TMPD = N,N,N,N-tetramethyl-p-phenylenediamine.
Extended Data Figure 6:
Extended Data Figure 6:. Mitochondrial characteristics in metastasizing ccRCC tumours and ccRCC cells
(A) mtDNA:nDNA ratio from 7 patients from the adjacent kidney (AK), primary ccRCC (P), and metastastic ccRCC (M). (B) Heat map of the most differentially expressed genes in the oxidative phosphorylation gene set from RNA sequencing of the 7 matched patients in Extended Data Fig 6A. (C) Oxygen consumption rates of 786-O cells expressing either the control empty vector or NDI-1. IACS-010759 is a Complex I inhibitor. (D) Total labeling in TCA cycle intermediates relative to pyruvate. Statistical significance was assessed using an unpaired two tailed parametric t-test (A) or one way analysis of variance (ANOVA) with a multiple comparison adjustment using Tukey’s methods (B-D). ns P>0.05, *P < 0.05, **P < 0.01, ***P < 0.001, ****P<0.0001. O = oligomycin, FCCP = carbonyl cyanide-p-trifluoromethoxyphenyl-hydrazon, R = rotenone.
Figure 1:
Figure 1:. Glucose metabolism varies amongst kidney cancer subtypes.
(A) Schematic of intraoperative infusions. (B) Schematic of isotopologue labeling in the tricarboxylic acid (TCA) cycle from [U-13C]glucose via pyruvate dehydrogenase (PDH). 13C carbons are indicated as red circles. (C) Citrate m+2/pyruvate m+3 ratio from patients infused with [U-13C]glucose. Each data point reflects an individual fragment of tissue. (D) Nested analysis of citrate m+2/pyruvate m+3 ratios separated by patient. Each data point represents a different patient. Error bars reflect the standard deviation from three fragments, tissue permitting, from the same patient. (E) Total isotopologue labeling (i.e. 1−(m+0)) of TCA cycle intermediates divided by total isotopologue labeling of pyruvate. (F) Schematic of organotypic patient tissue cultures. Tissue sections of ~300 μM were placed on PTFE inserts in an incubator with 5% O2 for culture. (G) Total citrate labeling (1−(m+0)) from [U-13C]glucose in patients or tissue slices after 3 hours of labeling. All data represent mean ± standard deviation. Statistical significance was assessed using a one way analysis of variance (ANOVA) with a multiple comparison adjustment using Tukey’s methods (C), a nested t-test (D), or unpaired t-tests (E and G). *P < 0.05, **P < 0.01, ***P < 0.001, ****P<0.0001. Adj Kid = adjacent kidney, ccRCC = clear cell renal cell carcinoma, Pap = papillary renal cell carcinoma, Chromo = chromophone renal cell carcinoma, Onco = oncocytoma, FH def. RCC = FH deficient renal cell carcinoma. Fig 1A and 1F were created with biorender.com
Figure 2:
Figure 2:. TCA cycle metabolism downstream of PDH is suppressed in ccRCCs.
(A) Schematic of isotopologue labeling from [1,2-13C]acetate. (B) Total ion count (TIC)-normalized acetyl-CoA abundance after infusion with [U-13C]glucose (G) or [1,2-13C]acetate (A). (C) Enrichment of m+2 acetyl-CoA in the adjacent kidney versus ccRCC tumours. (D) m+2 isotopologues of TCA cycle intermediates from ccRCC patients infused with [1,2-13C]acetate. (E) Total labeling (1−(m+0)) of TCA cycle intermediates from ccRCC patients infused with [1,2-13C]acetate. (F) 13C labeling in the TCA cycle through two turns in the presence of [1,2-13C]acetyl-CoA. 13C from the first turn is in light red and 13C from the second turn is in dark red. (G) Citrate m+4/citrate m+2 ratios from the adjacent kidney and ccRCC tumours. (H) Citrate m+4/citrate m+2 and citrate m+2/pyruvate m+3 ratios from mitochondria isolated from the adjacent kidney or ccRCC tumours. (I) [4,5-13C]glutamate labeling as a fraction of total glutamate labeling after infusion with [1,2-13C]acetate. All data represent mean ± standard deviation, and whiskers of box and whisker plots represent minimum and maximum values. Statistical significance was assessed using unpaired two tailed parametric t-tests (B-E, G, H). ns P>0.05, *P < 0.05, **P < 0.01, ***P < 0.001, ****P<0.0001. Adj Kid = adjacent kidney, ccRCC = clear cell renal cell carcinoma.
Figure 3:
Figure 3:. Glutamine contributes to the TCA cycle in ccRCC.
(A) Schematic of isotopologue labeling from [U-13C]glutamine. Labeling from oxidative metabolism is indicated in grey and labeling from reductive metabolism is in red. (B) Isotopologues of TCA cycle intermediates from metabolism of [U-13C]glutamine through the first oxidative TCA cycle turn. (C) Total labeling (1−(m+0)) of TCA cycle intermediates from ccRCC patients infused with [U-13C]glutamine. (D) Fractional enrichment of m+5 citrate in the adjacent kidney and ccRCC tumours (E) Fractional enrichment of m+3 malate in the adjacent kidney and ccRCC tumours. Whiskers of box and whisker plots represent minimum and maximum values. Statistical significance was assessed using unpaired two tailed parametric t-tests (B-E). ns P>0.05, *P < 0.05, **P < 0.01, ***P < 0.001, ****P<0.0001. Adj Kid = adjacent kidney, ccRCC = clear cell renal cell carcinoma. Gln = glutamine, Glu = glutamate, Suc = succinate, Fum = fumarate, Mal = malate, Cit = citrate.
Figure 4:
Figure 4:. Respiration of mitochondria from primary human kidney cancers.
(A) State III ADP-stimulated oxygen consumption rates (OCR) from mitochondria isolated from primary human tissues. Substrates used to stimulate respiration are indicated. (B) OCR from ccRCC mitochondria normalized to the patient matched adjacent kidney. Substrates used to stimulate respiration are indicated. Panels A and B represent mean ± 95% confidence intervals. Statistical significance was assessed using a one way analysis of variance (ANOVA) with a multiple comparison adjustment using Tukey’s methods (A) or unpaired two tailed parametric t-tests (B). ns P>0.05, *P < 0.05, **P < 0.01, ***P < 0.001, ****P<0.0001. Asc, ascorbate; TMPD = N,N,N,N-tetramethyl-p-phenylenediamine.
Figure 5:
Figure 5:. Metastatic ccRCCs utilize glucose differently than primary ccRCCs.
(A) Citrate m+2/pyruvate m+3 ratio from patients infused with [U-13C]glucose. ccRCC metastases to different organ sites are indicated in dark red. (B) Citrate m+2/pyruvate m+3 ratio from two patients infused with [U-13C]glucose who had a primary ccRCC and synchronous metastasis to the adrenal gland removed during the same infusion. (C) Total citrate labeling (i.e 1−(m+0)) from patients infused with [1,2-13C]acetate. (D) OCR from 786-O control cells and 786-O cells expressing NDI1. (E) Total citrate labeling (i.e. 1−(m+0)) from cells cultured with [U-13C]glucose for 6 hours in RPMI with 5% dialyzed FBS. Labelling from non-small cell lung cancer (NSCLC) cell lines was previously published. (F) Representative mice 4 weeks after tail vein injection of control and NDI1-expressing 786-O cells. Bioluminescence is quantified on the right. All data represent mean ± standard deviation. Statistical significance was assessed using unpaired two tailed parametric t-tests. Adr, adrenal gland; LN, lymph node. ns P>0.05, *P < 0.05, **P < 0.01, ***P < 0.001, ****P<0.0001.

References

    1. Courtney K. D. et al. Isotope tracing of human clear cell renal cell carcinomas demonstrates suppressed glucose oxidation in vivo. Cell Metab. 28, 793–800.e2 (2018). - PMC - PubMed
    1. Davis C. F. et al. The somatic genomic landscape of chromophobe renal cell carcinoma. Cancer Cell 26, 319–330 (2014). - PMC - PubMed
    1. Ricketts C. J. et al. The Cancer Genome Atlas Comprehensive Molecular Characterization of Renal Cell Carcinoma. Cell Rep. 23, 313–326.e5 (2018). - PMC - PubMed
    1. Linehan W. M. et al. Comprehensive Molecular Characterization of Papillary Renal-Cell Carcinoma. N. Engl. J. Med. 374, 135–145 (2016). - PMC - PubMed
    1. Ivan M. et al. HIFalpha targeted for VHL-mediated destruction by proline hydroxylation: implications for O2 sensing. Science 292, 464–468 (2001). - PubMed

Publication types