

This is a preprint.
Multivariate adaptive shrinkage improves cross-population transcriptome prediction for transcriptome-wide association studies in underrepresented populations
- PMID: 36798214
- PMCID: PMC9934635
- DOI: 10.1101/2023.02.09.527747
Multivariate adaptive shrinkage improves cross-population transcriptome prediction for transcriptome-wide association studies in underrepresented populations
Update in
- This article has been published with doi: 10.1016/j.xhgg.2023.100216
Abstract
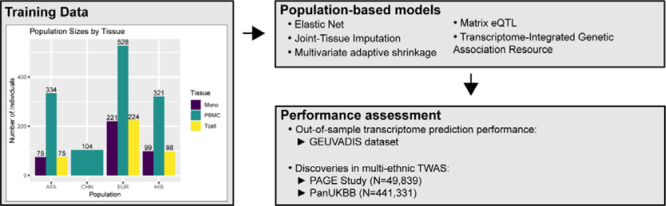
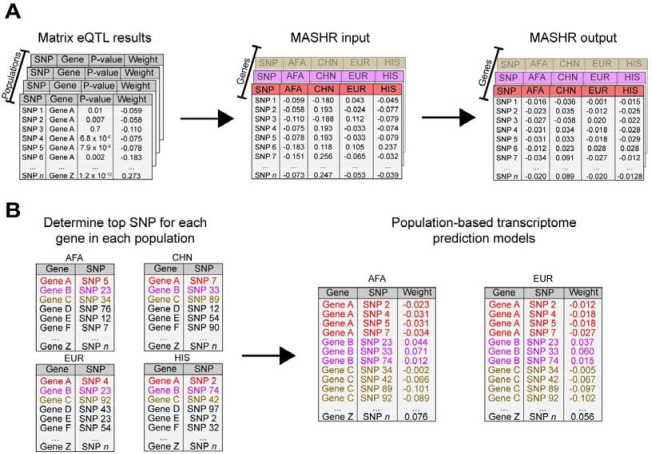
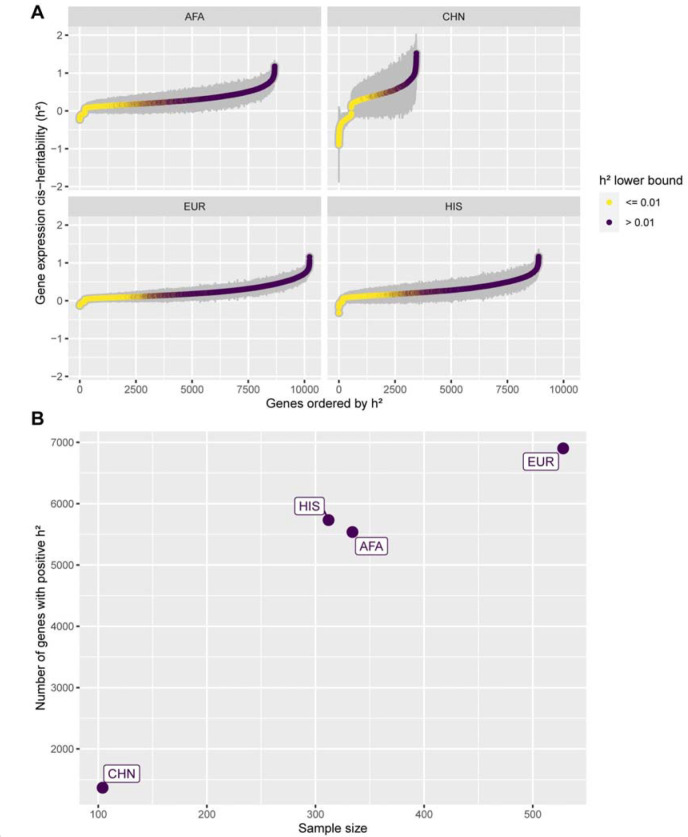
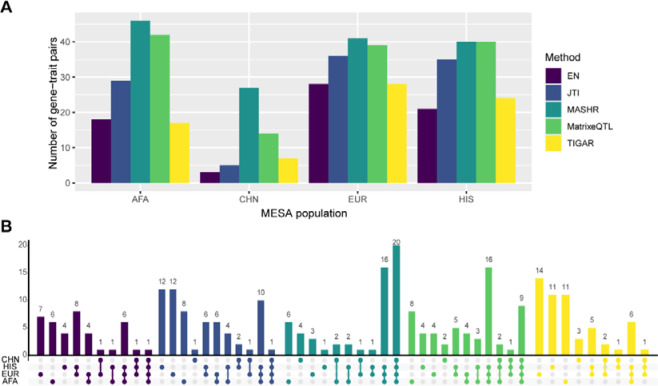
Transcriptome prediction models built with data from European-descent individuals are less accurate when applied to different populations because of differences in linkage disequilibrium patterns and allele frequencies. We hypothesized methods that leverage shared regulatory effects across different conditions, in this case, across different populations may improve cross-population transcriptome prediction. To test this hypothesis, we made transcriptome prediction models for use in transcriptome-wide association studies (TWAS) using different methods (Elastic Net, Joint-Tissue Imputation (JTI), Matrix eQTL, Multivariate Adaptive Shrinkage in R (MASHR), and Transcriptome-Integrated Genetic Association Resource (TIGAR)) and tested their out-of-sample transcriptome prediction accuracy in population-matched and cross-population scenarios. Additionally, to evaluate model applicability in TWAS, we integrated publicly available multi-ethnic genome-wide association study (GWAS) summary statistics from the Population Architecture using Genomics and Epidemiology Study (PAGE) and Pan-UK Biobank with our developed transcriptome prediction models. In regard to transcriptome prediction accuracy, MASHR models performed better or the same as other methods in both population-matched and cross-population transcriptome predictions. Furthermore, in multi-ethnic TWAS, MASHR models yielded more discoveries that replicate in both PAGE and PanUKBB across all methods analyzed, including loci previously mapped in GWAS and new loci previously not found in GWAS. Overall, our study demonstrates the importance of using methods that benefit from different populations' effect size estimates in order to improve TWAS for multi-ethnic or underrepresented populations.
Keywords: genetics; genomics; human genetics; transcriptome-wide association studies.
Conflict of interest statement
7.DECLARATION OF INTERESTS All authors declare that they have no conflicts of interest.
Figures

References
-
- Buniello A., MacArthur J.A.L., Cerezo M., Harris L.W., Hayhurst J., Malangone C., McMahon A., Morales J., Mountjoy E., Sollis E., et al. (2019). The NHGRI-EBI GWAS Catalog of published genome-wide association studies, targeted arrays and summary statistics 2019. Nucleic Acids Research 47, D1005–D1012. 10.1093/nar/gky1120. - DOI - PMC - PubMed
-
- Morales J., Welter D., Bowler E.H., Cerezo M., Harris L.W., McMahon A.C., Hall P., Junkins H.A., Milano A., Hastings E., et al. (2018). A standardized framework for representation of ancestry data in genomics studies, with application to the NHGRI-EBI GWAS Catalog. Genome Biol 19, 21. 10.1186/s13059-018-1396-2. - DOI - PMC - PubMed
Publication types
Grants and funding
- R01 HL105756/HL/NHLBI NIH HHS/United States
- P30 DK063491/DK/NIDDK NIH HHS/United States
- R15 HG009569/HG/NHGRI NIH HHS/United States
- UL1 TR000040/TR/NCATS NIH HHS/United States
- N01 HC095166/HL/NHLBI NIH HHS/United States
- N01 HC095160/HL/NHLBI NIH HHS/United States
- 75N92020D00002/HL/NHLBI NIH HHS/United States
- HHSN268201500003C/HL/NHLBI NIH HHS/United States
- N01 HC095161/HL/NHLBI NIH HHS/United States
- 75N92020D00005/HL/NHLBI NIH HHS/United States
- N01 HC095168/HL/NHLBI NIH HHS/United States
- R01 HL120393/HL/NHLBI NIH HHS/United States
- U54 HG003067/HG/NHGRI NIH HHS/United States
- R01 HL135009/HL/NHLBI NIH HHS/United States
- UL1 TR001079/TR/NCATS NIH HHS/United States
- N01 HC095169/HL/NHLBI NIH HHS/United States
- R01 DK101921/DK/NIDDK NIH HHS/United States
- 75N92020D00001/HL/NHLBI NIH HHS/United States
- R01 HL101250/HL/NHLBI NIH HHS/United States
- N01 HC095167/HL/NHLBI NIH HHS/United States
- N01 HC095159/HL/NHLBI NIH HHS/United States
- 75N92020D00003/HL/NHLBI NIH HHS/United States
- UL1 TR001420/TR/NCATS NIH HHS/United States
- 75N92020D00004/HL/NHLBI NIH HHS/United States
- N01 HC095163/HL/NHLBI NIH HHS/United States
- 75N92020D00007/HL/NHLBI NIH HHS/United States
- HHSN268201500003I/HL/NHLBI NIH HHS/United States
- RF1 AG054474/AG/NIA NIH HHS/United States
- R01 HL126477/HL/NHLBI NIH HHS/United States
- 75N92020D00006/HL/NHLBI NIH HHS/United States
- R01 HL117626/HL/NHLBI NIH HHS/United States
- N01 HC095162/HL/NHLBI NIH HHS/United States
- UL1 TR001881/TR/NCATS NIH HHS/United States
- N01 HC095165/HL/NHLBI NIH HHS/United States
- N01 HC095164/HL/NHLBI NIH HHS/United States
LinkOut - more resources
Full Text Sources