[Preprint]. 2023 Feb 8:2023.02.06.23285545.
doi: 10.1101/2023.02.06.23285545.

MS4A4A modifies the risk of Alzheimer disease by regulating lipid metabolism and immune response in a unique microglia state

Affiliations

MS4A4A modifies the risk of Alzheimer disease by regulating lipid metabolism and immune response in a unique microglia state

Shih-Feng You et al. medRxiv. .

Abstract

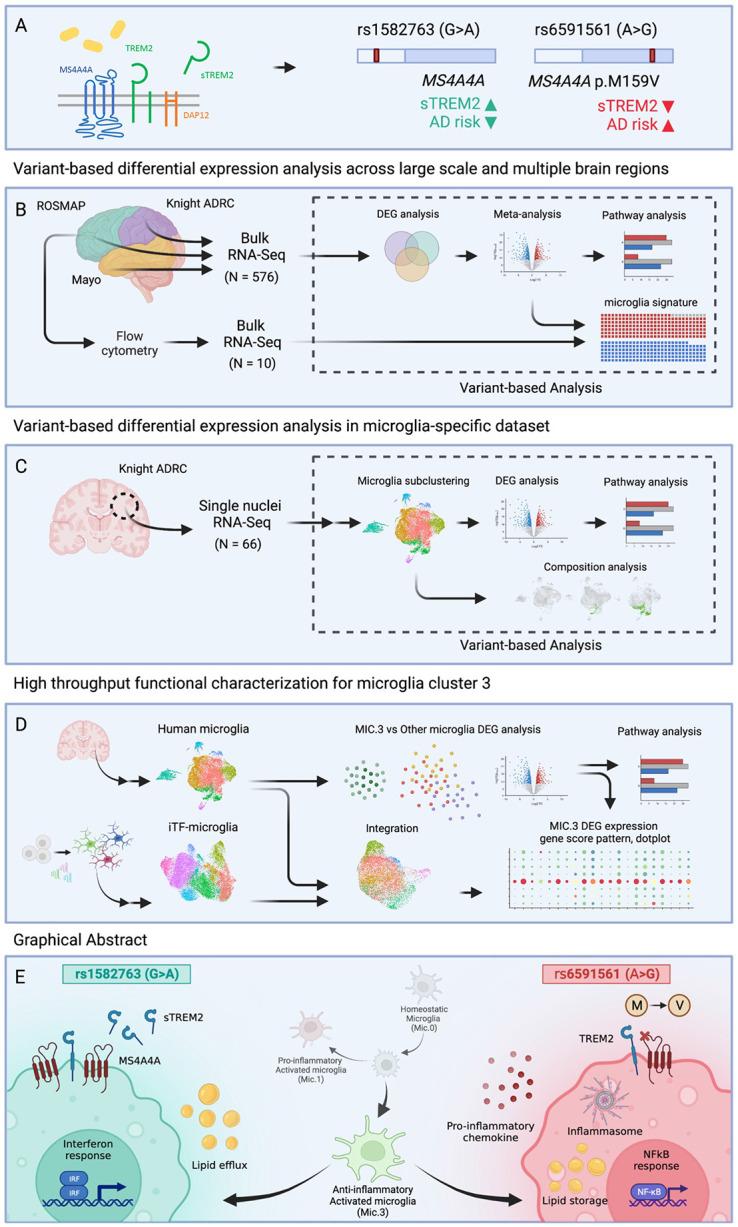
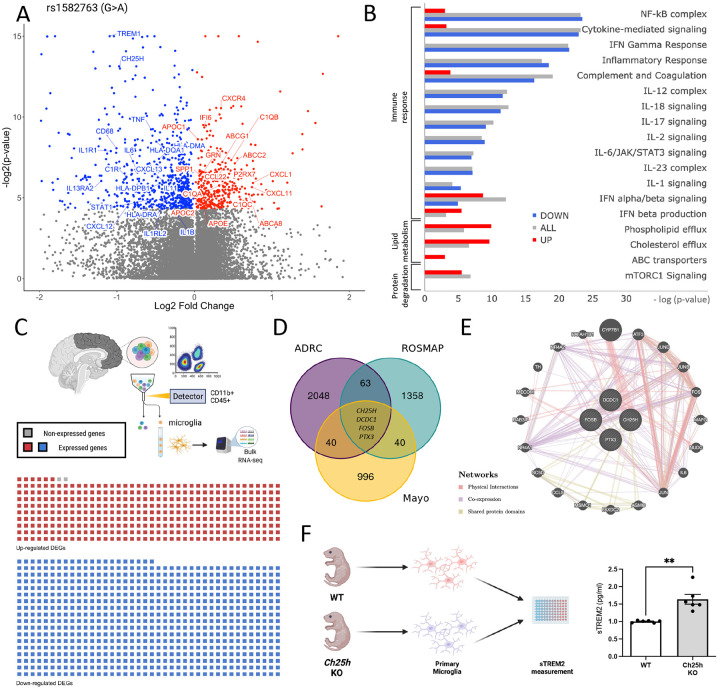
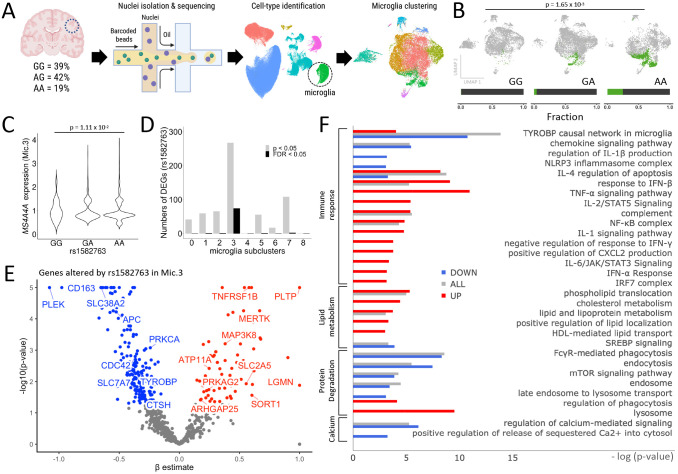
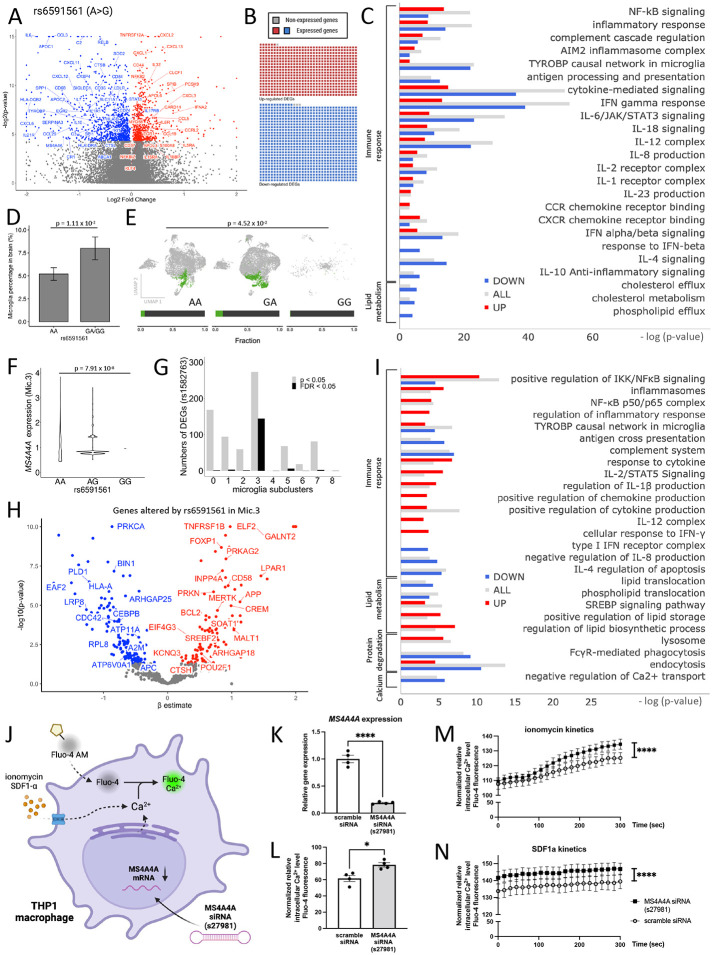
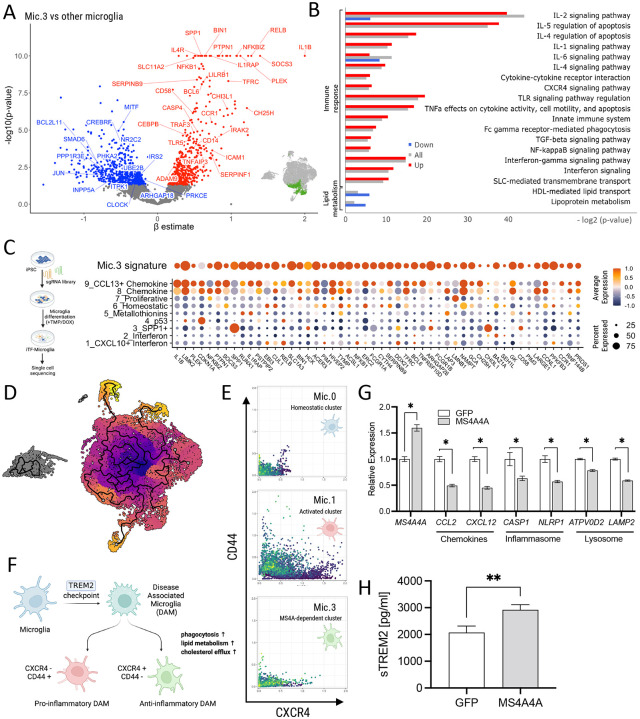
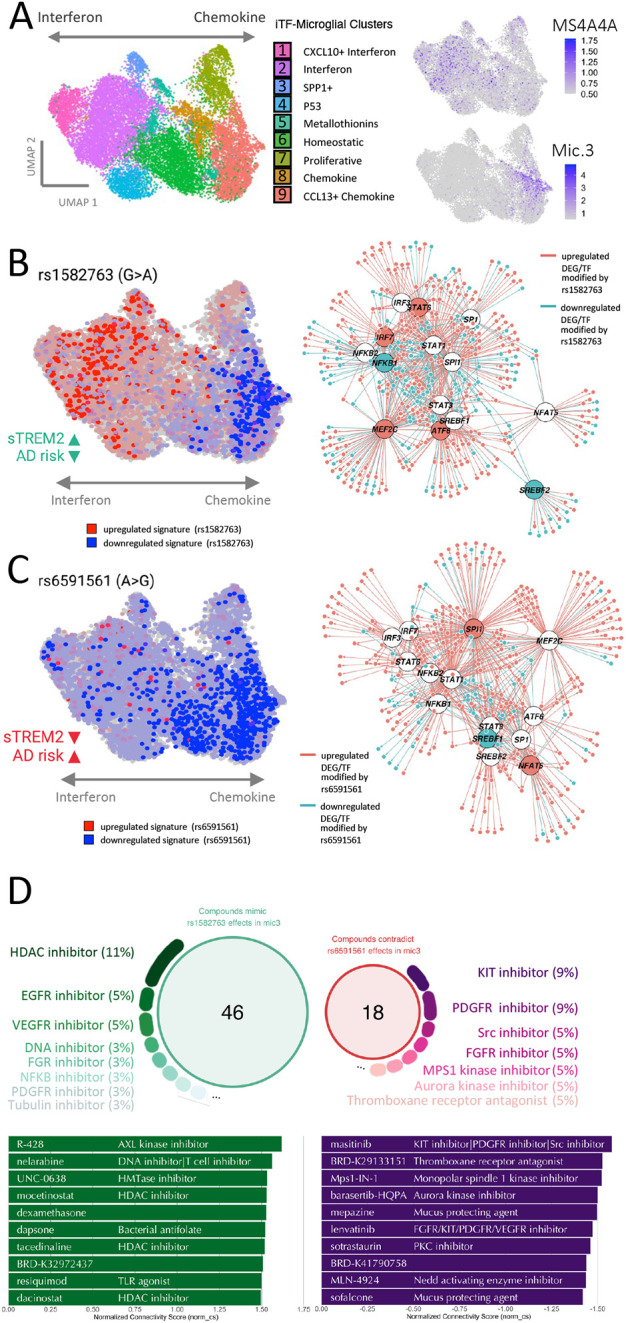
Genome-wide association studies (GWAS) have identified many modifiers of Alzheimer disease (AD) risk enriched in microglia. Two of these modifiers are common variants in the MS4A locus (rs1582763: protective and rs6591561: risk) and serve as major regulators of CSF sTREM2 levels. To understand their functional impact on AD, we used single nucleus transcriptomics to profile brains from carriers of these variants. We discovered a "chemokine" microglial subpopulation that is altered in MS4A variant carriers and for which MS4A4A is the major regulator. The protective variant increases MS4A4A expression and shifts the chemokine microglia subpopulation to an interferon state, while the risk variant suppresses MS4A4A expression and reduces this subpopulation of microglia. Our findings provide a mechanistic explanation for the AD variants in the MS4A locus. Further, they pave the way for future mechanistic studies of AD variants and potential therapeutic strategies for enhancing microglia resilience in AD pathogenesis.


Figures

Figure 1.
Figure 1.. Study overview.
A. MS4A4A and TREM2 reside on the plasma membrane in microglia. Prior work demonstrates that rs1582763 is associated with elevated CSF sTREM2 and reduced AD risk (termed: protective) and rs6591561 is associated with reduced CSF sTREM2 and increased AD risk (termed: risk) B. Trans-eQTL analyses for rs1582763 and rs6591561 were performed using data derived from tissue samples representing three cortical areas in three independent cohorts (ROSMAP, frontal; Knight ADRC, parietal; Mayo, temporal). C. Trans-eQTL analyses were performed in human microglia clusters from single nuclei RNA-seq. D. Functional genomics were applied to define the impact of rs1582763 and rs6591561 on microglia function using iTF-microglia. E. Summary of major findings.
Figure 2.
Figure 2.. Brain transcriptomics reveals that the AD protective variant rs1582763 reduces the inflammatory response and increases lipid metabolism pathways.
A. Meta-analysis of the impact of rs1582763 on gene expression in 3 independent brain cohorts. Volcano plot of genes that are differentially expressed in the presence of rs1582763. B. Pathway analysis reveals genes enriched in pathways related to immune signaling and lipid metabolism. Red, up-regulated genes. Blue, down-regulated genes. Gray, all differentially expressed genes. C. Sorted brain microglia (ROSMAP; n=10 brains) were queried to determine whether identified DEGs were enriched in microglia. The waffle plot illustrates the number of genes present in FACS-isolated microglia. Red, up-regulated genes. Blue, down-regulated genes. Gray, absent in the microglia dataset. D. Venn diagram shows the number of differentially expressed genes within three independent cohort (FDR < 0.05). Covariates include age, sex and disease status. E. Gene network diagram reveals the relatedness of CH25H, DCDC1, FOSB, and PTX3. Network: Red, physical interaction. Purple, co-expression. Olive, shared protein domain. F. Schematic of primary microglia culture from WT and Ch25h KO mice. Primary mouse microglia from Ch25h KO mice display significantly higher sTrem2 levels in the media detected by ELISA (p = 1.0 x 10⁻³).
Figure 3.
Figure 3.. Single nucleus RNA-seq in human brains reveals that the AD protective variant rs1582763 alters a specific microglia population and drives the expression of genes associated with chemokine and lipid metabolism pathways.
A. Schematic of single nucleus brain RNA-seq. B. UMAP reveals a significant increase in the proportion of a specific population of microglia (Mic.3) in the presence of the rs1582763 minor allele (A) (The fraction below indicates the proportion of Mic.3 in the total microglia of given genotype carriers). C. MS4A4A expression is significantly elevated in Mic.3 in the presence of the minor allele of rs1582763 (Kruskal-Wallis test, p = 1.11 x 10⁻²). D. Bar graph of the number of genes differentially expressed as a function of the rs1582763 genotype across microglia subclusters reveals that differentially expressed genes are enriched in Mic.3. Grey, p<0.05. Black, FDR<0.05. E. Volcano plot of genes differentially expressed based on rs1582763 genotype in Mic.3. F. Pathway analysis reveals that rs1582763 alters genes within Mic.3 that influence immune response, lipid metabolism, protein degradation and calcium regulation.
Figure 4.
Figure 4.. The AD risk variant rs6591561 is associated with upregulation of inflammasome and inflammatory cytokines and reduced lipid metabolism.
A. Meta-analysis of the impact of rs6591561 on gene expression in three independent brain cohorts. Volcano plot of genes that are differentially expressed in the presence of rs6591561. B. Sorted brain microglia (ROSMAP; n=10 brains) were queried to determine whether genes identified in (A) were enriched in microglia. The waffle plot illustrates the number of genes present in sorted microglia. Red, up-regulated genes. Blue, down-regulated genes. Gray, absent in the microglia dataset. C. Pathway analysis of genes from (A) reveals genes enriched in pathways related to immune signaling and lipid metabolism. Red, up-regulated genes. Blue, down-regulated genes. Gray, all differentially expressed genes. D. Single nucleus RNA-seq reveals that rs6591561 is associated with an increased microglia proportion (LR, p = 1.11 x 10⁻²). E. UMAP reveals a significant increase in the proportion of a specific microglia population of microglia (Mic.3) in the presence of the minor allele of rs6591561 (LR, p = 4.52 x 10⁻²). F. MS4A4A expression is reduced in minor allele carriers of rs6591561 in Mic.3 (ANOVA, p = 7.91 x 10⁻⁸). G. Bar graph of the number of genes differentially expressed as a function of the rs6591561 genotype across microglia subpopulations reveals that differentially expressed genes are enriched in Mic.3. Gray, p<0.05. Black, FDR<0.05. H. Volcano plot reveals genes differentially expressed based on the rs6591561 genotype in Mic.3. I. Pathway analysis reveals that rs6591561 alters genes involved in elevated inflammasome, inflammatory cytokines, enhanced lipid storage, and decreased lipid metabolism in Mic.3. J. Schematic representation of Fluo-4 calcium assay on THP-1 macrophage treated with MS4A4A siRNA (s27981). K. qPCR reveals MS4A4A is significantly reduced in the presence of MS4A4A siRNA. L. Baseline intracellular Ca2+ levels are elevated after treatment with MS4A4A siRNA s27981. M. Intracellular Ca2+ kinetics after treated with SDF1α. N. Intracellular Ca2+ kinetics after treated with ionomycin ****, p<0.0001.
Figure 5.
Figure 5.. Variants in the MS4A locus shift microglia identity.
A. A volcano plot illustrates differentially expressed genes between Mic.3 and all microglia subclusters. The inset graphic shows the reference location of Mic.3. B. Pathway analysis reveals enrichment of genes associated with chemokines, immune/inflammatory response and lipid metabolism. Red, upregulated DEGs. Blue, downregulated DEGs. Gray, all differentially expressed genes. C. (Left) A graphic illustration shows CROP-seq from iTF-microglia. (Right) A dot plot shows the expression level of the top 50 Mic.3 differentially expressed genes in Knight ADRC brain microglia and iTF-microglia. Average expression indicated by color scale. Percent expressed illustrated by the size of the circle. D. An UMAP diagram shows homeostatic (Mic.0), activated (Mic.1) and MS4A4A-dependent (Mic.3) microglia clusters trajectory by Monocle 3. E. Scatterplots show imputed relative expression of CXCR4 (anti-inflammatory)/CD44 (pro-inflammatory) in homeostatic (Mic.0), activated (Mic.1), and MS4A4A-dependent (Mic.3) microglia cluster generated by MAGIC. F. A hypothesis proposes that disease-associated microglia (DAM) differentiate into the pro-inflammatory DAM and the anti-inflammatory DAM. G-H. Peripheral blood mononuclear cell (PBMC) derived macrophages were transduced with lentivirus particles carrying GFP or MS4A4A WT. G. RNA expression levels of MS4A4A, chemokine, inflammasome, and lysosomal genes were plotted. H. sTREM2 levels in media from GFP or MS4A4A-encoding lentiviral transduced macrophages. *, p < 0.05; **, p < 0.001.
Figure 6.
Figure 6.. The AD protective and risk variants in the MS4A locus alters the microglial state transcriptionally and functionally.
A. Left, schematic of CROP-seq from iTF-microglia. Right, MS4A4A expression is enriched in the iTF-microglia cluster associated with interferon function (top). Right, genes differentially expressed in Mic.3 compared to all microglia subclusters are enriched in iTF-microglia chemokine clusters (bottom). B. Molecular signature of the protective variant is enriched in interferon iTF-microglia (left) and alters transcription factor networks (right). C. Risk variant signature is dampened across interferon and chemokine iTF-microglia (left) and alters transcription factor networks (right). D. Compounds that mimic the molecular signature of the protective and reverse risk variant effects in Mic.3 are shown along with the target percentage and top 10 compounds.

References

    1. Novikova G. et al. Integration of Alzheimer's disease genetics and myeloid genomics identifies disease risk regulatory elements and genes. Nat Commun 12, 1610 (2021). - PMC - PubMed
    1. Wightman D.P., et al. A genome-wide association study with 1,126,563 individuals identifies new risk loci for Alzheimer's disease. Nat Genet 53, 1276–1282 (2021). - PMC - PubMed
    1. Bellenguez C., et al. New insights into the genetic etiology of Alzheimer's disease and related dementias. Nat Genet 54, 412–436 (2022). - PMC - PubMed
    1. Kunkle B.W., et al. Genetic meta-analysis of diagnosed Alzheimer's disease identifies new risk loci and implicates Abeta, tau, immunity and lipid processing. Nat Genet 51, 414–430 (2019). - PMC - PubMed
    1. Nott A. et al. Brain cell type-specific enhancer-promoter interactome maps and disease-risk association. Science 366, 1134–1139 (2019). - PMC - PubMed

Publication types