[Preprint]. 2024 Sep 25:2023.02.07.527509.
doi: 10.1101/2023.02.07.527509.

HiExM: high-throughput expansion microscopy enables scalable super-resolution imaging

Affiliations

HiExM: high-throughput expansion microscopy enables scalable super-resolution imaging

John H Day et al. bioRxiv. .

Update in

Abstract

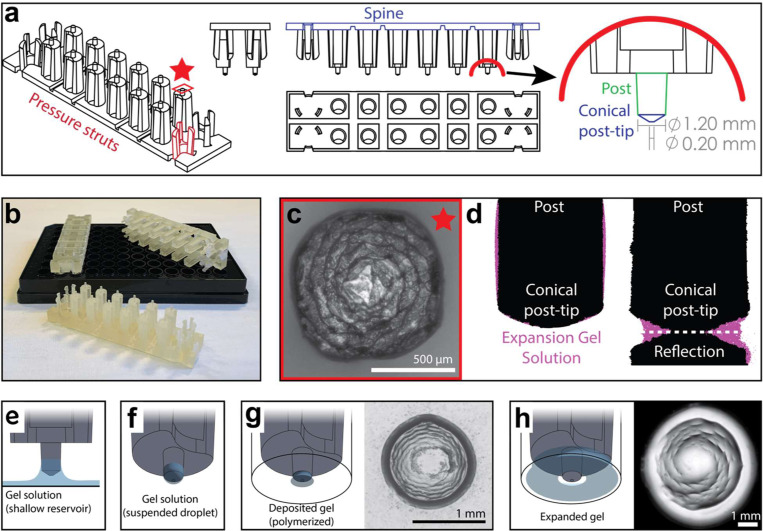
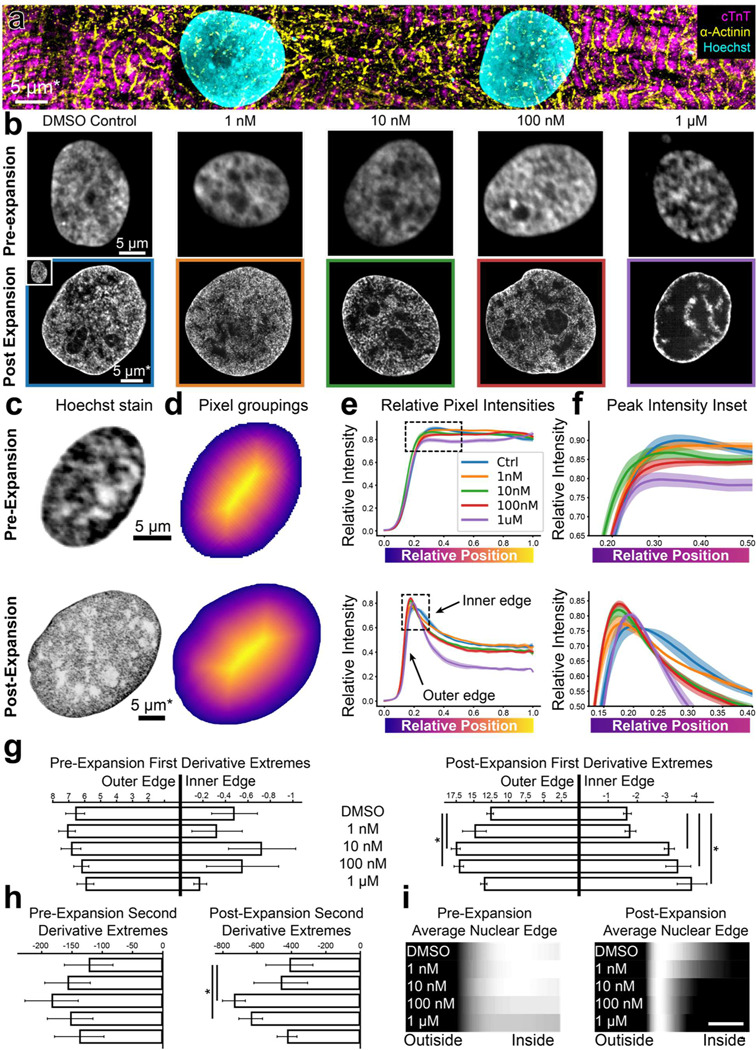
Expansion microscopy (ExM) enables nanoscale imaging using a standard confocal microscope through the physical, isotropic expansion of fixed immunolabeled specimens. ExM is widely employed to image proteins, nucleic acids, and lipid membranes in single cells; however, current methods limit the number of samples that can be processed simultaneously. We developed High-throughput Expansion Microscopy (HiExM), a robust platform that enables expansion microscopy of cells cultured in a standard 96-well plate. Our method enables ~4.2x expansion of cells within individual wells, across multiple wells, and between plates. We also demonstrate that HiExM can be combined with high-throughput confocal imaging platforms to greatly improve the ease and scalability of image acquisition. As an example, we analyzed the effects of doxorubicin, a known cardiotoxic agent, on human cardiomyocytes (CMs) as measured by Hoechst signal across the nucleus. We show a dose dependent effect on nuclear DNA that is not observed in unexpanded CMs, suggesting that HiExM improves the detection of cellular phenotypes in response to drug treatment. Our method broadens the application of ExM as a tool for scalable super-resolution imaging in biological research applications.

Keywords: expansion microscopy; high-throughput; nanoscopy; super-resolution imaging.


Figures

Fig. 1.
Fig. 1.. HiExM enables gel formation and expansion in a 96-well cell culture plate.
a. Schematic representation of HiExM devices showing the key features highlighted in color. b. Example devices used in 96-well cell culture plates. c. Brightfield image of the conical post-tip shows the pattern of grooves that mediate fluid retention. d. Fluid retention at the conical post-tip of the device. Silhouettes taken by an optical comparator of the profile of a single post suspended above a surface (left) and in contact with a surface (right) show a fluid droplet interacting with the device. Upon device insertion, the gel solution fills the space under the conical post tip, forming the toroid gel. e-h. Schematic of HiExM gel deposition and expansion workflow. e. The device is immersed in a shallow reservoir of gel solution. f. Upon removal, the tip of each device post retains a small volume of gel solution. g. Gel solution is deposited by the device into the well centers of the cell culture plate. Brightfield image (right) shows gel geometry and size prior to expansion. Note that gels deposited in HiExM cover ~1.1 mm2 of the well surface to accommodate the expanded gel, and do not include cells outside the gel footprint. h. Polymerization and expansion are performed with the device in place. Brightfield image (right) shows gel geometry and size after expansion.
Fig. 2.
Fig. 2.. HiExM is compatible with nanoscale expansion and automated image acquisition of human cells with minimal distortion.
a. Expanded gels in a 96 well plate imaged at 5x with an inset showing an individual gel shown on the right. b. Imaging fields shown for pre-expansion and post-expansion samples. Prior to expansion, 61 fields were imaged at 63x around the center of the gel. After expansion, 12 fields were imaged at 20x magnification. Max projections for each field were then stitched together and manually inspected to identify fields in the pre-expansion and post-expansion image sets containing matching cells. Arrows show an example of a field representing the same cells before and after expansion. c. Representative registered fluorescence image of microtubules before (left) and after (right) expansion showing the increase in resolution conferred by expansion. In this case, both pre-expansion and post-expansion images were taken at 63x magnification. d. Representative error curve calculated using non-rigid registration of 43 independent fields of view. The shaded region denotes one standard error of the mean. e. Error is not dependent on the location of a given field of view within the gel. Each data point represents the average percent error (up to 40 μm measurement length post-expansion) for a given field of view as determined by an NRR analysis. Seven to ten fields of view were analyzed across six wells. The distance from the center of each field of view to the center of the well was measured manually in FIJI using the stitched pre-expansion image set. f. Box plots showing the distribution of average error among gels across three plates (average = 3.63% +/− 1.39). Average error percentages for each well plate: 3.73 +/− 0.879, 3.89 +/− 1.65, and 3.43 +/− 1.44. g. Expansion factor is not dependent on the location of a given field of view within the gel. Images taken before and after expansion of the same cell or group of cells were used to measure the ratio of length scales in the two images. h. Box plots showing the distribution of expansion factors of 58 gels across three plates. Expansion factors ranged from 3.5–5.1x across gels with an average of 4.16 +/− 0.394. Average expansion factors for each well plate showed tight distribution with some variability across plates: 3.78 +/− 0.171, 4.26 +/− 0.171, and 4.53 +/− 0.321. Comparison of the three well plates was performed using one-way ANOVA and post-hoc Tukey HSD test (*p-value<<0.05).
Fig. 3.
Fig. 3.. HiExM shows altered nuclear morphology of cardiomyocytes treated with low doses of doxorubicin.
a. hiPSC-CMs imaged post-expansion in HiExM. b. Example images of hiPSC-CM nuclei after dox treatment for 24 hrs before (top) and after (bottom) expansion. c. Example images of hiPSC-CM nuclei taken before (top) and after (bottom) expansion. d. Heatmaps of nuclei in c showing pixel groupings for subsequent analysis. Heatmaps were generated from the image mask after dilation, such that the outer edge represents a contour just beyond the nuclear periphery. e. Relative Hoechst intensity plotted as a function of pixel position relative to the edge of the dilated mask in pre- (top) and post- (bottom) expansion nuclei. Colored curves represent dox concentrations or DMSO (ctrl). Shaded regions represent SEM for n = 56, 71, 64, 92, and 62 nuclei in the pre-expansion images and n = 4 replicates in the expanded case (118, 111, 110, 113, and 77 nuclei analyzed for DMSO control, 1 nM, 10 nM, 100 nM, and 1 μM Dox, respectively). f. Insets of plots in e highlighting the nuclear periphery. g. Rate-of-change analysis of curves for pre- (left) and post- (right) expansion images. Outer edge values were obtained by determining the maximum values of the derivatives for each condition, and inner edge values were obtained by determining the minimum values of the derivatives within the domain 0 – 0.4. h. Curvature analysis for pre- (left) and post- (right) expansion data. Values represent the minima of the second derivative for curves within the domain 0 – 0.4. i. Average Hoechst intensities plotted as gradients for each dox concentration. Scale bar represents 10 percent distance from the edge of the nucleus to the center. Error bars represent SEM as in e. * denotes significance from an independent two-sample t-test (p < 0.05). *Scale bar represents biological scale assuming 4x expansion.

References

    1. Gustafsson M. G. L. Surpassing the lateral resolution limit by a factor of two using structured illumination microscopy: SHORT COMMUNICATION. J. Microsc. 198, 82–87 (2000). - PubMed
    1. Hell S. W. & Wichmann J. Breaking the diffraction resolution limit by stimulated emission: stimulated-emission-depletion fluorescence microscopy. Opt. Lett. 19, 780 (1994). - PubMed
    1. Rust M. J., Bates M. & Zhuang X. Sub-diffraction-limit imaging by stochastic optical reconstruction microscopy (STORM). Nat. Methods 3, 793–796 (2006). - PMC - PubMed
    1. Chen F., Tillberg P. W. & Boyden E. S. Expansion microscopy. Science 347, 543 (2015). - PMC - PubMed
    1. Holden S. J. et al. High throughput 3D super-resolution microscopy reveals Caulobacter crescentus in vivo Z-ring organization. Proc. Natl. Acad. Sci. 111, 4566–4571 (2014). - PMC - PubMed

Publication types