[Preprint]. 2023 Feb 10:2023.02.09.527751.
doi: 10.1101/2023.02.09.527751.

CPA-Perturb-seq: Multiplexed single-cell characterization of alternative polyadenylation regulators

Affiliations

CPA-Perturb-seq: Multiplexed single-cell characterization of alternative polyadenylation regulators

Madeline H Kowalski et al. bioRxiv. .

Update in

Abstract

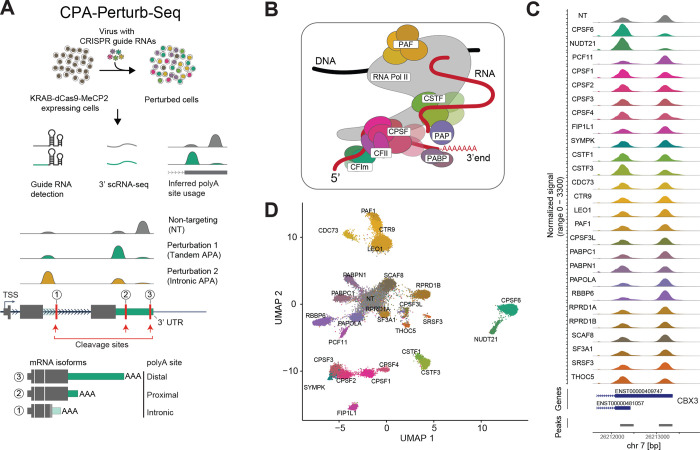
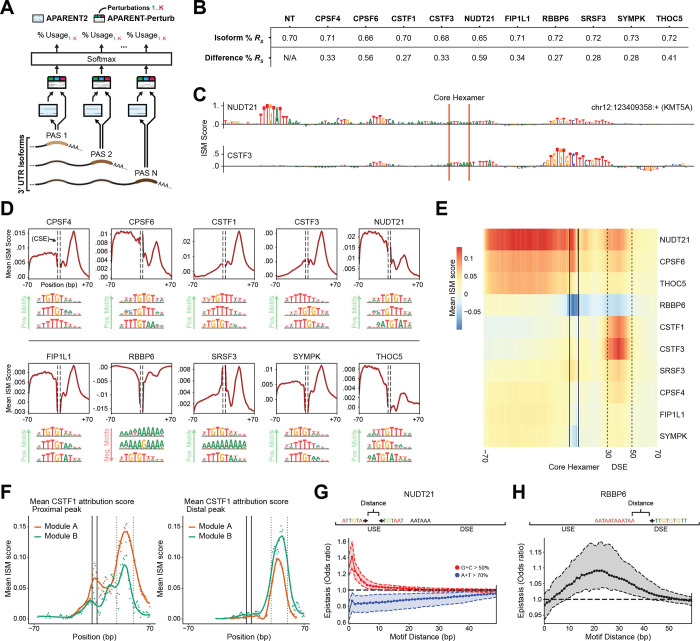
Most mammalian genes have multiple polyA sites, representing a substantial source of transcript diversity that is governed by the cleavage and polyadenylation (CPA) regulatory machinery. To better understand how these proteins govern polyA site choice we introduce CPA-Perturb-seq, a multiplexed perturbation screen dataset of 42 known CPA regulators with a 3' scRNA-seq readout that enables transcriptome-wide inference of polyA site usage. We develop a statistical framework to specifically identify perturbation-dependent changes in intronic and tandem polyadenylation, and discover modules of co-regulated polyA sites exhibiting distinct functional properties. By training a multi-task deep neural network (APARENT-Perturb) on our dataset, we delineate a cis-regulatory code that predicts responsiveness to perturbation and reveals interactions between distinct regulatory complexes. Finally, we leverage our framework to re-analyze published scRNA-seq datasets, identifying new regulators that affect the relative abundance of alternatively polyadenylated transcripts, and characterizing extensive cellular heterogeneity in 3' UTR length amongst antibody-producing cells. Our work highlights the potential for multiplexed single-cell perturbation screens to further our understanding of post-transcriptional regulation in vitro and in vivo.


Conflict of interest statement

COMPETING INTERESTS In the past three years, R.S. has worked as a consultant for Bristol-Myers Squibb, Regeneron, and Kallyope and served as an SAB member for ImmunAI, Resolve Biosciences, Nanostring, and the NYC Pandemic Response Lab. A.K. is on the SAB of PatchBio Inc., SerImmune Inc., AINovo Inc., TensorBio Inc., and OpenTargets; was a consultant with Illumina Inc. until Jan 2023; and owns shares in DeepGenomics Inc., Immunai Inc. and Freenome Inc. J.L. is an employee of Calico Life Sciences LLC as of 11/21/2022.

Figures

Figure 1:
Figure 1:. Overview of CPA-Perturb-Seq.
(A) (Top) Schematic of the experimental workflow used to generate the CPA-Perturb-seq dataset. (Bottom) Schematic of perturbation-dependent changes in either tandem or intronic polyadenylation. (B) Diagram depicting core regulatory complexes that make up and interact with the cleavage and polyadenylation machinery. (C) Read coverage plots depicting the differential use of alternative polyA sites at the CBX3 locus. Each track represents a pseudobulk average of cells, grouped by their perturbation. ENSEMBL gene models and peaks (quantification region) that precede detected polyA sites are shown below. (D) UMAP visualization of HEK293FT cells profiled via CPA-Perturb-Seq. Cells are colored based on the target gene identity. Visualization was computed based on a linear discriminant analysis (LDA) of transcriptome-wide polyA site counts.
Figure 2:
Figure 2:. PolyA-residuals quantify alternative polyadenylation at single-cell resolution.
(A) Average usage of 5,335 proximal polyA sites in NT cells (x-axis) and CSTF3-perturbed cells (y-axis). Only genes with at least two tandem polyA sites are considered. Changes across conditions can breflect eithevr changes in relative polyA site usage, total gene expression, or both. (B-D): Read coverage plots at three loci highlighted in (A). Blue box denotes proximal polyA site. (E) Schematic depicting the procedure to calculate polyA-residuals (full description in Supplementary Methods). (F-H) Violin plots depicting single-cell gene expression levels (left) or single-cell polyA-residuals for the proximal polyA site for NT and CSTF3-perturbed cells. NS (not significant) for RNA comparisons indicate absolute log2FC <0.25 or Bonferonni adjusted p-value >0.05 using Wilcoxon rank-sum test. NS for polyA residual comparisons indicates percent change <0.05 or adjusted p-value >0.05 in differential polyadenylation analysis described in Supplementary Methods.
Figure 3:
Figure 3:. Characterizing tandem and intronic alternative polyadenylation in CPA-Perturb-Seq
(A) Number of genes with significant changes in RNA abundance, relative usage of at least one polyA site, after perturbation of each regulator. Barplots show results in HEK293FT cells. (B) Total number of genes with relative changes in intronic or tandem polyA site usage in HEK293FT cell dataset. (C-D) Read coverage plots showing differential usage of intronic sites (boxed) at the ZSCA9 (C) and EXOSC4 locus (D). (E) Heatmap showing polyA residuals for intronic sites that are uniquely differentially utilized after perturbation of PAF, SCAF8, PABPN1, and CPSF3L. Each heatmap cell shows the pseudobulk average of cells after grouping by sgRNA identity. (F) Number of genes with significant changes in tandem polyA site usage in HEK293FT cell dataset, classified by 3’ UTR shortening or 3’ UTR lengthening. (G) Boxplot indicating the observed log2 fold-change in gene expression after NUDT21 perturbation. Genes are partitioned into deciles based on the degree of 3’ UTR changes observed after NUDT21 perturbation.
Figure 4:
Figure 4:. Modules of co-regulated polyA sites exhibit functional differences
(A) Pearson correlation matrix depicting the relationships between perturbations in HEK293FT cells. Correlations are calculated using the linear model coefficients learned during differential polyadenylation analysis (Supplementary Methods). Matrices include all perturbations where we obtained at least 50 cells in both HEK and K562 cells, and are ordered via hierarchical clustering. (B) Same as (A), but the correlation matrix is generated from an independent analysis on K562 polyA residuals. (C) Heatmap showing polyA-residuals for distal peak sites in Module A genes (CSTF and CPSF act in the opposite direction as CPSF6/NUDT21), and Module B genes (CSTF and CPSF act in the same direction as CPSF6/NUDT21). For visualization, the top 100 polyA sites, ranked by the magnitude of CSTF perturbation, are shown for each module. (D) Schematic diagram of genes belonging to module A and Module B. (E) Read coverage plots showing polyA site usage of representative genes belonging to module A (left, CCT6A) and module B (right, TMEM106C). (F) Density plot showing distal site usage in NT control cells for genes belonging to Module A (left) versus Module B (right). Genes in Module A tend to use the proximal site, while genes in Module B tend to use the distal site.
Figure 5.
Figure 5.. A multi-task neural network predicts perturbation responses from RNA sequence.
(A) Schematic of (APARENT-Perturb), an ensemble-based neural network architecture for predicting perturbation responses. Green/blue/red output heads correspond to model predictions for the K perturbation conditions. (B) 10-fold cross-validation performance when predicting distal isoform proportions (top row) or differences in distal isoform proportion with respect to the NT condition (bottom row). (C) Sequence-specific attribution scores for two example perturbations in the KMT5A gene. Attribution scores are displayed after calculating residuals with respect to NT cells. (D) Averaged attribution scores as a function of position, for 10 perturbations. The three top MoDISco motifs are shown for each perturbation (Supplementary Methods). (E) Heatmap showing averaged attribution scores for each perturbation, as a function of position, for the distal-most site in each gene. (F) Mean attribution scores for CSTF1 perturbation in Module A vs Module B for both proximal sites (left) and distal sites (right). Location of the core hexamer and downstream sequence elements (DSE) are marked with solid and dashed vertical lines, respectively. Plots show the mean attribution score at single base-pair resolution (points), as well as the loess-smoothed trend (lines). (G) Epistasis analysis for dual UGUA motifs, in either G/C-rich contexts (red) or A/U-rich contexts (blue). The y-axis reflects the effect on predicted NUDT21 perturbation after dual insertion of both motifs, compared to the effect of inserting one motif at a time (Supplementary Methods). (H) Epistasis analysis of canonical hexamers and U/G-rich motifs, based on the RBBP6 perturbation.
Figure 6:
Figure 6:. Characterizing heterogeneity in relative polyA site usage in additional 3’ scRNA-seq datasets
(A) 3’ UTR shortening preference observed after perturbing regulators in the CPA-Perturb-seq dataset (x-axis), and the GWPS dataset (y-axis). We observe concordant results for this global metric across datasets. (B) Same as Figure 3B, but for the GWPS dataset. (C) Correlation matrix depicting the relationship between perturbations in the GWPS dataset, as in Figure 4A. Representative genes for each of the six correlated modules are shown on the left. All genes are listed in Supplementary Figure 6A. Shown are all perturbations where we detected changes in relative polyA site usage in at least 50 genes. (D-F) MBNL1 perturbation phenocopies perturbation of PAXT complex members. (D) Heatmap shows polyA-residuals for polyA sites that are differentially utilized after both MBNL1 and PAXT perturbation. (E-F) Representative read coverage plot depicting changes in polyA site usage after perturbation of PAXT complex members and MBNL1. (G) UMAP visualization generated from polyA residuals of PBMC dataset. Cells are colored based on their gene expression-based cell annotation. (H) Gene ontology enrichment analysis on genes exhibiting 3’UTR shortening in plasma cells compared to B cells. (I) Read coverage plot depicting 3’UTR shortening in CHCHD7 gene in distinct B and plasma cell subpopulations. (J) Average polyA-residual (reflects degree of 3’ UTR shortening) of proximal sites with increased usage in plasma cells. We observe extensive heterogeneity within the plasma cell lineage, including increased shortening in cycling plasmablasts, and two subpopulations of non-cycling plasma cells (denoted by horizontal line, Supplementary Figure 7C).

References

    1. Di Giammartino D.C., Nishida K., and Manley J.L. (2011). Mechanisms and consequences of alternative polyadenylation. Mol. Cell 43, 853–866. - PMC - PubMed
    1. Tian B., and Manley J.L. (2017). Alternative polyadenylation of mRNA precursors. Nat. Rev. Mol. Cell Biol. 18, 18–30. - PMC - PubMed
    1. Proudfoot N.J. (2011). Ending the message: poly(A) signals then and now. Genes Dev. 25, 1770–1782. - PMC - PubMed
    1. Gruber A.J., and Zavolan M. (2019). Alternative cleavage and polyadenylation in health and disease. Nat. Rev. Genet. 20, 599–614. - PubMed
    1. Tian B., Hu J., Zhang H., and Lutz C.S. (2005). A large-scale analysis of mRNA polyadenylation of human and mouse genes. Nucleic Acids Res. 33, 201–212. - PMC - PubMed

Publication types