[Preprint]. 2023 Feb 8:rs.3.rs-2524641.
doi: 10.21203/rs.3.rs-2524641/v1.

ApoE Alzheimer's Disease Aβ-amyloid plaque morphology varies according to APOE isotype

Affiliations

ApoE Alzheimer's Disease Aβ-amyloid plaque morphology varies according to APOE isotype

Ina Caesar et al. Res Sq. .

Abstract

Background: The apolipoprotein E (APOE, gene; apoE, protein) ε4 allele is the most common identified genetic risk factor for typical late-onset sporadic Alzheimer's disease (AD). Each APOE ε4 allele roughly triples the relative risk for AD compared to that of the reference allele, APOE ε3.

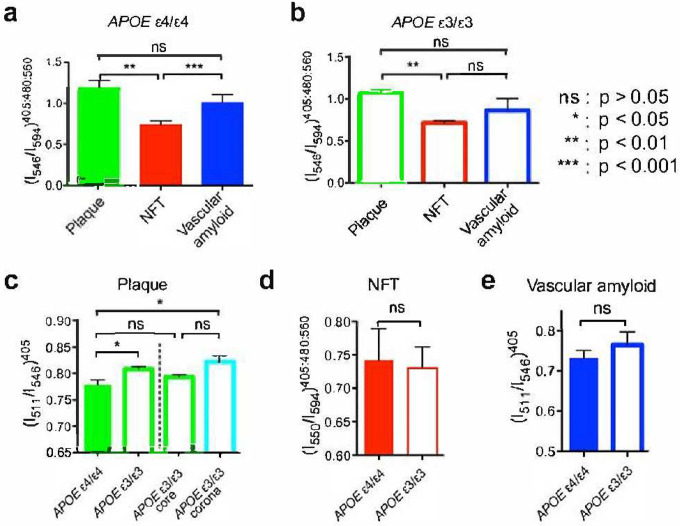
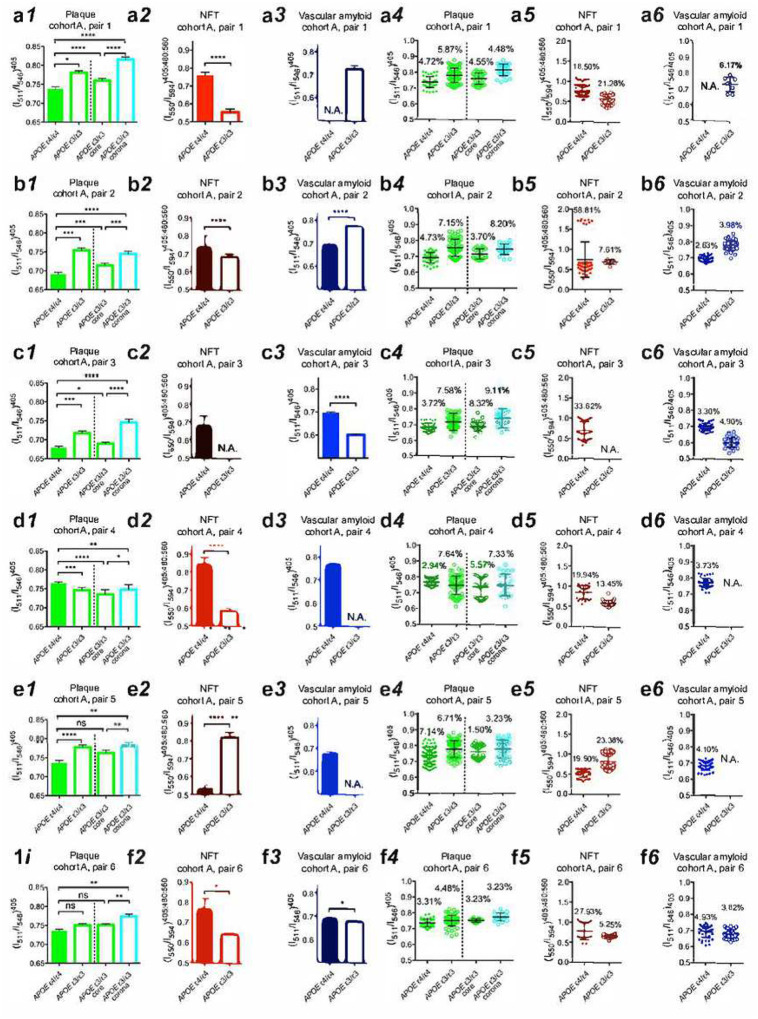
Methods: We have employed hyperspectral fluorescence imaging with an amyloidspecific, conformation-sensing probe, p-FTAA, to elucidate protein aggregate structure and morphology in fresh frozen prefrontal cortex samples from human postmortem AD brain tissue samples from patients homozygous for either APOE ε3 or APOE ε4.

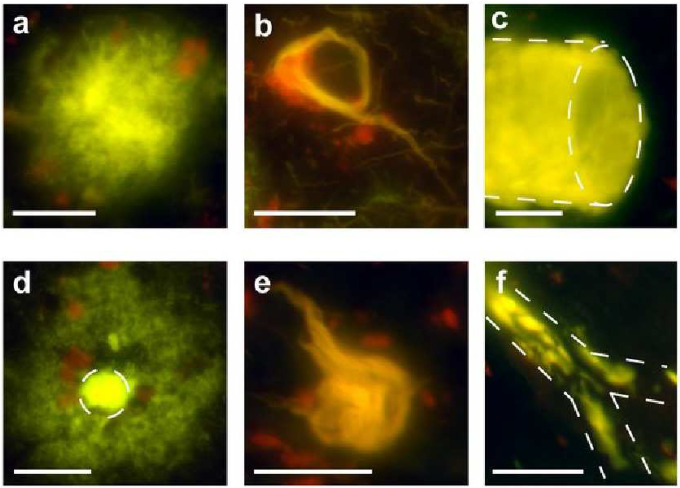
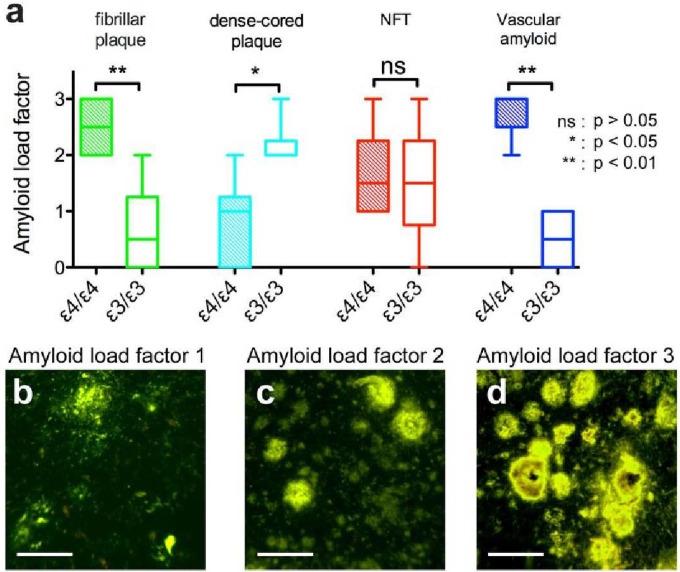
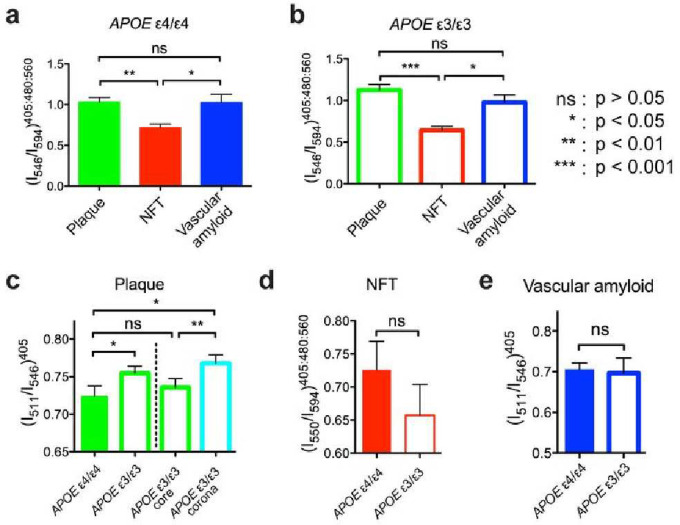
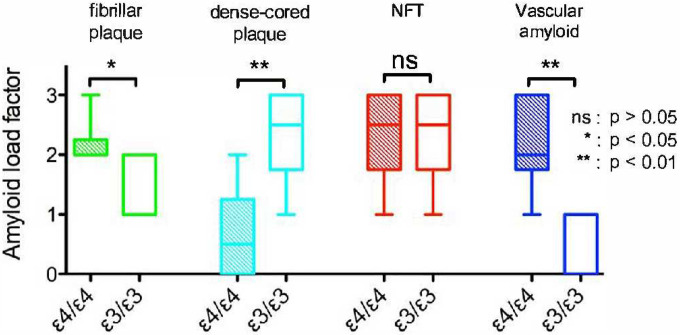
Results: As expected APOE ε4/ε4 tissues had significantly larger load of CAA than APOE ε3/ε3. APOE isoform-dependent morphological differences in amyloid plaques were also observed. Amyloid plaques in APOE ε3/ε3 tissue had small spherical cores and large corona while amyloid plaques in APOE ε4/ε4 tissues had large irregular and multilobulated plaques with relatively smaller corona. Despite the different morphologies of their cores, the p-FTAA stained APOE ε3/ε3 amyloid plaque cores had spectral properties identical to those of APOE ε4/ε4 plaque cores.

Conclusions: These data support the hypothesis that one mechanism by which the APOE ε4 allele affects AD is by modulating the macrostructure of pathological protein deposits in brain. APOE ε4 is associated with a higher density of amyloid plaques (as compared to APOE ε3). We speculate that multilobulated APOE ε4-associated plaques arise from multiple initiation foci that coalesce as the plaques grow.

Keywords: Alzheimer’s disease (AD); Cerebral amyloid angiopathy (CAA); apolipoprotein E (APOE, gene; apoE, protein); hyperspectral fluorescence imaging; luminescent conjugated oligothiophene (LCO); neurofibrillary tangle (NFT); plaque.


Figures

Figure 1.
Figure 1.. Hyperspectral emission micrographs of amyloid aggregates found in postmortem AD brain samples.
Representative micrographs of (a) fibrillar plaque, (b) NFT, and (c) vascular amyloid in AD patients with APOE ε4/ε4 genotype. Representative micrographs of (d) dense-cored plaque, (e) NFT, and (f) vascular amyloid in AD patients with APOE ε3/ε3 genotype. Scale bars = 200 μm.
Figure 2.
Figure 2.. Amyloid load factor of amyloid deposits found in postmortem AD brain samples.
(a) The amyloid load factor of plaques separated as fibrillar plaques (green), dense-cored plaques (cyan), NFT (red), and vascular amyloid (blue) of samples with APOE ε4/ε4 genotype (filled bars) and of samples with APOE ε3/ε3 genotype (open bars). The amyloid load factors represent undetectable (0), sparse densities (1), moderate densities (2), or heavy densities (3) of each type of lesion. Representative images of amyloid load factor 1, 2, and 3 of the plaques are showed in (b), (c), and (d) respectively.
Figure 3.
Figure 3.. Spectral separation as a function of APOE genotype.
(a) Spectral emission fraction of plaques (green), NFT (red), and vascular amyloid (blue) in AD patients with APOE ε4/ε4 genotype. (b) Spectral emission fraction of plaques (green), NFT (red), and vascular amyloid (blue) in AD patients with APOE ε3/ε3 genotype. Spectral separation using optimized emission fractions of (c) plaque, (d) NFT, and (e) vascular amyloid in AD patients with APOE genotype of ε4/ε4 (filled bars) or respective ε3/ε3 (open bars). The spectral separation of the dense-cored plaques from APOE ε3/ε3 AD patients are separated into a core (green) and a corona (cyan) fraction in (c). Error bars indicate SEM.
Figure 4.
Figure 4.
Amyloid load factor of amyloid aggregates found in postmortem AD brain samples of cohort B. The amyloid load factor of plaques separated as fibrillar plaques (green) and dense-cored plaques (cyan), NFT (red), and vascular amyloid (blue) of samples with APOE ε4/ε4 genotype (filled bars) and of samples with APOE ε3/ε3 genotype (open bars). The amyloid load factor is classified from samples as: undetectable (0), sparse amount (1), moderate amount (2), or frequent (3), for each type of lesion.
Figure 5.
Figure 5.
Spectral separation as a function of APOE isoform in cohort B. (a) Spectral emission fraction of plaques (green), NFT (red), and vascular amyloid (blue) in AD patients with APOE ε4/ε4 genotype. (b) Spectra emission fraction of plaques (green), NFT (red), and vascular amyloid (blue) in AD patients with APOE ε3/ε3 genotype. Spectral separation using optimized emission fractions for (c) plaque, (d) NFT, and (e) vascular amyloid in AD patients with APOE genotype of ε4/ε4 (filled bars) or respective ε3/ε3 (open bars). The spectral separation of the dense-cored plaques from APOE ε3/ε3 AD patients are separated into a core (green) and a corona (cyan) fraction in (c). Error bars indicate SEM.
Figure 6.
Figure 6.
Spectral emission fractions shown for separation and distribution as a function of APOE isoform from cohort A of (a) pair 1, (b) pair 2, (c) pair 3, (d) pair 4, (e) pair 5, and (f) pair 6. Spectral separation using optimized emission fractions for (1) plaque, (2) NFT, and (3) vascular amyloid in AD patients with APOE genotype of ε4/ε4 (filled bars) or ε3/ε3 (open bars). Spectral distribution optimized emission fractions of (4) plaque, (5) NFT, and (6) vascular amyloid in AD patients with APOE genotype of ε4/ε4 (filled circles) or ε3/ε3 (open circles). The spectral emission fraction separation of the dense-cored plaques from APOE ε3/ε3 AD patients is separated into one core (green) and one corona (cyan) component in (1) and (4) respectively. Error bars indicate (1–3) SEM and (4–6) SD. Percentage are indicate coefficient of variation in (4–6). Not significant (ns): P > 0.05, *: P < 0.05, **: P < 0.01, ***: P < 0.001, ****: p < 0.0001.

References

    1. Gandy S, DeKosky ST. Toward the treatment and prevention of Alzheimer’s disease: rational strategies and recent progress. Annu rev med. 64, 367–83. doi: 10.1146/annurev-med-092611-084441 (2013). - DOI - PMC - PubMed
    1. Gandy S, DeKosky ST. 2012: the year in dementia. Lancet neurol. 12, 4–6. doi: 10.1016/S1474-4422(12)70284-3 (2013). - DOI - PMC - PubMed
    1. Lublin AL, Gandy S. Amyloid-beta oligomers: possible roles as key neurotoxins in Alzheimer’s Disease. Mt Sinai J Med. 77, 43–49. doi: 10.1002/msj.20160 (2010). - DOI - PMC - PubMed
    1. Gandy S, Simon AJ, Steele JW, Lublin AL, Lah JJ, Walker LC, Levey AI, Krafft GA, Levy E, Checler F, Glabe C, Bilker WB, Abel T, Schmeidler J, Ehrlich ME. Days to criterion as an indicator of toxicity associated with human Alzheimer amyloid-beta oligomers. Ann Neurol. 2010. Aug;68(2):220–30. doi: 10.1002/ana.22052. - DOI - PMC - PubMed
    1. Hyman BT, West HL, Rebeck GW, Buldyrev SV, Mantegna RN, Ukleja M, Havlin S, Stanley HE. Quantitative analysis of senile plaques in Alzheimer disease: observation of log-normal size distribution and molecular epidemiology of differences associated with apolipoprotein E genotype and trisomy 21 (Down syndrome). Proc Natl Acad Sci U S A. 1995. Apr 11;92(8):3586–90. - PMC - PubMed

Publication types