[Preprint]. 2023 Feb 10:2023.02.09.527940.
doi: 10.1101/2023.02.09.527940.

Scalable co-sequencing of RNA and DNA from individual nuclei

Affiliations

Scalable co-sequencing of RNA and DNA from individual nuclei

Timothy R Olsen et al. bioRxiv. .

Update in

Abstract

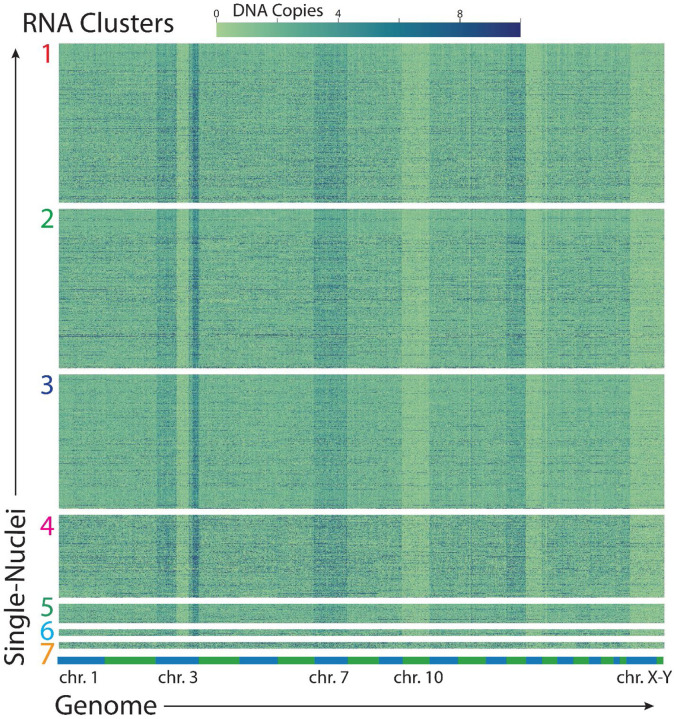
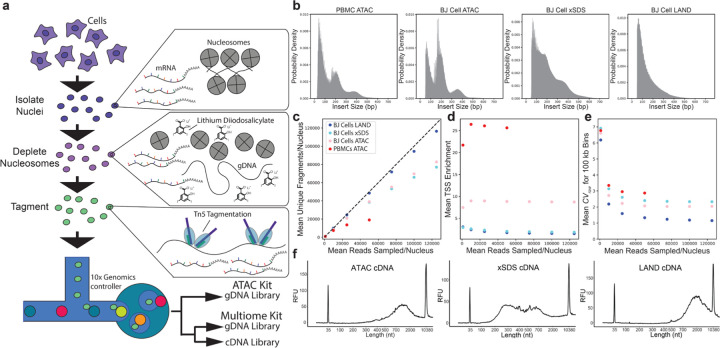
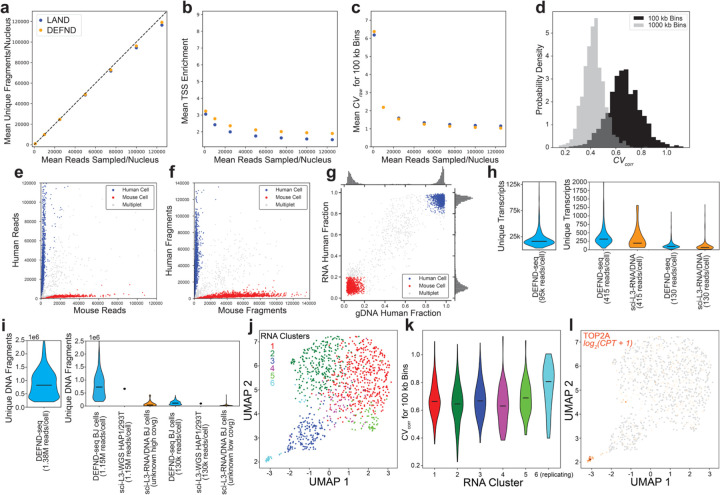
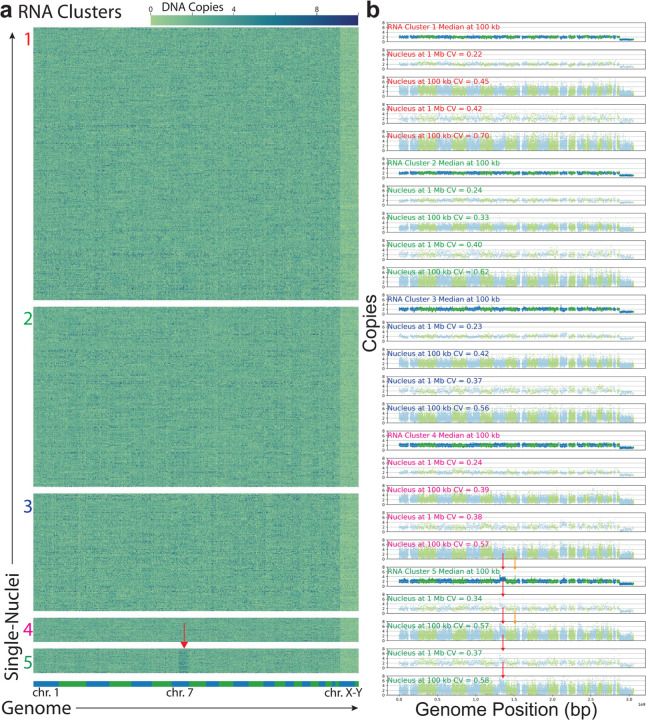
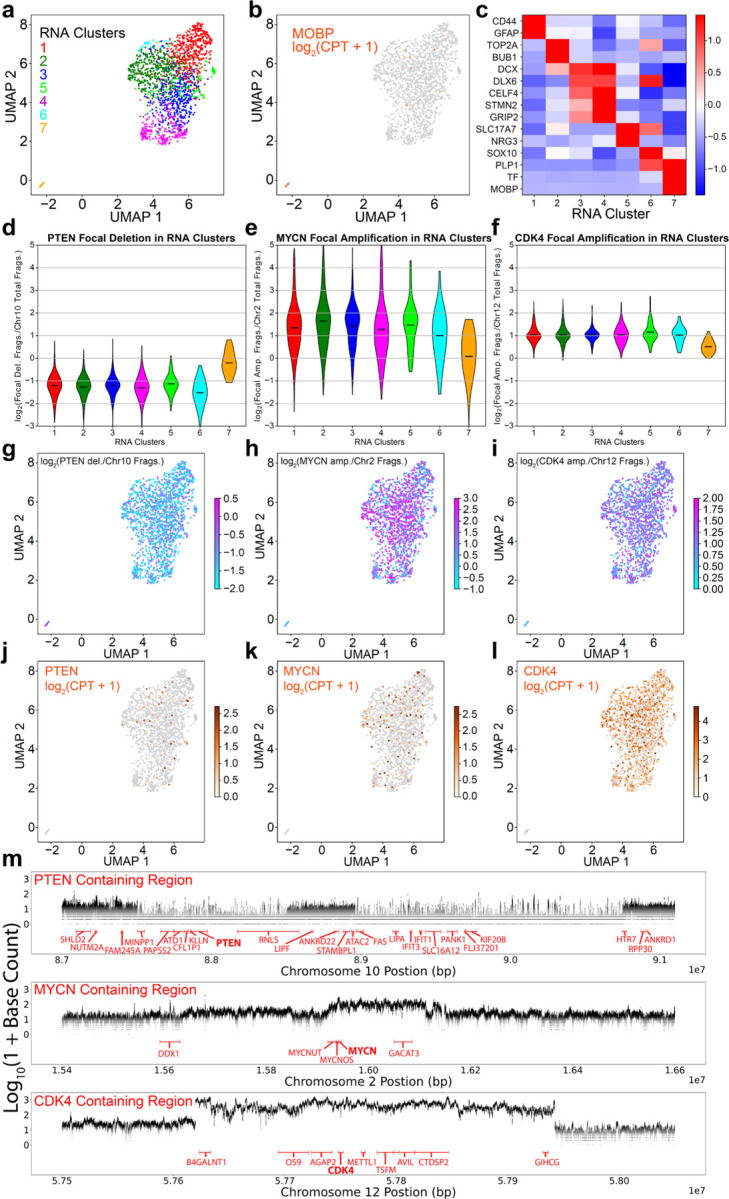
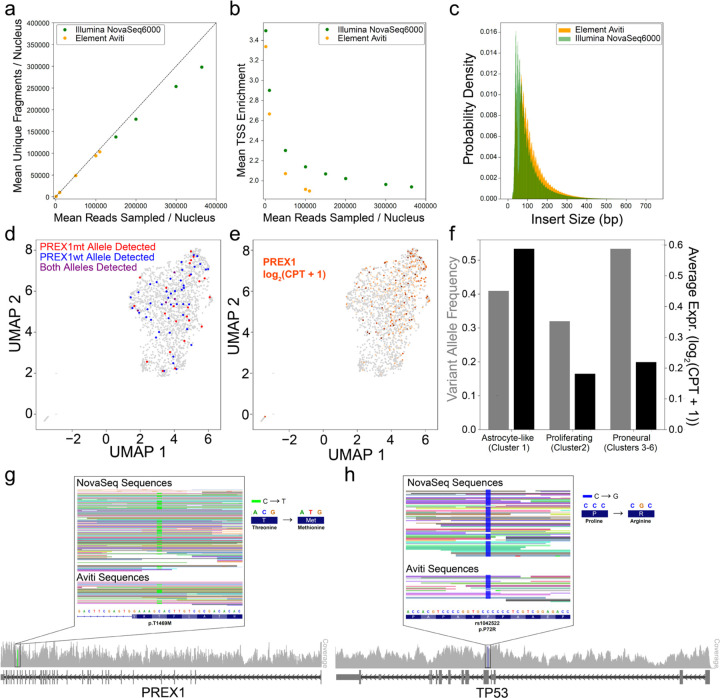
The ideal technology for directly investigating the relationship between genotype and phenotype would analyze both RNA and DNA genome-wide and with single-cell resolution. However, existing tools lack the throughput required for comprehensive analysis of complex tumors and tissues. We introduce a highly scalable method for jointly profiling DNA and expression following nucleosome depletion (DEFND-seq). In DEFND-seq, nuclei are nucleosome-depleted, tagmented, and separated into individual droplets for mRNA and genomic DNA barcoding. Once nuclei have been depleted of nucleosomes, subsequent steps can be performed using the widely available 10x Genomics droplet microfluidic technology and commercial kits without experimental modification. We demonstrate the production of high-complexity mRNA and gDNA sequencing libraries from thousands of individual nuclei from both cell lines and archived surgical specimens for associating gene expression phenotypes with both copy number and single nucleotide variants.


Conflict of interest statement

Competing Interests P.A.S. receives patent royalties from Guardant Health.

Figures

Extended Data Figure 1:
Copy number variation heatmap of GBM tumor cells. Cells are grouped by gene expression cluster. Chromosome location reference on bottom margin.
Figure 1:
Figure 1:
Schmatic and characterization of nucleosome depletion methods. (a) Schematic of the gDNA protocol. Nuclei are isolated, treated with lithium diiodosalicylate, and then tagmented with scATAC-seq reagents or multiome reagents. A gDNA library is produced using scATAC-seq reagents (10x Genomics). When using 10x Genomics Multiome reagents, gDNA and cDNA libraries are produced. We term this DEFND-seq. (b) Fragment length distribution for a scATAC-seq library with PBMCs, scATAC-seq with BJ fibroblasts, BJ fibroblast nuclei prepared using the xSDS protocol, and BJ fibroblast nuclei prepared with the LAND protocol. (c - e) Subsampling analysis of (c) unique fragments, (d) transcription start site (TSS) enrichment, and (e) 100 kb bin coefficient of variation (CV) with BJ fibroblasts prepared with scATAC-seq, BJ fibroblasts prepared with xSDS, BJ fibroblasts prepared with LAND, and PBMCs prepared with scATAC-seq. (f) Bulk BJ fibroblast cDNA BioAnalyzer traces for cells prepared with ATAC, cells prepared with xSDS, and cells prepared with LAND.
Figure 2:
Figure 2:
DEFND-seq. (a)-(c) Subsampling analysis of (a) unique fragments, (b) transcription start site (TSS) enrichment, and (c) 100 kb bin coefficient of variation for BJ fibroblasts prepared with LAND and DEFND-seq. (d) Probability density of the coefficient of variation when using 100 kb bins and 1,000 kb bins. (e) Mixed-species gene expression scatterplot. DEFND-seq was performed on a sample with mixed U87 (human) and 3T3 (mouse) cells. Cells were determined to be mouse (>85% of reads are mouse aligned) or human (>80% of reads are human aligned). (f) Mixed-species gDNA scatterplot. Genomic fragments were counted for the same cells in (e). Cells were determined to be mouse (>80% of fragments are mouse aligned) or human (>85% of fragments are human aligned). (g) Scatter plot of the human alignment rates for RNA and gDNA for the mixed species nuclei from (e) and (f). (h) Violin plots of gene expression performance. Bars represent median values. The number of unique transcripts at full sequencing depth is shown, as well as down-sampled violin plots comparing DEFND-seq to sci-L3-RNA/DNA. (i) Violin plots of gDNA performance. Bars represent median values. Total unique gDNA fragments at full sequencing depth are shown along with plots comparing down-sampled DEFND-seq to sci-L3-WGS and sci-L3-RNA/DNA. The sci-L3-WGS data are presented as a single point representing the median. Data for sci-L3-RNA/DNA are of unknown read depth. (j) UMAP embedding colored by gene expression clusters for DEFND-seq BJ fibroblasts. (k) Coefficient of variation of 100 kb genome bins for clusters identified in (j). (i) Same as (j) but colored by TOP2A expression. These cells are primarily located in cluster 6.
Figure 3:
Figure 3:
Copy number variation from DEFND-seq analysis of BJ fibroblasts. (a) CNV heat maps with 100 kb bins of individual nuclei grouped by gene expression cluster number (1 – 5). The actively replicating cluster (cluster 6) was omitted because of the aberrant genomes of replicating cells. A chromosomal map colored by chromosome is included as a reference on the bottom margin. Red arrow indicates a partial Chr. 7q amplification in cluster 5. (b) Relative CNV plots for clusters in (a). For each cluster a plot is included for: cluster-median CNV with 100 kb bins, a single low-CV nucleus CNV with 1 Mb bins, the same low-noise nucleus CNV with 100 kb bins, a randomly selected nucleus with near-median CV using 1 Mb bins, and the same near-median CV nucleus with 100 kb bins. Labels are colored by cluster. Bin colors alternate for different chromosomes. Red arrows and orange arrows indicate the Chr. 7q amplification found in cluster 5 and the HAS2 focal amplification in Chr. 8, respectively.
Figure 4:
Figure 4:
DEFND-seq applied to cryopreserved GBM tumor sample. (a) UMAP embedding of gene expression data colored by unsupervised clustering. (b) Same as (a) but colored by expression of MOBP. (c) Differentially expressed genes for each cluster in (a). (d) Single-cell distributions of the log-ratio of the average unique fragements/100 kb bin detected in a focally deleted region containing PTEN to the average unique fragments/100 kb bin for Chr. 10 for each cluster in (a) showing focal deletion in clusters 1–6. Bars indicate the medians of each cluster. (e) Same as (d) but for a focally amplified region containing MYCN relative to Chr. 2 showing focal amplification in clusters 1–6. (f) Same as (e) but for a focally amplified region containing CDK4 relative to Chr. 12 showing amplification in clusters 1–6. (g) – (i) Nuclei from (a) colored by genomic log fold change in the CNV-containing regions corresponding to (g) PTEN, (h) MYCN, and (i) CDK4. (j) – (l) Nuclei from (a) colored by mRNA expression (log counts-per-thousand) for (j) PTEN, (k) MYCN, and (l) CDK4. (m) Read count pileup of every base along selected genomic regions for all transformed cells. PTEN, MYCN, and CDK4 regions are presented along with a selection of genes located in the sampled window.
Figure 5:
Figure 5:
SNP and SNV detection. (a) Sequencing saturation analysis of the number of unique fragments per nucleus for a GBM DEFND-seq library sequenced on an Illumina NovaSeq 6000, and on an Element Aviti. (b) Sequencing saturation analysis of the transcription start site enrichment for a library sequenced on both Illumina NovaSeq 6000 and Element Aviti sequencers. (c) Insert size distribution for the GBM library sequenced on Illumina NovaSeq 6000 and Element Aviti sequencers. (d) PREX1 genomic mutation detection projected on a UMAP derived from the gene expression dataset. (e) Same as (d) but colored by PREX1 expression. (f) PREX1 variant allele frequency and average expression of PREX1 in astrocyte-like, proliferating, and proneural clusters. (g) Integrated genomic viewer (IGV) style plots of the transformed cells showing exonic regions of PREX1, coverage, and the location of the SNV. The SNV is magnified to show the missense mutation and affected amino acid. Individual reads are shown for both the Illumina NovaSeq 6000 and Element Aviti sequencers and each read is colored by cell of origin (cell barcode). (h) Same as (g) but for the p.P72R mutation on TP53.

References

    1. Kashima Y. et al. Single-cell sequencing techniques from individual to multiomics analyses. Exp. Mol. Med. 52, 1419–1427 (2020). - PMC - PubMed
    1. Mallory X.F., Edrisi M., Navin N. & Nakhleh L. Methods for copy number aberration detection from single-cell DNA-sequencing data. Genome biology 21, 1–22 (2020). - PMC - PubMed
    1. Suvà M.L. & Tirosh I. Single-Cell RNA Sequencing in Cancer: Lessons Learned and Emerging Challenges. Mol. Cell 75, 7–12 (2019). - PubMed
    1. Macaulay I.C., Ponting C.P. & Voet T. Single-cell multiomics: multiple measurements from single cells. Trends Genet. 33, 155–168 (2017). - PMC - PubMed
    1. Darmanis S. et al. Single-Cell RNA-Seq Analysis of Infiltrating Neoplastic Cells at the Migrating Front of Human Glioblastoma. Cell Reports 21, 1399–1410 (2017). - PMC - PubMed

Publication types