[Preprint]. 2023 Feb 9:2023.02.09.527921.
doi: 10.1101/2023.02.09.527921.

Modulation of GPR133 (ADGRD1) Signaling by its Intracellular Interaction Partner Extended Synaptotagmin 1 (ESYT1)

Affiliations

Modulation of GPR133 (ADGRD1) Signaling by its Intracellular Interaction Partner Extended Synaptotagmin 1 (ESYT1)

Gabriele Stephan et al. bioRxiv. .

Update in

Abstract

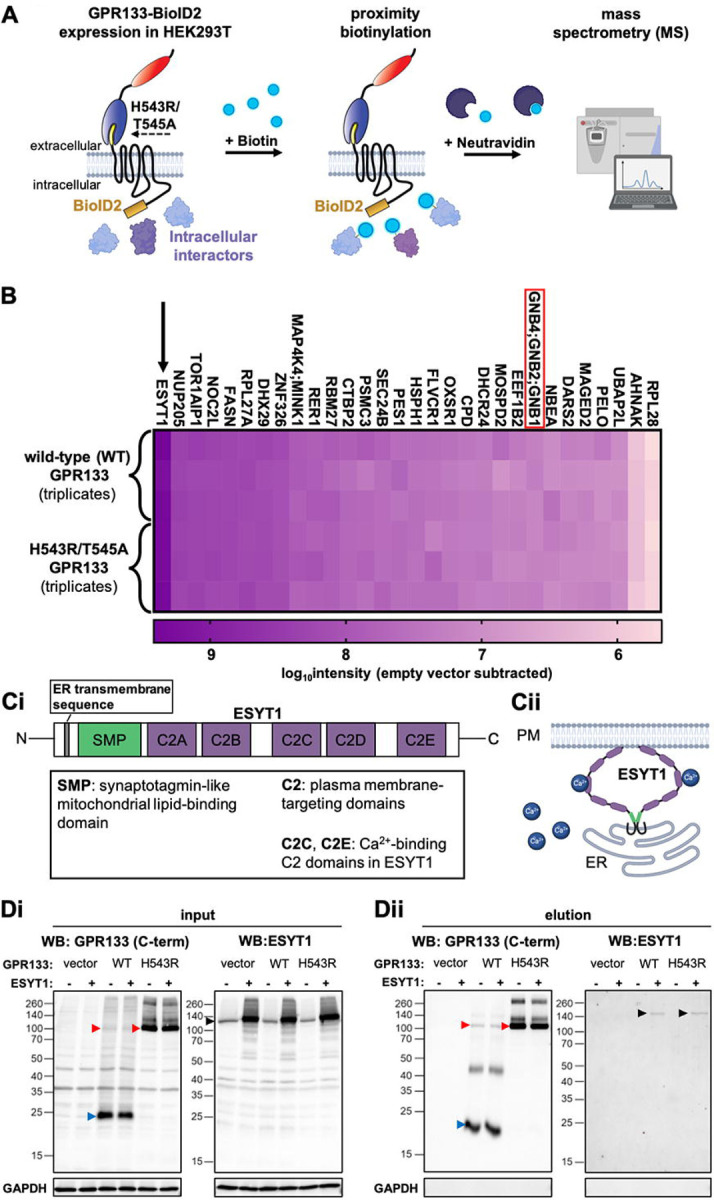
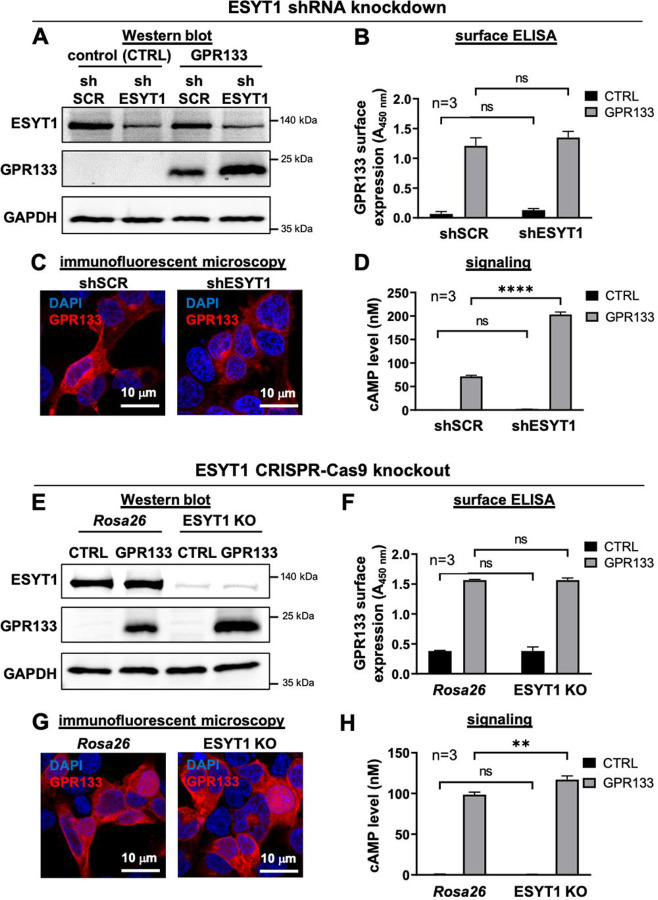
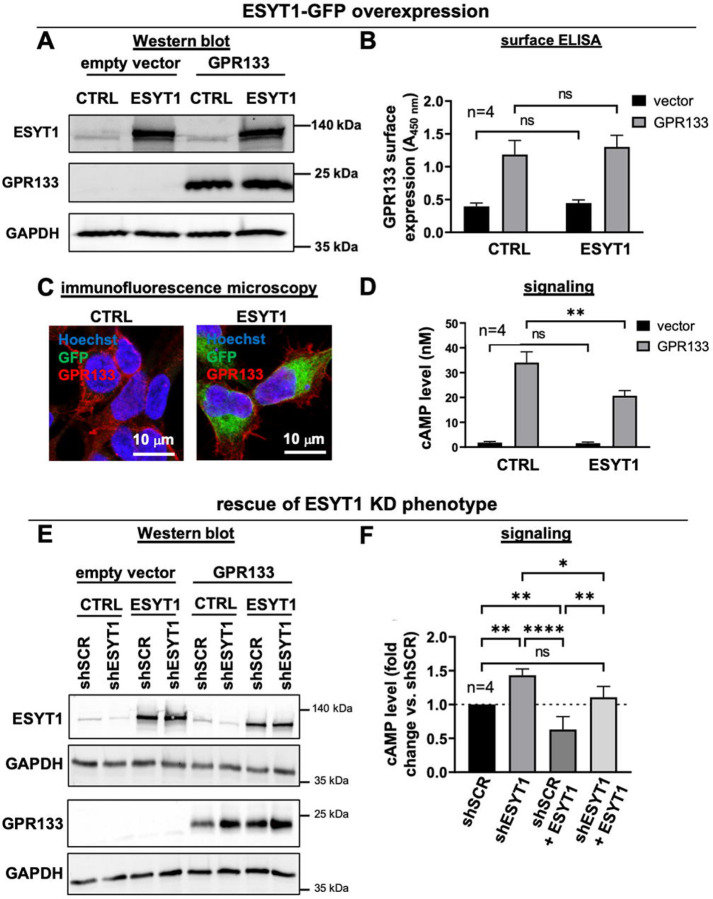
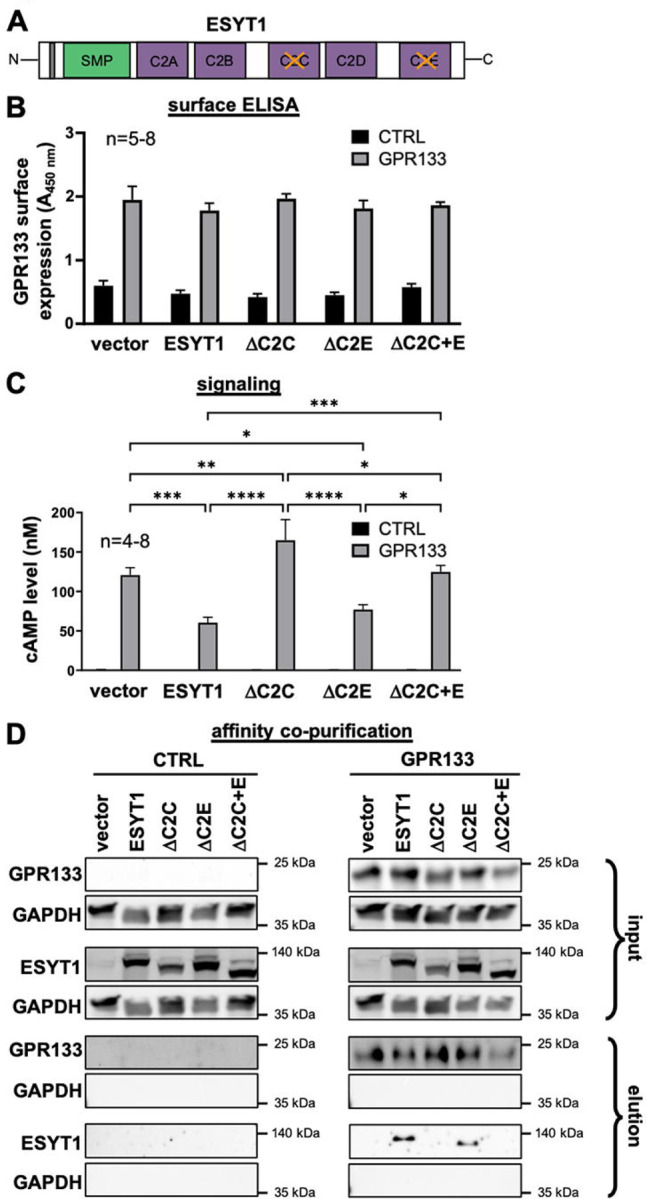
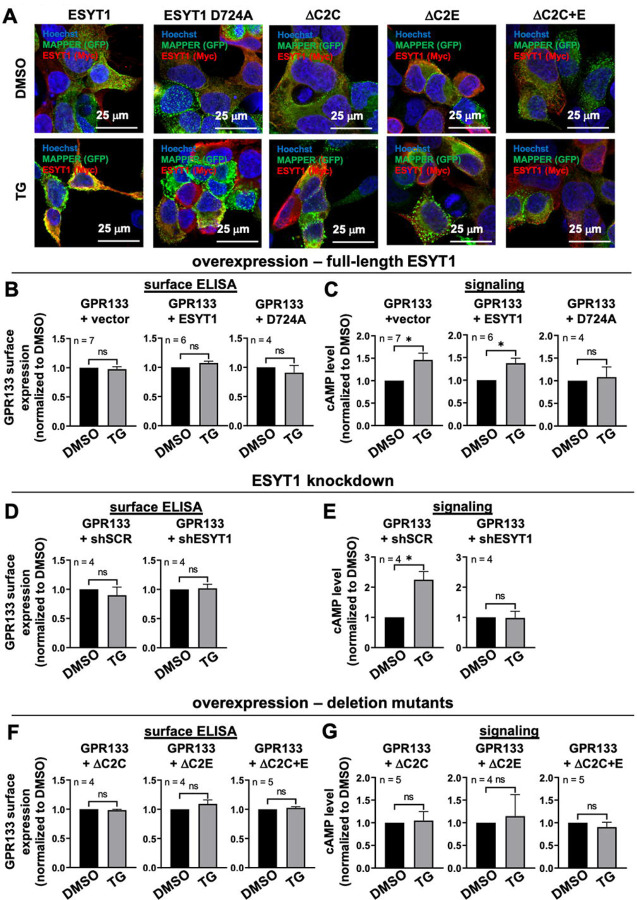
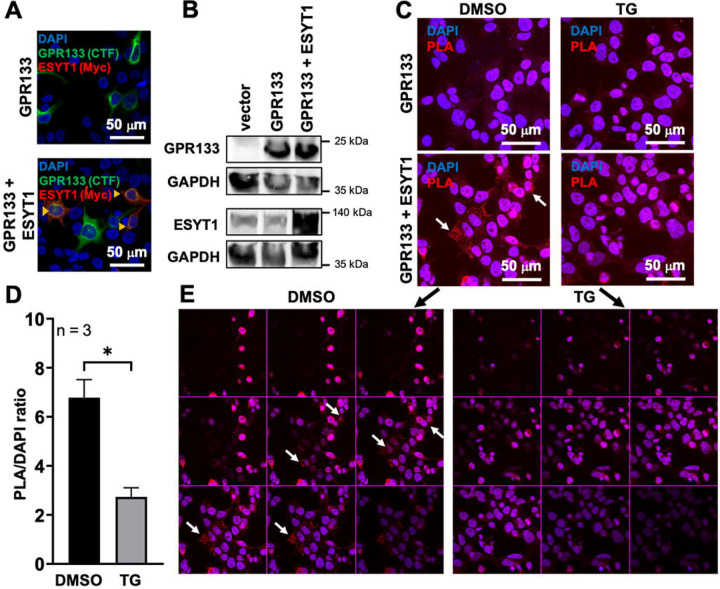
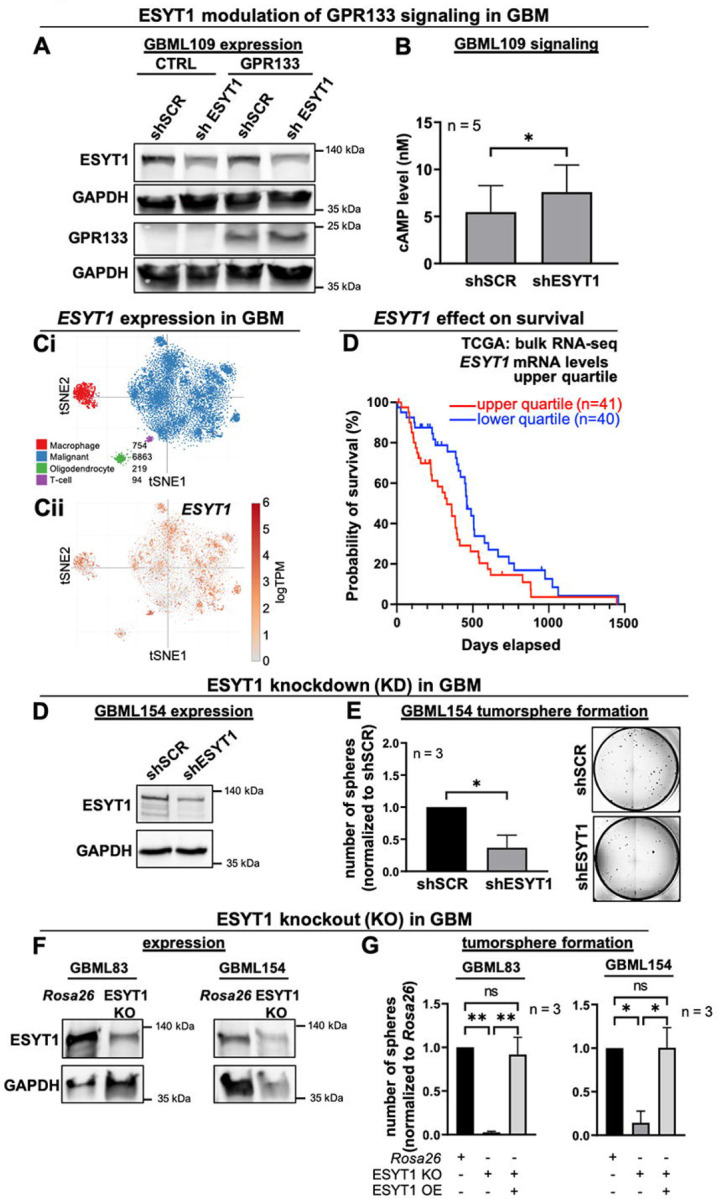
GPR133 (ADGRD1) is an adhesion G protein-coupled receptor that signals through Gαs and is required for growth of glioblastoma (GBM), an aggressive brain malignancy. The regulation of GPR133 signaling is incompletely understood. Here, we use proximity biotinylation proteomics to identify ESYT1, a Ca2+-dependent mediator of endoplasmic reticulum-plasma membrane bridge formation, as an intracellular interactor of GPR133. ESYT1 knockdown or knockout increases GPR133 signaling, while its overexpression has the opposite effect, without altering GPR133 levels in the plasma membrane. The GPR133-ESYT1 interaction requires the Ca2+-sensing C2C domain of ESYT1. Thapsigargin-mediated increases in cytosolic Ca2+ relieve signaling-suppressive effects of ESYT1 by promoting ESYT1-GPR133 dissociation. ESYT1 knockdown or knockout in GBM impairs tumor growth in vitro, suggesting functions of ESYT1 beyond the interaction with GPR133. Our findings suggest a novel mechanism for modulation of GPR133 signaling by increased cytosolic Ca2+, which reduces the signaling-suppressive interaction between GPR133 and ESYT1 to raise cAMP levels.

Keywords: ESYT1; GPR133; adhesion G protein-coupled receptor; cAMP; calcium; extended synaptotagmin.


Conflict of interest statement

Disclosures and Competing Interests DGP and NYU Grossman School of Medicine own an EU and Hong Kong patent titled “Method for treating high-grade gliomas” on the use of GPR133 as a treatment target in glioma. DGP has received consultant fees from Tocagen, Synaptive Medical, Monteris, Robeaute and Advantis.

Figures

Figure 1:
Figure 1:. Identification of ESYT1 as a novel cytosolic interaction partner of GPR133.
(A) Experimental design: BioID2-fusion constructs of wild-type (WT) or mutant (H543R/T545A) GPR133 were overexpressed in HEK293T cells. Following treatment with biotin, biotinylated proteins were purified using Neutravidin beads. Purified proteins were analyzed by mass spectrometry. (B) Top 30 biotinylated proteins with statistically equivalent detection in the two experimental conditions were ranked based on their mean MS intensity. ESYT1 (arrow) shows the highest intensity of all biotinylated proteins in close proximity to GPR133, independent on GPR133 cleavage and signaling. Gβ subunits are also identified (red box). (C) Structure and function of ESYT1. (Ci) Structural domains of ESYT1. (Cii) ESYT1 dimers form ER-PM tethers in response to elevations in cytosolic Ca2+. (D) Co-purification confirms binding of ESYT1 to TwinStrep-tagged GPR133, both WT and the uncleavable H543R mutant. (Di) Input samples: Whole cell lysates of HEK293T cells expressing wild-type GPR133 or the cleavage-deficient mutant GPR133 (H543R) with a C-terminal TwinStrep-tag following transfection with ESYT1. (Dii) Elution samples following Strep-Tactin purification. WB, Western blot; C-term, antibody against the cytosolic C-terminus of GPR133.
Figure 2:
Figure 2:. Effects of ESYT1 knockdown and knockout on GPR133 signaling.
(A-D) ESYT1 knockdown. (A) Western blot confirms reduced levels of endogenous ESYT1 following its knockdown (shESYT1) compared to the control (shSCR), and stable expression of GPR133, in transduced HEK293T cells. (B) GPR133 surface expression is not affected by ESYT1 knockdown in ELISA assays (two-way ANOVA, p>0.05). ns, not significant; A450 nm, absorbance/optical density at 450 nm. Bars represent mean ± SEM of 3 experiments. (C) Immunofluorescent staining shows no change in the subcellular localization of GPR133 following knockdown of ESYT1 compared to the control. (D) Intracellular cAMP levels increase significantly in GPR133 expressing HEK293T cells after knockdown of ESYT1 compared to the control (two-way ANOVA F(1,8)=503.2, p<0.0001; Sidak’s post hoc test: GPR133 + shSCR vs. GPR133 + shESYT1, p<0.0001). Bars represent mean ± SEM of 3 experiments. (E-H) ESYT1 knockout. (E) Western blot confirms reduced levels of endogenous ESYT1 following the KO compared to the control (Rosa26). Expression of GPR133 is not affected by ESYT1 KO in transfected HEK293T cells. (F) GPR133 surface expression does not change upon KO of ESYT1 compared to the Rosa26 control in ELISA assays (two-way ANOVA, p>0.05). Bars represent mean ± SEM of 3 experiments. ns, not significant; A450 nm, absorbance/optical density at 450 nm. (G) Immunofluorescent staining of HEK293T cells transfected with GPR133 shows no change in GPR133 subcellular localization in ESYT1 KO cells compared to the control cells (Rosa26). (H) Significant increase of cAMP concentrations in GPR133 expressing HEK293T cells following KO of ESYT1 compared to the control (two-way ANOVA F(1,8)=10.92, p=0.0108; Sidak’s post hoc test: GPR133 + Rosa26 vs. GPR133 + ESYT1 KO, p=0.0027). Bars represent mean ± SEM of 3 experiments.
Figure 3:
Figure 3:. Effect of ESYT1-GFP overexpression on GPR133 signaling and expression.
(A-D) ESYT1-GFP overexpression. (A) Western blot confirms increased ESYT1-GFP protein levels following transfection of GPR133 expressing cells. GPR133 expression levels are not affected in HEK293T cells. (B) GPR133 surface expression remains unchanged following overexpression of ESYT1-GFP (two-way ANOVA, p>0.05). Bars represent mean ± SEM of 4 experiments. ns, not significant; ns, not significant; A450 nm, absorbance/optical density at 450 nm. (C) Immunofluorescent staining of HEK293T cells expressing GPR133 and ESYT1-GFP. The cellular distribution of GPR133 immunoreactivity is unchanged. (D) Intracellular cAMP levels significantly decrease in GPR133-expressing HEK293T cells following overexpression of ESYT1-GFP compared to the control (two-way ANOVA F(1,12)=7.928, p<0.0156; Sidak’s post hoc test: GPR133 + CTRL vs. GPR133 + ESYT1, p=0.0041). Bars represent mean ± SEM of 4 experiments. ns, not significant. (E-F) ESYT1 overexpression rescues the effect of ESYT1 knockdown in GPR133-overexpressing cells. (E) Western Blot confirming ESYT1 knockdown and overexpression in HEK293T cells and HEK293T cells overexpressing GPR133. Expression levels of GPR133 were not affected following knockdown or overexpression of ESYT1. (F) Intracellular cAMP levels of GPR133 expressing HEK293T cells are normalized to shSCR. Bars represent mean ± SEM of 4 experiments. Compared to the control (shSCR), GPR133 signaling increases significantly following transduction with shESYT1 and decreases significantly following transfection with ESYT1. ESYT1 overexpression rescues the increase in cAMP levels after ESYT1 KD (one-way ANOVA F(3,12)=24.64, p<0.0001; Tukey’s post hoc test: shSCR vs. shESYT1, p=0.0030; shSCR vs. shSCR + ESYT1, p=0.0094; shESYT1 vs. shSCR + ESYT1, p<0.0001; shESYT1 vs. shESYT1 + ESYT1, p=0.0217; shSCR + ESYT1 vs. shESYT1 + ESYT1, p=0.0014). Bars represent mean ± SEM of 4 experiments. ns, not significant.
Figure 4:
Figure 4:. ESYT1 does not affect the Gαs-adenylate cyclase machinery.
(A-B) Effect of ESYT1 knockdown on ADRB2 signaling. (A) Western blot analysis of whole cell lysates detects reduced ESYT1 levels following ESYT1 knockdown in HEK293T cells. Using a Flag-antibody, ADRB2 is detected following transfection with a Flag-tagged ADRB2 construct. (B) Intracellular cAMP concentrations do not change in ADRB2 expressing cells following knockdown of ESYT1 compared to the shSCR control (two-way ANOVA, p>0.05). ns, not significant. (C-D) Measurement of cAMP levels in HEK293T cells in response to forskolin (FSK) after either ESYT1 KD (C) or ESYT1 overexpression (D). There were no significant differences in the forskolin-induced increases in cAMP due to either perturbation in ESYT1 levels (two-way ANOVAs, p>0.05). Bars represent mean ± SEM of 2–3 experiments.
Figure 5:
Figure 5:. ESYT1 domains necessary for the interaction with GPR133.
(A) Schematic showing ESYT1 deletion mutants used in this experiment. (B) GPR133 surface expression in ELISA assays following transfection of control HEK293T cells and HEK293T cells stably expressing GPR133 with different ESYT1 constructs. Overexpression of ESYT1, ∆C2C, ∆C2E or ∆C2C+E did not affect GPR133 surface expression compared to the vector control (two-way ANOVA, p>0.05). Bars represent mean ± SEM of 5 to 8 experiments. A450 nm, absorbance/optical density at 450 nm. (C) Intracellular cAMP levels following transfection of HEK293T cells stably expressing GPR133 with different ESYT1 wild-type or mutant constructs. Concentrations of cAMP were significantly decreased in GPR133 expressing cells after transfection with ESYT1 and ∆C2E compared to the vector control. Overexpression of ∆C2C increased cAMP levels compared to the vector control and wild-type ESYT1 in GPR133-expressing HEK293T cells (two-way ANOVA F(4,46)=9.471, p<0.0001; Sidak’s post hoc test: GPR133 + vector vs. GPR133 + ESYT1, p=0.0001; GPR133 + vector vs. GPR133 + ∆C2C, p=0.0080; GPR133 + ESYT1 vs. GPR133 + ∆C2C, p<0.0001; GPR133 + ESYT1 vs. GPR133 + ∆C2C+E, p=0.0002; GPR133 + ∆C2E vs. GPR133 + ∆C2C+E, p=0.0218). Bars represent mean ± SEM of 5 to 8 experiments. (D) Affinity purification analysis testing binding of different ESYT1 constructs to GPR133. Input samples represent whole cell lysates of naïve HEK293T cells and HEK293T cells stably overexpressing GPR133 transfected with ESYT1 wild-type or deletion constructs. Elution samples following Strep-Tactin purification demonstrate that ESYT1 specific bands are only detected in GPR133 expressing cells transfected with wild-type ESYT1 and ∆C2E, but not after transfection with ∆C2C or ∆C2C+E.
Figure 6:
Figure 6:. Intracellular Ca2+ increases impact GPR133 signaling dependent on ESYT1 expression.
(A) Confocal images of HEK293 cells stably overexpressing MAPPER-GFP (green) transfected with Myc-tagged ESYT1 wild-type and mutant constructs (red) following treatment with DMSO or 1 μM TG to increase intracellular Ca2+ concentration. Yellow regions within the images represent overlap of MAPPER (green) and Myc-tagged ESYT1 (red), suggesting localization of ESYT1 at ER-PM junctions. The overlap is significantly more extensive following TG treatment of HEK293-MAPPER cells overexpressing wild-type ESYT1 rather than the mutant constructs. (B-G) Effect of intracellular Ca2+ increases on GPR133 surface expression (B, D, F) and cAMP levels (C, E, G). (B-C) TG Treatment of HEK293T cells stably expressing GPR133 transfected with vector, full-length ESYT1 wild-type or the mutant D724A. Bars represent mean ± SEM of 4 to 7 experiments. (B) TG treatment had no effect on GPR133 surface expression in GPR133 expressing HEK293T cells transfected with vector, ESYT1 or D724A compared to treatment with DMSO (paired t-test, p>0.05). (C) TG treatment significantly increased cAMP levels in GPR133 expressing HEK293T cells transfected with vector and ESYT1 compared to treatment with DMSO (paired t-test, GPR133 + vector: DMSO vs TG, p=0.0210; GPR133 + ESYT1: DMSO vs TG, p=0.0189). TG treatment did not affect GPR133 signaling following transfection of D724A (paired t-test, p>0.05). ns, not significant. (D-E) TG Treatment of HEK293T cells transduced with shSCR or shESYT1 to knockdown ESYT1. Bars represent mean ± SEM of 4 experiments. (D) TG treatment did not affect GPR133 surface expression compared to treatment with DMSO in GPR133 expressing HEK293T cells transduced with shSCR or shESYT (paired t-test, p>0.05). (E) TG treatment significantly increased cAMP concentrations compared to treatment with DMSO in HEK293T cells overexpressing GPR133 and transduced with shSCR (paired t-test, p=0.018). TG treatment had no effect on cAMP levels compared to DMSO following overexpression of GPR133 and knockdown of ESYT1 (paired t-test, p>0.05). ns, not significant. (F-G) TG treatment of HEK293T cells stably expressing GPR133 transfected with ESYT1 deletion mutants ∆C2C, ∆C2E or ∆C2C+E. Bars represent mean ± SEM of 4 to 5 experiments. (F) Treatment with TG had no effect on GPR133 surface expression in GPR133 expressing HEK293T cells transfected with ∆C2C, ∆C2E or ∆C2C+E compared to treatment with DMSO (paired t-test, p>0.05). (G) TG treatment did not affect cAMP concentrations compared to treatment with DMSO in GPR133 expressing HEK293T cells transfected with ∆C2C, ∆C2E or ∆C2C+E (paired t-test, p>0.05). ns, not significant.
Figure 7:
Figure 7:. Intracellular Ca2+ increases disrupt binding of GPR133 and ESYT1.
(A) Confocal images of HEK293T cells transfected with GPR133 alone (green) or co-transfected with GPR133 and Myc-tagged ESYT1 (red). In the co-transfection condition, the majority of transfected cells express both GPR133 and ESYT1 (orange arrowheads). (B) Western blot confirms overexpression of GPR133 and ESYT1 in transfected HEK293T cells. (C) Representative PLA images from in HEK293T cells transfected with GPR133 or co-transfected with GPR133 and ESYT1. The red PLA signal (arrow) is only present in cells co-transfected with GPR133 and ESYT1. The signal is weaker in cells treated with 1 μM TG compared to cells treated with DMSO. (D) Quantification of PLA positive signals (red dots) over DAPI positive cells overexpressing GPR133 and ESYT1. Bars represent mean ± SEM of 3 experiments. The PLA/DAPI ratio is significantly decreased in TG treated cells (paired t-test, p<0.05). (E) Optical sections of GPR133+ESYT1 images from the lower panel in (C), detecting a strong PLA signal in DMSO-treated cells (arrow), but a weaker signal in TG-treated cells.
Figure 8:
Figure 8:. ESYT1 impacts GPR133 signaling and tumorsphere formation in patient-derived GBM cells.
(A, B) GBML109 was transduced with lentivirus for overexpression of GPR133 and shRNA mediated knockdown of ESYT1. (A) Western blot analysis using specific antibodies against ESYT1 (top panel) and GPR133 (bottom panel) confirms expression of ESYT1 in GBML109 transduced with the shSCR control and knockdown of ESYT1 following transduction with shESYT1 in cells overexpressing GPR133 or an empty vector control. (B) Intracellular cAMP levels in GPR133-expressing GBML109 cells are significantly increased following knockdown of ESYT1 compared the control (paired t-test, p<0.05). Bars represent mean ± SEM of 5 experiments. (C) ESYT1 transcript in a publically available GBM single cell RNA-seq (scRNA-seq) database (Single Single Cell Portal of the Broad Institute). (Ci) Identification of cellular populations in GBM specimens using tSNE plots. (Cii) ESYT1 is transcribed in tumor cells, as well as macrophages, T cells and oligodendrocytes in the tumor microenvironment. (D) Kaplan-Meier survival curves from the TCGA GBM dataset as a function of ESYT1 mRNA levels in bulk RNAseq of surgical specimens. Patients in the upper quartile of ESYT1 mRNA levels experience shorter survival (median 329 days) relative to patients in the lower quartile (median 460 days) (logrank Mantel-Cox test, p=0.0413). (E,F) Effects of ESYT1 knockdown by lentiviral transduction of shRNA in GBML154. (E) Western blot analysis confirms KD of ESYT1 in GBML154. (F) Tumorsphere formation is significantly reduced in GBML154 following KD of ESYT1 compared to the control shSCR (paired t-test, p=0.0306). Bars represent mean ± SEM of 3 experiments. (G,H) Tumorsphere formation following the CRISPR/Cas9-mediated KO of ESYT1 in GBML83 and GBML154. (G) Reduced ESYT1 expression, detected by Western blot, following transduction with an ESYT1 specific CRISPR/Cas9 construct compared to the Rosa26 control. (H) Tumorsphere formation is significantly reduced in GBML83 and GBML154 following KO of ESYT1. Overexpression (OE) of ESYT1 in these cells rescues the effect (GBML83: one-way ANOVA F(2,6)=22.32, p=0.0017; Tukey’s post hoc test: Rosa26 vs. ESYT1 KO, p=0.0023; ESYT1 KO vs. ESYT1 KO + ESYT1 OE, p=0.0036; GBML154: one-way ANOVA F(2,6)=10.30, p=0.0115; Tukey’s post hoc test: Rosa26 vs. ESYT1 KO, p=0.0183; ESYT1 KO vs. ESYT1 KO + ESYT1 OE, p=0.0179 ). Bars represent mean ± SEM of 3 experiments. ns, not significant.

References

    1. Aktas T., Avsar Ilik I., Maticzka D., Bhardwaj V., Pessoa Rodrigues C., Mittler G., Manke T., Backofen R., and Akhtar A. (2017). DHX9 suppresses RNA processing defects originating from the Alu invasion of the human genome. Nature 544, 115–119. 10.1038/nature21715. - DOI - PubMed
    1. Arac D., Boucard A.A., Bolliger M.F., Nguyen J., Soltis S.M., Sudhof T.C., and Brunger A.T. (2012). A novel evolutionarily conserved domain of cell-adhesion GPCRs mediates autoproteolysis. EMBO J 31, 1364–1378. 10.1038/emboj.2012.26. - DOI - PMC - PubMed
    1. Barros-Alvarez X., Nwokonko R.M., Vizurraga A., Matzov D., He F., Papasergi-Scott M.M., Robertson M.J., Panova O., Yardeni E.H., Seven A.B., et al. (2022). The tethered peptide activation mechanism of adhesion GPCRs. Nature 604, 757–762. 10.1038/s41586-022-04575-7. - DOI - PMC - PubMed
    1. Bayin N.S., Frenster J.D., Kane J.R., Rubenstein J., Modrek A.S., Baitalmal R., Dolgalev I., Rudzenski K., Scarabottolo L., Crespi D., et al. (2016). GPR133 (ADGRD1), an adhesion G-protein-coupled receptor, is necessary for glioblastoma growth. Oncogenesis 5, e263. 10.1038/oncsis.2016.63. - DOI - PMC - PubMed
    1. Berlin S., Carroll E.C., Newman Z.L., Okada H.O., Quinn C.M., Kallman B., Rockwell N.C., Martin S.S., Lagarias J.C., and Isacoff E.Y. (2015). Photoactivatable genetically encoded calcium indicators for targeted neuronal imaging. Nat Methods 12, 852–858. 10.1038/nmeth.3480. - DOI - PMC - PubMed

Publication types