[Preprint]. 2023 Dec 15:2023.02.11.528119.
doi: 10.1101/2023.02.11.528119.

Somatotopic organization among parallel sensory pathways that promote a grooming sequence in Drosophila

Affiliations

Somatotopic organization among parallel sensory pathways that promote a grooming sequence in Drosophila

Katharina Eichler et al. bioRxiv. .

Update in

Abstract

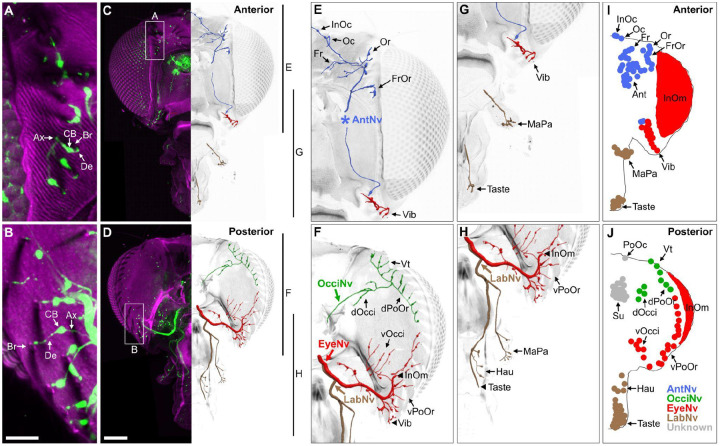
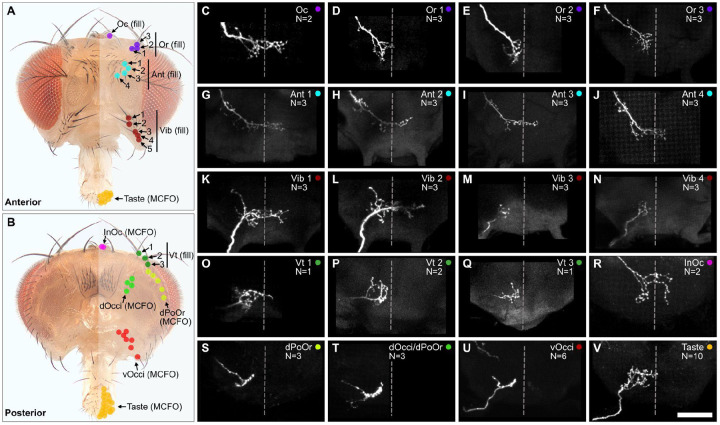
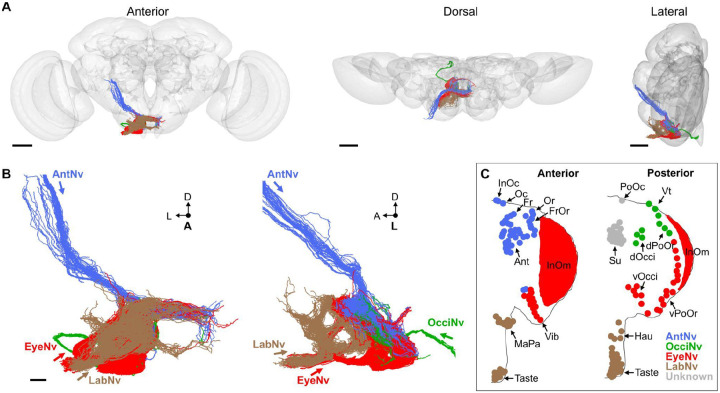
Mechanosensory neurons located across the body surface respond to tactile stimuli and elicit diverse behavioral responses, from relatively simple stimulus location-aimed movements to complex movement sequences. How mechanosensory neurons and their postsynaptic circuits influence such diverse behaviors remains unclear. We previously discovered that Drosophila perform a body location-prioritized grooming sequence when mechanosensory neurons at different locations on the head and body are simultaneously stimulated by dust (Hampel et al., 2017; Seeds et al., 2014). Here, we identify nearly all mechanosensory neurons on the Drosophila head that individually elicit aimed grooming of specific head locations, while collectively eliciting a whole head grooming sequence. Different tracing methods were used to reconstruct the projections of these neurons from different locations on the head to their distinct arborizations in the brain. This provides the first synaptic resolution somatotopic map of a head, and defines the parallel-projecting mechanosensory pathways that elicit head grooming.


Figures

Figure 1.
Figure 1.. Classification and quantification of Drosophila melanogaster head bristles.
(A–D) Bristles on the anterior (A), posterior (B), ventral (C), and dorsal (D) male head. The bristles on the right half are marked with color-coded dots to indicate their classification. Bristle names are abbreviated (Abv.), and full names and color codes are listed in (E). (E) Quantification of bristle populations on the male head (per half). Range indicates the lowest and highest number of bristles counted across individuals for each population (N=8). Bristle number average (Avg.) and standard deviation (SD) across individuals for each population are shown. Bristle counting was facilitated using color-coded depth maps (examples shown in Figure 1 – figure supplement 2). Quantification of bristles on female heads and male/female comparisons are shown in Figure 1 – figure supplement 3. See Supplementary file 1 for bristle counts for each head and Supplementary file 2 for image stack download links for each head. *InOm and Taste bristle number ranges are based on published data while dPoOr, vPoOr, and vOcci bristles were counted using confocal microscopy (see Materials and methods). Bristles are organized into nerve groups based on the nerve each bristle’s corresponding bristle mechanosensory neuron (BMN) projects through to enter the brain (evidence shown in Figure 2). Dorsal (d) and Ventral (v).
Figure 2.
Figure 2.. BMNs on the head project through specific nerves.
(A–D) Confocal Z-stack maximum intensity projections of the anterior (A,C) and posterior (B,D) head in which the driver line R52A06-GAL4 drives expression of GFP in BMNs (green). Cuticle is magenta. (A,B) Magnified views of the boxed areas indicated in C and D. The dendrite (De), axon (Ax), cell body (CB), and innervated bristle (Br) of a BMN are indicated in each panel. (C,D) The left half of the head is shown as a maximum projection, while Z-stack-reconstructed BMNs are shown for the right half. Maximum projections of the right half of the head is shown in Figure 2 – figure supplement 1AF. (E–H) Magnified images of the reconstructions. The magnified areas are indicated by vertical lines on the right in C and D. Reconstructed BMNs are color-coded and labeled according to the nerve that they project through: AntNv (blue); OcciNv (green); EyeNv (red); LabNv (brown). Unreconstructed portion of the antennal nerve is indicated by an asterisk. Innervated bristles are indicated with black arrows. Black arrowheads in F and H indicate partially reconstructed axons of BMNs innervating the InOm, Vib, and Taste bristles. Scale bars: 25 μm (B), 100 μm (D). (I,J) Summary of bristles innervated by BMNs that belong to particular nerve groups on the anterior (I) and posterior (J) head. Nerve groups also listed in Figure 1E. Supplementary file 2 provides confocal Z-stack download links.
Figure 3.
Figure 3.. Head BMNs project into the ventral brain region called the subesophageal zone (SEZ).
(A) Schematic of BMNs projecting from different nerves into the SEZ. (B) Anterior view of the brain immunostained for Bruchpilot (magenta) to visualize the neuropile. White box indicates the SEZ. Scale bar, 100 μm. (C) Image of the SEZ in which R52A06-GAL4 expressed GFP in BMNs and JONs. Brains were immunostained for GFP (green) and Bruchpilot (magenta). BMN nerves and JONs are labeled. Scale bar, 25 μm. (D–G) Driver lines that label BMNs from different nerves. Reconstructed BMNs on half of the head that are labeled by the following driver lines: InOmBMN-LexA (D), dBMN-spGAL4 (E), pBMN-spGAL4 (F), and TasteBMN-spGAL4 (whole proboscis shown) (G). Images of the heads used for each reconstruction are shown in Figure 3 – figure supplement 1AD. Reconstructed neurons are color-coded and labeled as described in Figure 2. (D’-G’) SEZ projections of BMNs from both halves of the head that are labeled by InOmBMN-LexA (D’), dBMN-spGAL4 (E’), pBMN-spGAL4 (F’), and TasteBMN-spGAL4 (G’). (H) Table of BMNs innervating specific bristles that are labeled by each driver line, indicated by box shading (numbers of labeled BMNs innervating different bristles shown in Figure 3 – figure supplement 1E). Shade color indicates the nerve that each BMN projects through. (I) Driver line names and identifiers. (J) Shown in the upper right corner of the figure are the aligned expression patterns of InOmBMN-LexA (red), dBMN-spGAL4 (green), and TasteBMN-spGAL4 (brown). Supplementary file 2 provides confocal Z-stack download links.
Figure 4.
Figure 4.. Projections of BMNs that innervate specific head bristles.
(A,B) Bristles on the anterior (A) and posterior (B) head whose associated BMNs were labeled using dye fill (C–Q, fill) or multicolor flipout (R–V, MCFO) techniques. (C–V) SEZ projections of individual BMNs that innervate the bristle indicated in the upper right corner (anterior view). BMNs are oriented as if they are projecting from the right side of the head. Dotted line indicates approximate SEZ midline. Scale bar, 50 μm. (C–Q) BMNs labeled by dye filling. Schematic of the filling technique and whole brain examples shown in Figure 4 – figure supplement 1. Filled BMNs innervate the Oc (C), Or (D–F), Ant (G–J), Vib (K–N), and Vt (O–Q) bristles. All fill trials for the different bristles are shown in Figure 4 – figure supplement 2, Figure 4 – figure supplement 3, Figure 4 – figure supplement 4, and Figure 4 – figure supplement 5. (R–V) MCFO-labeled BMNs innervate the InOc (R), dPoOr (S), dOcci/dPoOr (T), vOcci (U), and Taste (V) bristles. BMNs were MCFO labeled using the following driver lines: dBMN-spGAL4 (R,S), pBMN-spGAL4 (T,U), and TasteBMN-spGAL4 (V). All MCFO trials for the different bristles are shown in Figure 4 – figure supplement 6, Figure 4 – figure supplement 7, and Figure 4 – figure supplement 8. The number (N) of fill or MCFO trials obtained for each BMN is indicated in the upper right corner. Supplementary file 2 provides confocal Z-stack download links.
Figure 5.
Figure 5.. Electron microscopy-based reconstruction of head BMNs.
(A) All reconstructed BMNs projecting into the brain from the left side of the head (anterior, dorsal, and lateral views shown). BMN colors correspond to the nerves that they project through, including the AntNv (blue), EyeNv (red), OcciNv (green), and LabNv (brown). Scale bars, 50 μm. (B) Zoomed anterior (left) and lateral (right) views of the BMNs in the SEZ. Labeled arrows for each incoming nerve indicate BMN projection direction. Scale bars, 10 μm. (C) Bristles on the anterior (left) and posterior (right) head that are innervated by BMNs in the nerve groups indicated by their color. Figure 5 – figure supplement 1 summarizes the EM reconstruction strategy. Sensory neurons that could not be assigned an identity are shown in Figure 5 – figure supplement 2.
Figure 6.
Figure 6.. BMN types that innervate specific head bristles.
(A–B) Examples of matching light microscopy (LM) imaged BMN projections with their corresponding EM reconstructed BMNs, including BM-InOc neurons (A) and BM-InOm neurons (B). Top panels show representative LM images of labeled BMNs that innervate the bristle indicated in the top right corner (anterior SEZ views as shown in Figure 4). The individual BM-InOc neuron was labeled by dye filling using DiD while the collective projections of the BM-InOm neurons were labeled using the driver line InOmBMN-LexA expressing GFP. Bottom panels show the EM-reconstructed BMN types indicated in the top right corner. Shown is a representative example of a BM-InOc neuron (A) and all reconstructed BM-InOm neurons (B). Scale bar, 50 μm. Examples for all LM and EM matched BMNs are shown in Figure 6 – figure supplement 2. Additional evidence used for assigning the different BMN types is shown in Figure 6 – figure supplement 1, Figure 6 – figure supplement 3, and Figure 6 – figure supplement 4. (C–D) Different bristle populations indicated by labeled and colored dots are innervated by BMNs shown in E–T. The anterior (C) and posterior (D) head are shown. (E–T) Reconstructed SEZ projections of BMN types that are labeled and plotted in colors indicating the bristles that they innervate. Shown are the dorsal views of all BMNs (E), BM-InOc (F), BM-Oc (G), BM-Fr (H), BM-Ant (I), BM-Or (J), BM-FrOr (K), BM-InOm (L), BM-Vib (M), BM-MaPa (N), BM-Taste (O), BM-Hau (P), BM-Vt/PoOc (Q), BM-dOcci (R), BM-dPoOr (S), and BM-vOcci/vPoOr (T) neurons. The number of reconstructed BMNs for each type is indicated.
Figure 7.
Figure 7.. Some head BMNs have projections that cross the midline to the contralateral brain hemisphere.
(A–B) BMNs that remain in the ipsilateral brain hemisphere (A) versus those with midline-crossing projections (B), shaded by percent midline-crossing for each type (scale in C). Red dashed line indicates the brain midline. (C,D) Shaded dots on the anterior (C) and posterior (D) head indicate the percent of BMNs innervating each bristle population that are midline-crossing. (E) Bar plots of midline crossing percentages (numbers of midline-crossing BMNs indicated).
Figure 8.
Figure 8.. Somatotopy-based postsynaptic connectivity similarity among BMN types.
(A) Dendrogram of cosine similarity clustering of BMNs by postsynaptic connectivity similarity. Analysis excludes postsynaptic partners with fewer than 6 synapses, and the BMN/BMN connections shown in Figure 8 – figure supplement 1. Individual BMNs are shown as bars and their types correspond to the colors indicated in B (bottom right). The five clusters are from cut height 4.5 on the dendrogram (dotted line) derived from the comparisons shown in Figure 8 – figure supplement 2. (B) Morphologies of BMNs in the indicated clusters (upper right) whose types correspond to the colors shown in the bottom right. (C) Spatial relationships among the clustered BMNs are shown by coloring their bristles (dots) by cluster number on the anterior and posterior head. BMN types in more than one cluster are colored accordingly if at least 20% of that type was in a given cluster (e.g. BM-Taste neurons are in clusters 3 (37%, brown) and 4 (63%, orange)). Note: the positioning of the colored dots indicating different clusters for Taste and vOcci/vPoOr bristles is hypothesized based on their proximity to other BMNs in the same cluster. The clusters exemplify different levels of connectivity similarity shown by the dendrogram (A). BMNs showing the highest connectivity similarity innervate the same bristle populations, as exemplified by BM-Vib (Cluster 1) and BM-Taste (Cluster 4) neurons. BMNs that innervate neighboring bristle populations also show high connectivity similarity, including BMNs on the dorsal (Cluster 2), ventral (Cluster 3), and posterior head (Cluster 5). Note: Cluster 5 consists mostly of posterior head BMNs, but also BM-Ant and -Fr neurons on the anterior head, although these BMNs show relatively low cosine similarity with the posterior head BMNs. BM-InOm neurons were analyzed separately (Figure 8 – figure supplement 3). (D–F) Summary of BMN somatotopic features. (D) Different BMN types innervate bristles at neighboring and distant proximities. (E,F) BMNs that innervate neighboring bristles project into overlapping zones (E, example of EM reconstructed BM-Fr and -Ant neuron SEZ projections with non-overlapping -MaPa neuron projections) and can show postsynaptic connectivity similarity (F, edge widths based on number of total synapses from a given BMN type to its major postsynaptic partners, edges under 5% of BMN output omitted). Labeled arrows for each BMN type shown in E indicate projection direction.
Figure 9.
Figure 9.. Optogenetic activation of BMNs at specific head locations elicits aimed grooming.
(A) Bristles shaded black on the anterior (left) and posterior (right) head are innervated by BMNs that express CsChrimson under control of the indicated driver lines. Control-spGAL4 shows no expression. (B) Histograms of manually annotated video for each line show movements elicited with red-light induced optogenetic activation. The fraction of flies performing each movement are plotted in one second bins (N = 10 flies per line). Grooming movements are indicated by different colors, including eye (magenta), dorsal head (blue), and ventral head (orange) grooming. Other elicited movements include backward motion (black) and head nodding (gray). Gray bars indicate a 5 second red-light stimulus. Most driver lines were tested using 30 second interstimulus intervals, while pBMN-spGAL4 elicited more reliable behavior using 10 second intervals. Movements are mutually exclusive except head nodding. Representative experimental trials shown in Video 1, Video 2, Video 3, Video 4, and Video 5. Figure 9 – figure supplement 1 shows additional controls and ethograms for individual flies tested. (C) Box plots show the percent time that flies spent performing each movement during the experiment shown in B. Bottom and top of the boxes indicate the first and third quartiles, respectively; median is shown in each box; whiskers show the minimum and maximum values. Asterisks indicate *p,0.05, **p,0.001, ***p,0.0001 from Mann-Whitney U pairwise tests between each experimental line and its corresponding control after application of Bonferroni correction. Figure 9 – source data 1 contains numerical data used for producing each box plot.

Similar articles

References

    1. Abraira VE, Ginty DD. 2013. The sensory neurons of touch. Neuron 79:618–639. doi:10.1016/j.neuron.2013.07.051 - DOI - PMC - PubMed
    1. Adibi M. 2019. Whisker-Mediated Touch System in Rodents: From Neuron to Behavior. Frontiers Syst Neurosci 13:40. doi:10.3389/fnsys.2019.00040 - DOI - PMC - PubMed
    1. Averbeck BB, Chafee MV, Crowe DA, Georgopoulos AP. 2002. Parallel processing of serial movements in prefrontal cortex. Proceedings of the National Academy of Sciences 99:13172–13177. doi:10.1073/pnas.162485599 - DOI - PMC - PubMed
    1. Bates AS, Manton JD, Jagannathan SR, Costa M, Schlegel P, Rohlfing T, Jefferis GS. 2020. The natverse, a versatile toolbox for combining and analysing neuroanatomical data. Elife 9:e53350. doi:10.7554/elife.53350 - DOI - PMC - PubMed
    1. Berkowitz A, Laurent G. 1996. Central generation of grooming motor patterns and interlimb coordination in locusts. The Journal of Neuroscience 16:8079–8091. - PMC - PubMed

Publication types