. 2023 Jan 18;26(2):106005.
doi: 10.1016/j.isci.2023.106005. eCollection 2023 Feb 17.

ARMS-NF-κB signaling regulates intracellular ROS to induce autophagy-associated cell death upon oxidative stress

Affiliations

ARMS-NF-κB signaling regulates intracellular ROS to induce autophagy-associated cell death upon oxidative stress

Yi-Hua Liao et al. iScience. .

Abstract

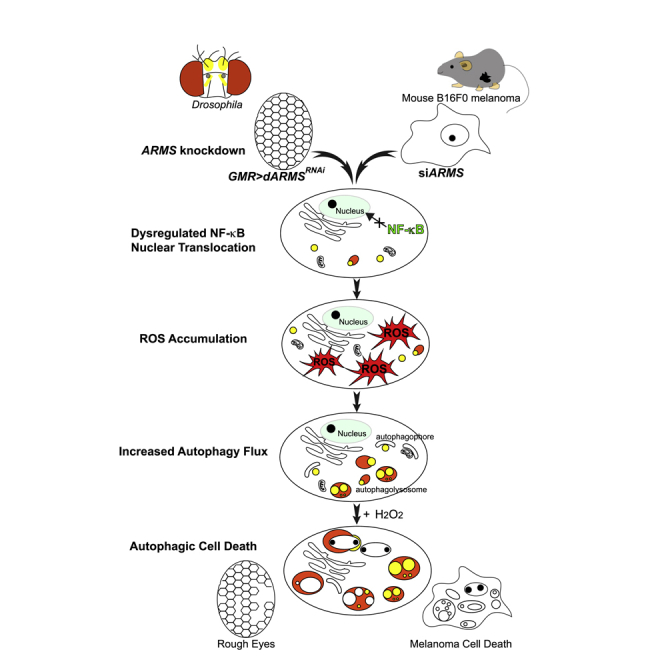
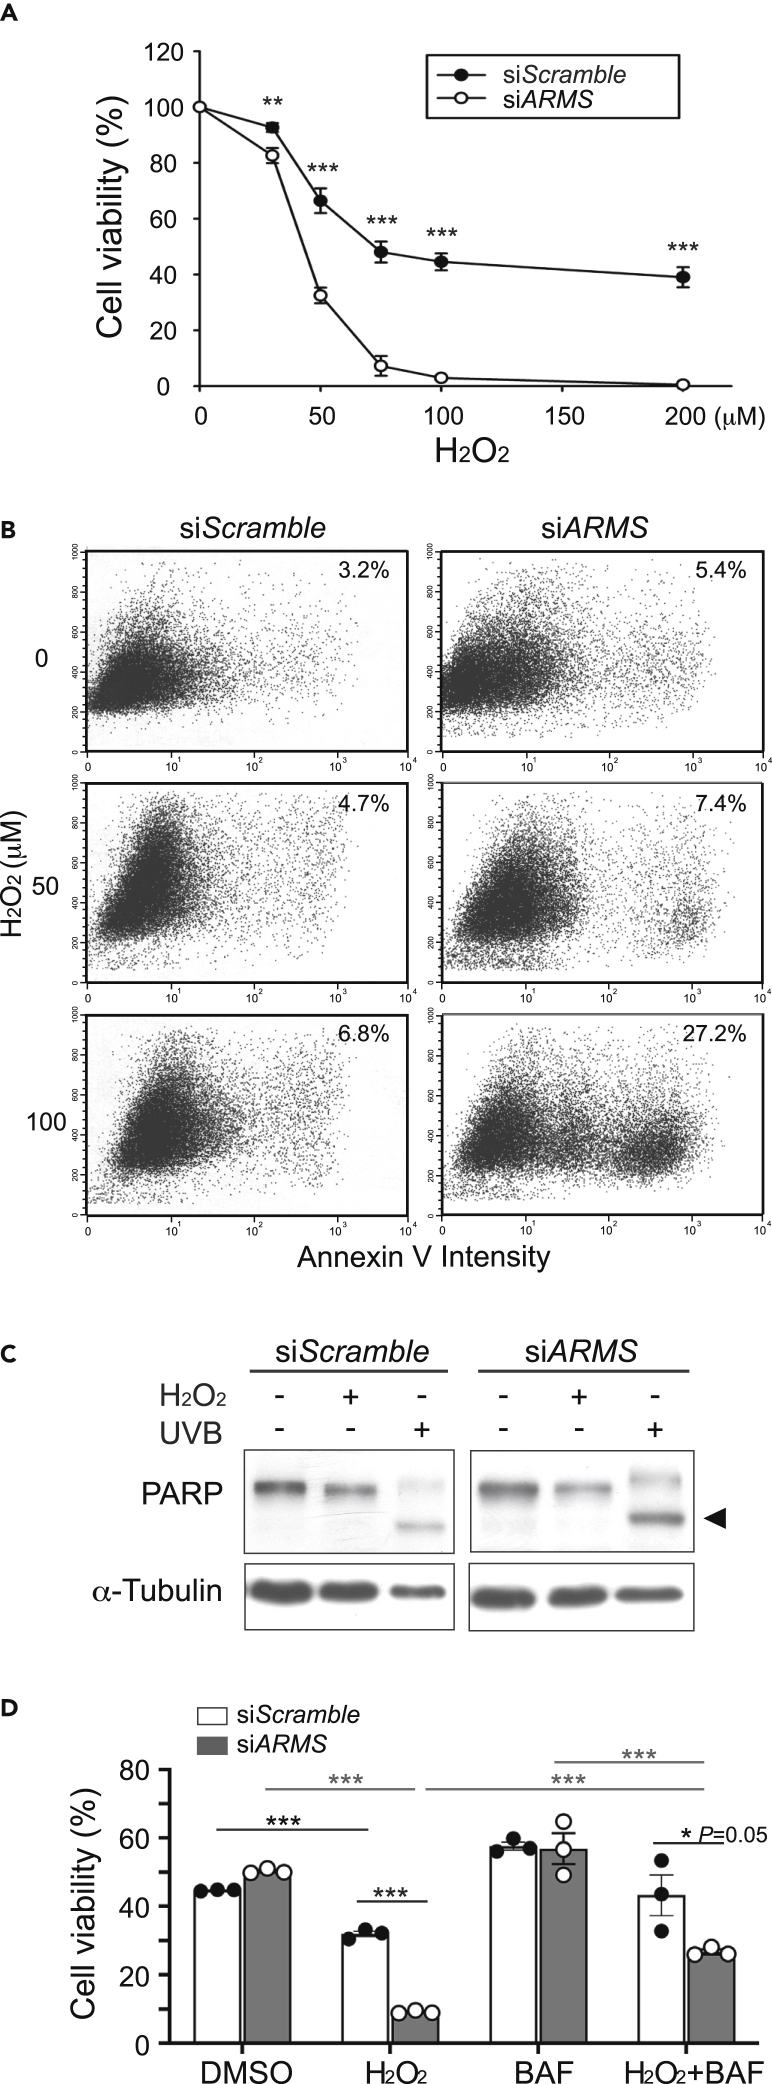
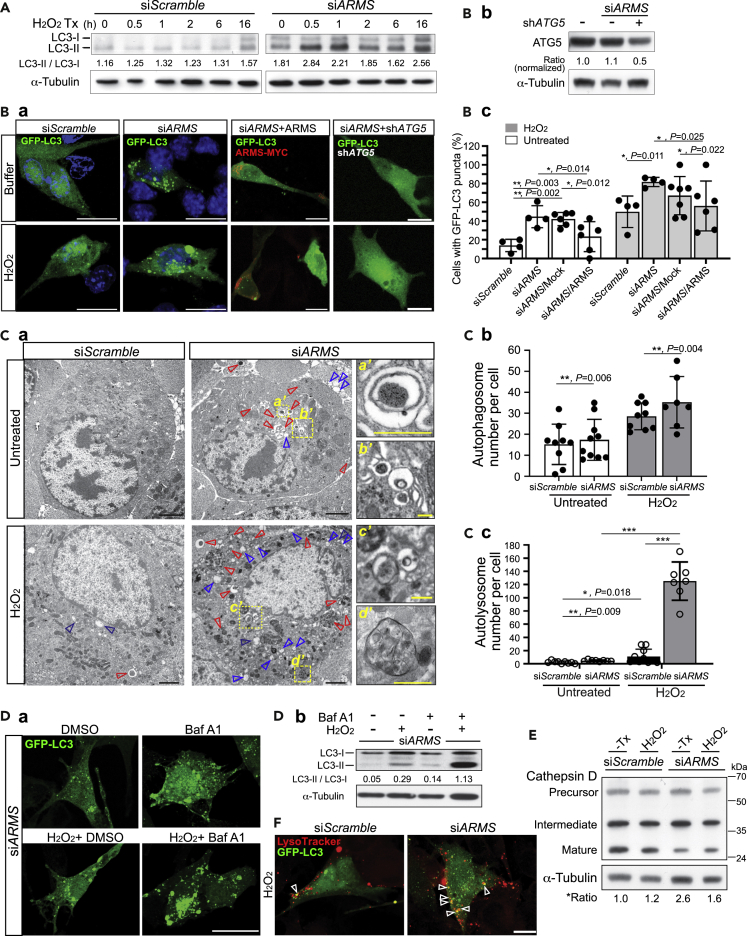
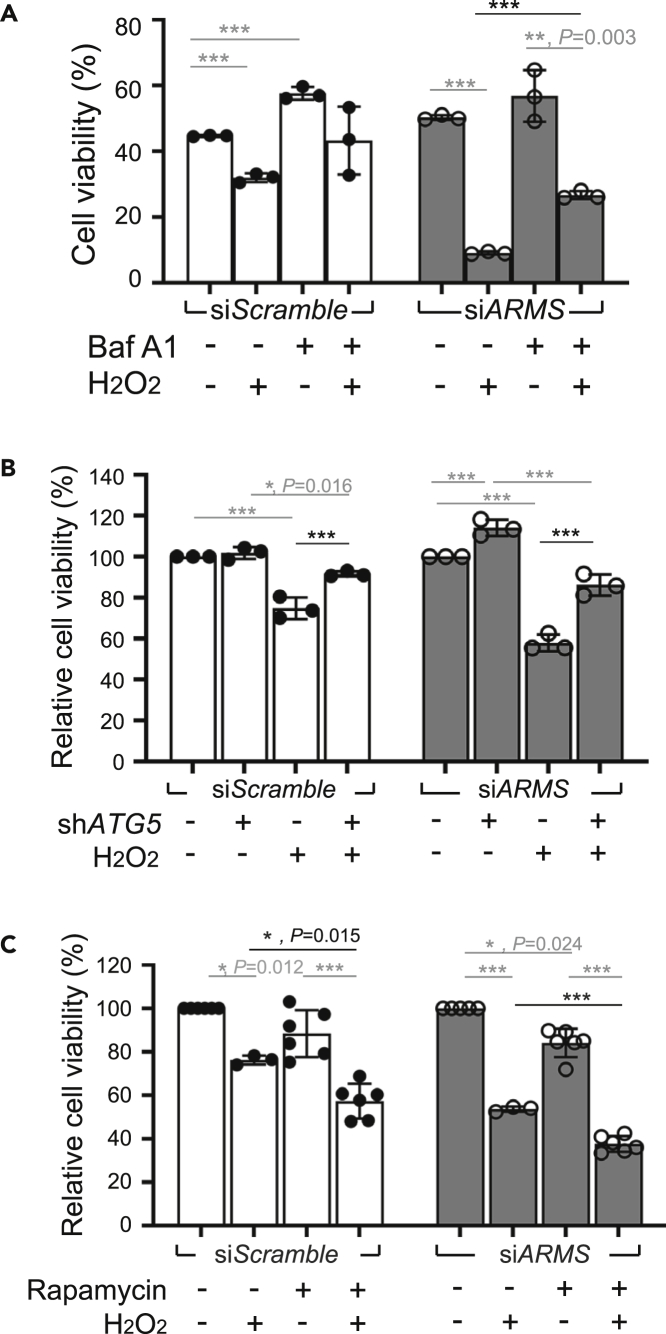
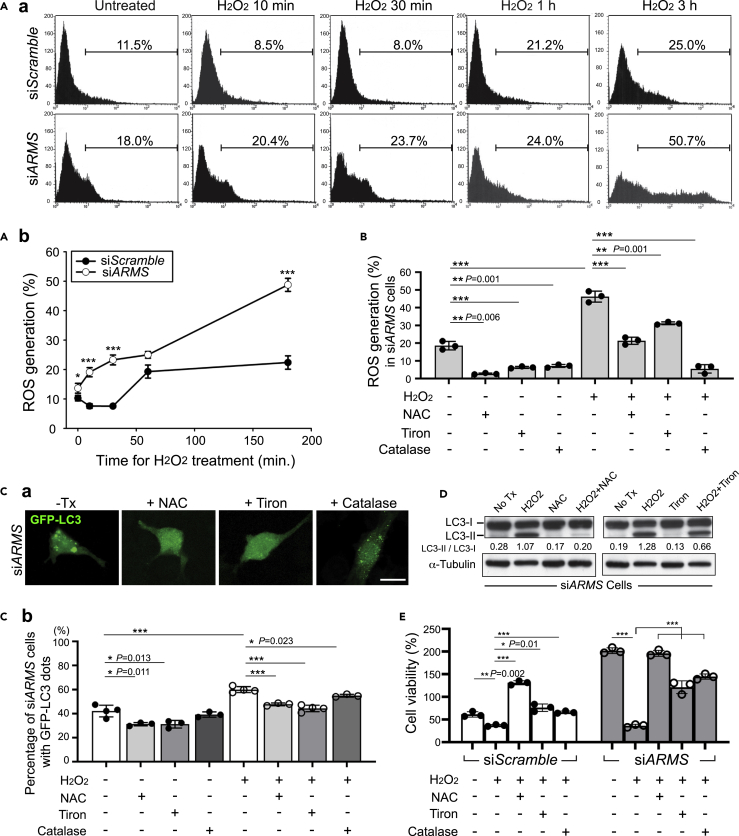
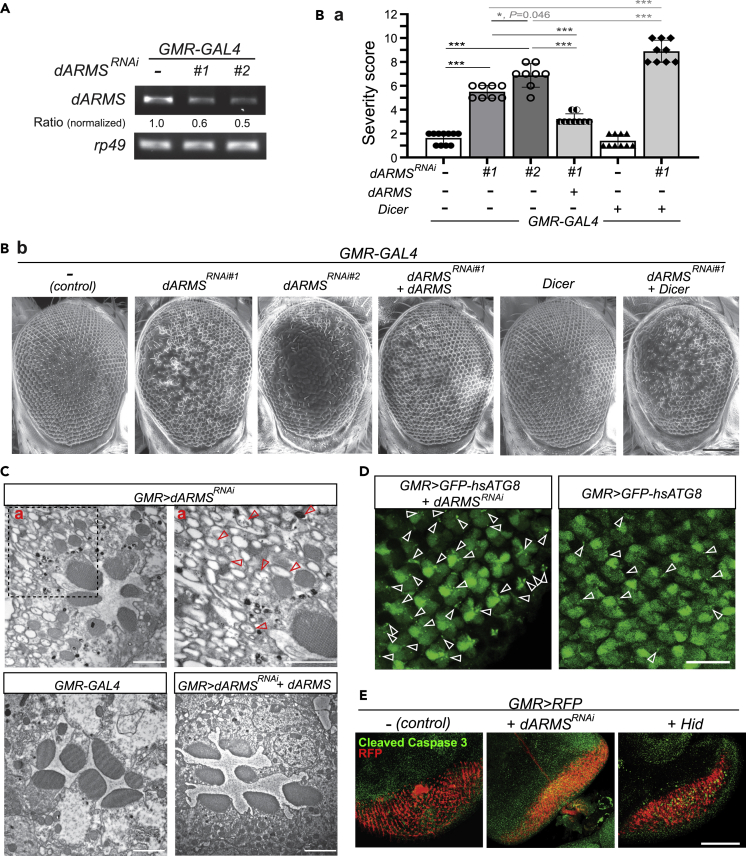
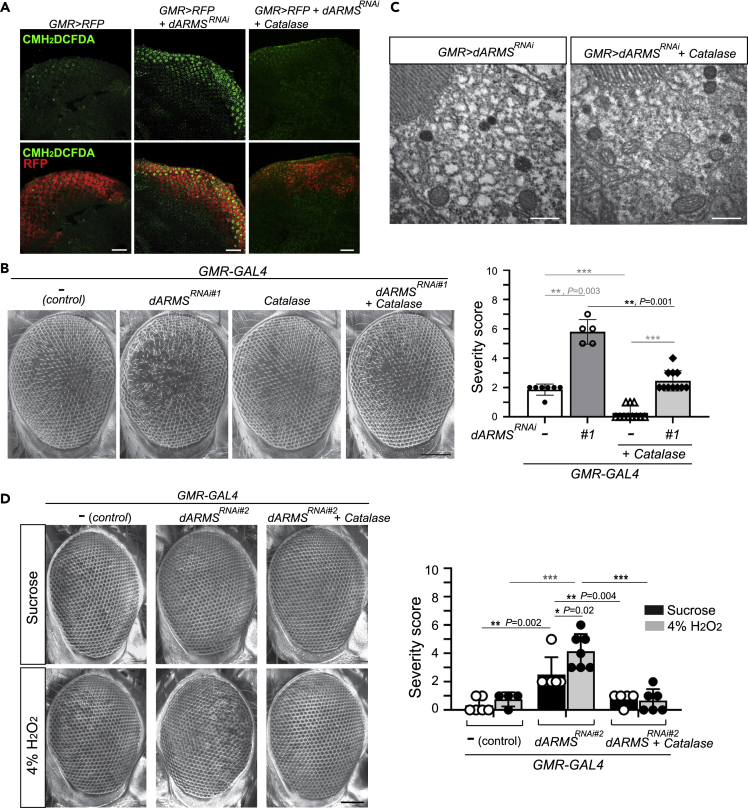
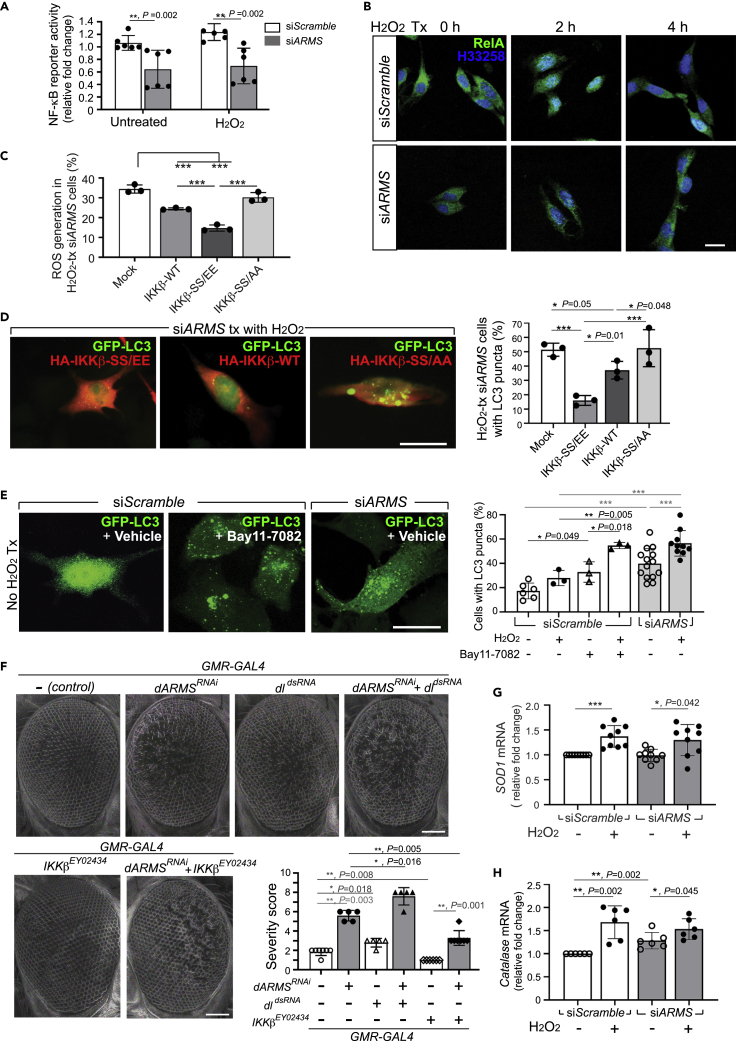
Ankyrin repeat-rich membrane spanning (ARMS) plays roles in neural development, neuropathies, and tumor formation. Such pleiotropic function of ARMS is often attributed to diverse ARMS-interacting molecules in different cell context. However, it might be achieved by ARMS' effect on global biological mediator like reactive oxygen species (ROS). We established ARMS-knockdown in melanoma cells (siARMS) and in Drosophila eyes (GMR>dARMS RNAi ) and challenged them with H2O2. Decreased ARMS in both systems compromises nuclear translocation of NF-κB and induces ROS, which in turn augments autophagy flux and confers susceptibility to H2O2-triggered autophagic cell death. Resuming NF-κB activity or reducing ROS by antioxidants in siARMS cells and GMR>dARMS RNAi fly decreases intracellular peroxides level concurrent with reduced autophagy and attenuated cell death. Conversely, blocking NF-κB activity in wild-type flies/melanoma enhances ROS and induces autophagy with cell death. We thus uncover intracellular ROS modulated by ARMS-NFκB signaling primes autophagy for autophagic cell death upon oxidative stress.

Keywords: Biological sciences; Cell biology; Molecular biology.


Conflict of interest statement

We report no potential conflict of interest.

Figures

None
Graphical abstract
Figure 1
Figure 1
Non-apoptotic cell death induced by H2O2 in melanoma cells is augmented by ARMS-knockdown (A) Dose-dependent effect of H2O2 on cell viability attenuated by ARMS silencing as revealed by MTT assay. The siScramble and siARMS B16-F0 melanoma cells were treated with the indicated concentration of H2O2 for 16 h. Data is represented as mean ± SD in triplicate experiments. ∗∗, p < 0.01; ∗∗∗, p < 0.001, Student’s t test. (B) Apoptotic cell death assessed by flow cytometry with Annexin V staining of cells treated with 0, 50, or 100 μM H2O2, respectively, for 16 h. (C) Western blot for PARP cleavage in cell lysates treated with UVB (25 mJ/cm2) or 50 μM H2O2. Arrowhead, p85 cleaved form of PARP. (D) Effect of pan-caspases inhibitor BAF on H2O2-induced cell death. Bar with dot graph shows mean ± SD in triplicate experiments, of which more than 200 cells were counted for each group. Cells were pretreated with 50 μM BAF for 30 min followed by 50 μM H2O2 for another 16 h. ∗∗∗, p < 0.001, Student’s t test.
Figure 2
Figure 2
ARMS silencing leads to accumulation of autophagic vesicles and enhances H2O2-induced autophagy in melanoma cells (A) Representative immunoblot and quantification of the relative LC3-II/LC3-I ratio during the time course of H2O2 treatment performed in siScramble and siARMS melanoma cells, respectively. (B-a) Epifluorescence microscopy of H2O2-induced GFP-LC3 translocation (from diffuse cytoplasmic to granular punctate pattern) in GFP-LC3-transfected siScramble, siARMS, and siARMS cells co-transfected with RNAi-resistant ARMS, or with shATG5, respectively. Scale bar, 20 μm. (B-b) Western blot to show the efficacy of ATG5-knockdown in siARMS cells infected by lentiviral-shATG5 and treated with 50 μM H2O2 for 16 h. (B-c) Bar graph (mean ± SD) combined with dot plot to show the percentage of cells having GFP-LC3 translocation in siARMS cells compared with siScramble cells at baseline and after 16-h treatment of H2O2. The value of each dot was derived from the counting of 100–110 cells. ∗, p < 0.05; ∗∗, p < 0.01, Mann-Whitney rank-sum test. (C-a) Transmission electron microscopy of the siScramble and siARMS cells before and after treatment with 50 μM H2O2 for 16 h. The autophagic vacuoles seen in siARMS cells (dashed insets in a’, b’) were magnified. Red empty arrowheads, double-membrane or multi-membrane autophagosomes; Blue empty arrowheads, single-membrane autolysosomes with residual digested material. Black scale bar, 2 μm; Yellow scale bar, 500 nm. Quantification analysis of autophagosomes (C-b) and autolysosomes (C-c) derived from transmission electron microscopy in siARMS cells compared with siScramble cells at baseline and after 16-h treatment of H2O2. ∗∗, p < 0.01; ∗∗∗, p < 0.001, Mann-Whitney rank-sum test. (D) Effect of Bafilomycin A1 (Baf A1) treatment on the level of autophagosome formation in siARMS cells as revealed by immunofluorescence study of intracellular GFP-LC3 dots (D-a) and immunoblotting of LC3-II (D-b). The cells were pretreated with 10 nM Baf A1 or buffer 1 h before H2O2 treatment. Scale bar, 20 μm. See also Figure S1A. (E) Representative Western blotting of the processed forms of Cathepsin D in siScramble and siARMS cells with or without H2O2 treatment. ∗, the ratio of intermediate (46 kDa) plus precursor form (54 kDa) to mature form (32 kDa) of Cathepsin D. (F) Co-localization and fusion (yellow fluorescence indicated by white empty arrowheads) of GFP-LC3-positive autophagic vesicles with the lysosomes (labeled by LysoTracker red) in H2O2-treated siARMS cells. Scale bar, 10 μm.
Figure 3
Figure 3
H2O2-induced cell death in melanoma cells is associated with autophagy Effect of autophagy inhibition by bafilomycin A1 (Baf A1, 10 nM) (A) or by ATG5-knockdown (B), or of enhanced autophagy by pretreatment with rapamycin (50 nM) (C) on cell survival of siScramble and siARMS cells treated with H2O2. Bar graphs show mean ± SD in at least three independent MTT assays (P.S. The exact experimental number is indicated by dots). The values in (B) and (C) were normalized with those derived from untreated cells of the same genomic background (The viability of untreated cells was set as 100% for each genotype as the reference point.). ∗, p < 0.05; ∗∗, p < 0.01; ∗∗∗, p < 0.001, Welch’s t-test for (A), Kruskal-Wallis one-way analysis of variants on ranks for (B), and One-way ANOVA with Hokm-Sidak test for (C).
Figure 4
Figure 4
ARMS-knockdown primes ROS accumulation to induce autophagy and autophagic cell death triggered by H2O2 (A) ARMS-knockdown results in intracellular ROS accumulation. Intracellular ROS was determined by flow cytometry with CM-H2DCFDA staining at baseline and after H2O2 treatment for 10 min, 30 min, 1 h, and 3 h, respectively. ROS accumulation along the time course of H2O2 is shown representatively in histogram (A-a) and in the diagram (A-b) showing mean ± SD in triplicate experiments. ∗, p < 0.05; ∗∗∗, p < 0.001, Student’s t test. (B) Addition of antioxidants N-acetyl cysteine (NAC, 1 μM), tiron (2 μM), or PEG-catalase (1000 IU) for 1 h attenuated intracellular ROS formation in siARMS cells. ∗∗, p < 0.01; ∗∗∗, p < 0.001, Student’s t test. See also Figure S1E. (C) Representative confocal microscopy (C-a) and quantification (C-b) of GFP-LC3 dots in siARMS cells pretreated with NAC, tiron, or PEG-catalase. Bar with dot graph shows mean ± SD in triplicate experiments. ∗, p < 0.05; ∗∗∗, p < 0.001, One Way ANOVA with Holm-Sidak method. Scale bar, 20 μm. (D) Immunoblot and quantification of the relative LC3-II/LC3-I ratio in lysates derived from H2O2-treated siARMS cells pre-incubated with NAC or tiron. (E) Cell viability assessed by MTT assay in siScramble and siARMS cells pretreated with antioxidants (NAC, tiron, or PEG-catalase, respectively). Bar with dot graph shows mean ± SD in triplicate experiments. ∗, p < 0.05; ∗∗∗, p < 0.001, One Way ANOVA with Holm-Sidak method.
Figure 5
Figure 5
dARMS-knockdown in Drosophila eyes causes retinal degeneration associated with robust autophagy in adult fly (A) Effective RNAi of dARMS by ARMS-dsRNA shown by semi-quantitative RT-PCR analysis of dARMS transcript extracted from adult Drosophila compound eyes. Rp49 was used as an internal loading control. (B-a) Representative scanning electron microscopy (SEM) images of 1-day-old fly eyes of the indicated genotypes reared at 27°C. Scale bar, 100 μm. (B-b) Quantitative analyses of the rough eye phenotype by objective scoring of the SEM images (Pandey et al., 2007). Data are presented as mean ± SD ∗, p < 0.05; ∗∗∗, p < 0.001, One-way ANOVA with Duncan’s method. (C) Representative transmission electron micrographs of GMR>dARMSRNAi fly eyes, in comparison with the control wild-type GMR-GAL4 and with the GMR>dARMSRNAi, dARMS flies. Higher magnification of the dashed inset (C-a) demonstrated the double-membrane autophagic vesicles (red empty arrowheads) in GMR>dARMSRNAi fly eyes. Scale bar, 2 μm. See also Figure S2D. (D) Distribution of GFP-hsATG8-positive dots (white empty arrowheads) in eye imaginal discs from the third-instar larvae by confocal microscopy. Scale bar, 25 μm. (E) Representative fluorescence micrographs of eye imaginal discs from the third-instar larvae labeled by transgenic RFP (GMR>RFP) and co-stained with antibodies against cleaved Caspase 3. Scale bar, 100 μm.
Figure 6
Figure 6
Increased ROS causally associates with autophagic death of photoreceptor cells in GMR>dARMSRNAi adult flies (A) Representative fluorescence micrographs of ROS production (labeled by green fluorescent dye CM-H2DCFDA) in the eye imaginal discs (labeled by transgenic RFP fluorescence) from the third-instar larvae. Scale bar, 50 μm. (B) SEM images of 1-day-old fly eyes of the indicated genotypes reared at 27°C. Scale bar, 100 μm. Quantitative analysis of the rough eye phenotype by objective scoring of the SEM images of the indicated genotype. Data are shown as mean ± SD; ∗∗, p < 0.01; ∗∗∗, p < 0.001, Mann-Whitney rank-sum test. (C) Transmission electron microscopy to show that overexpression of Catalase in dARMSRNAi flies (GMR>dARMSRNAi, Catalase) decreased autophagic vacuoles caused by dARMS-knockdown. Scale bar, 500 nm. (D) 1-day-old flies were kept in vials with filter paper soaked with 4% H2O2 dissolved in 5% sucrose solution or in 5% sucrose solution alone (without H2O2) for 48 h. Representative scanning electron microscope images of fly eyes (Left) and the scoring of rough eye phenotype (Right) showed increased severity of rough eyes in H2O2-treated flies with dARMS-knockdown (GMR>dARMSRNAi), which could be partially rescued by overexpressing Catalase (GMR>dARMSRNAi, Catalse). Scale bar, 100 μm ∗, p < 0.05; ∗∗, p < 0.01; ∗∗∗, p < 0.001; Mann-Whitney rank-sum test.
Figure 7
Figure 7
Compromised NF-κB activation resulting from ARMS-knockdown underlies intracellular ROS and ROS-induced autophagy (A) Basal and H2O2-stimulated transcriptional activity of NF-κB in siARMS cells compared with the siScramble. Cells were co-transfected with the NF-κB luciferase reporter and the CMV-β-gal plasmids. 48 h post-transfection, the cells were left untreated or treated with H2O2 for another 2 h. Relative luciferase activities were calculated based on β-gal values in each transfection. The value for luciferase activity in untreated siScramble cells was designated as 1. (B) Fluorescence microscopy to show nuclear translocation of RelA in siScramble but not in siARMS cells 2 h after H2O2 treatment. Scale bar, 20 μm. (C) Bar graph shows intracellular ROS determined by flow cytometry with CM-H2DCFDA staining in H2O2-treated siARMS cells co-transfected with HA-tagged mock vector, wild-type IKKβ (IKKβ-WT), constitutively active IKKβ (IKKβ-SS/EE), or constitutively inactive IKKβ (IKKβ-SS/AA), respectively. (D) Representative fluorescence microscopy images (left panels) and quantification analysis to show GFP-LC3 translocation in H2O2-treated siARMS cells co-transfected with the indicated plasmid. Scale bar, 20 μm. (E) Confocal microscopy and quantification analysis of GFP-LC3 puncta showed that inactivation of NF-κB by Bay 11–7082 in siScramble cells increased basal and H2O2-induced autophagy to the level comparable with siARMS cells. Scale bar, 20 μm. (F) SEM images of 1-day-old fly eyes of the indicated genotypes reared at 27°C with scores of the rough eye phenotype. Scale bar, 100 μm. (G and H) Quantitative RT-PCR analyses of SOD1 (G) and Catalase (H) transcripts in H2O2-treated siARMS cells compared with siScramble cells. Data information: all values are shown as mean ± SD ∗, p < 0.05; ∗∗, p < 0.01; ∗∗∗, p < 0.001; p values on the basis of Mann-Whitney rank-sum test (A, F, G, and H), or of One Way ANOVA with Duncan’s multiple range test (C, D, and E).

Similar articles

Cited by

References

    1. Iglesias T., Cabrera-Poch N., Mitchell M.P., Naven T.J., Rozengurt E., Schiavo G. Identification and cloning of Kidins220, a novel neuronal substrate of protein kinase D. J. Biol. Chem. 2000;275:40048–40056. doi: 10.1074/jbc.M005261200. - DOI - PubMed
    1. Kong H., Boulter J., Weber J.L., Lai C., Chao M.V. An evolutionarily conserved transmembrane protein that is a novel downstream target of neurotrophin and ephrin receptors. J. Neurosci. 2001;21:176–185. doi: 10.1523/jneurosci.21-01-00176.2001. - DOI - PMC - PubMed
    1. Raza M.Z., Allegrini S., Dumontet C., Jordheim L.P. Functions of the multi-interacting protein KIDINS220/ARMS in cancer and other pathologies. Genes Chromosomes Cancer. 2018;57:114–122. doi: 10.1002/gcc.22514. - DOI - PubMed
    1. Arévalo J.C., Yano H., Teng K.K., Chao M.V. A unique pathway for sustained neurotrophin signaling through an ankyrin-rich membrane-spanning protein. EMBO J. 2004;23:2358–2368. doi: 10.1038/sj.emboj.76002535. - DOI - PMC - PubMed
    1. Wu S.H., Arévalo J.C., Sarti F., Tessarollo L., Gan W.B., Chao M.V. Ankyrin Repeat-rich Membrane Spanning/Kidins220 protein regulates dendritic branching and spine stability in vivo. Dev. Neurobiol. 2009;69:547–557. doi: 10.1002/dneu.20723. - DOI - PMC - PubMed

LinkOut - more resources