. 2023 Jan 16;26(2):105996.
doi: 10.1016/j.isci.2023.105996. eCollection 2023 Feb 17.

A Kmer-based paired-end read de novo assembler and genotyper for canine MHC class I genotyping

Affiliations

A Kmer-based paired-end read de novo assembler and genotyper for canine MHC class I genotyping

Yuan Feng et al. iScience. .

Abstract

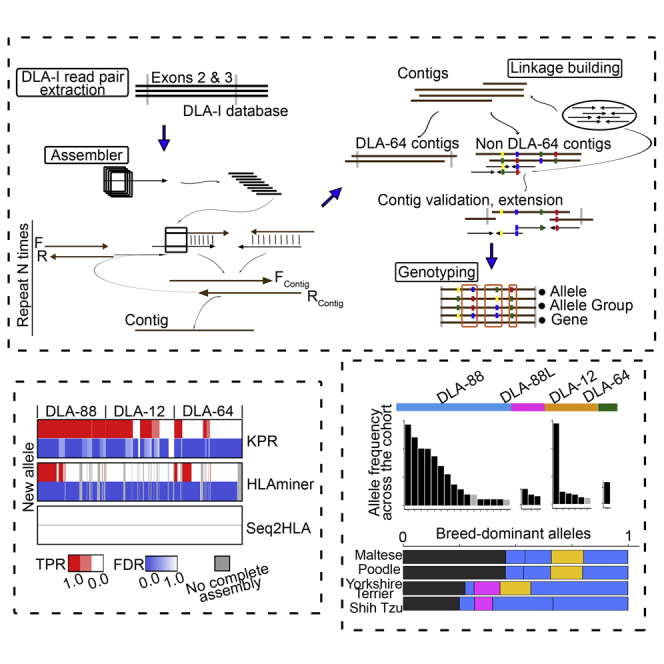
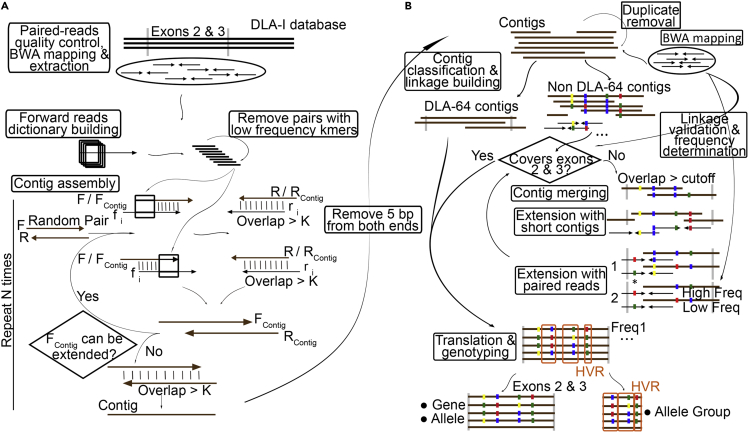
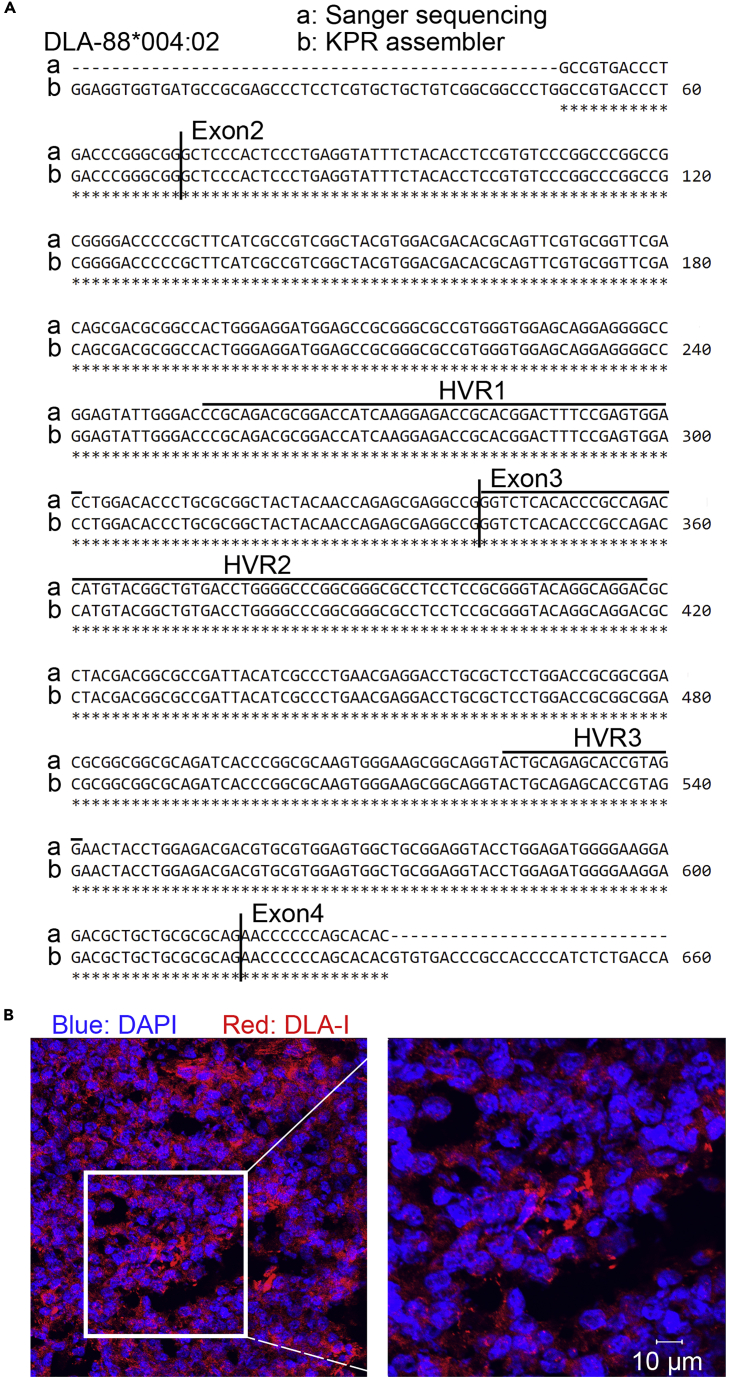
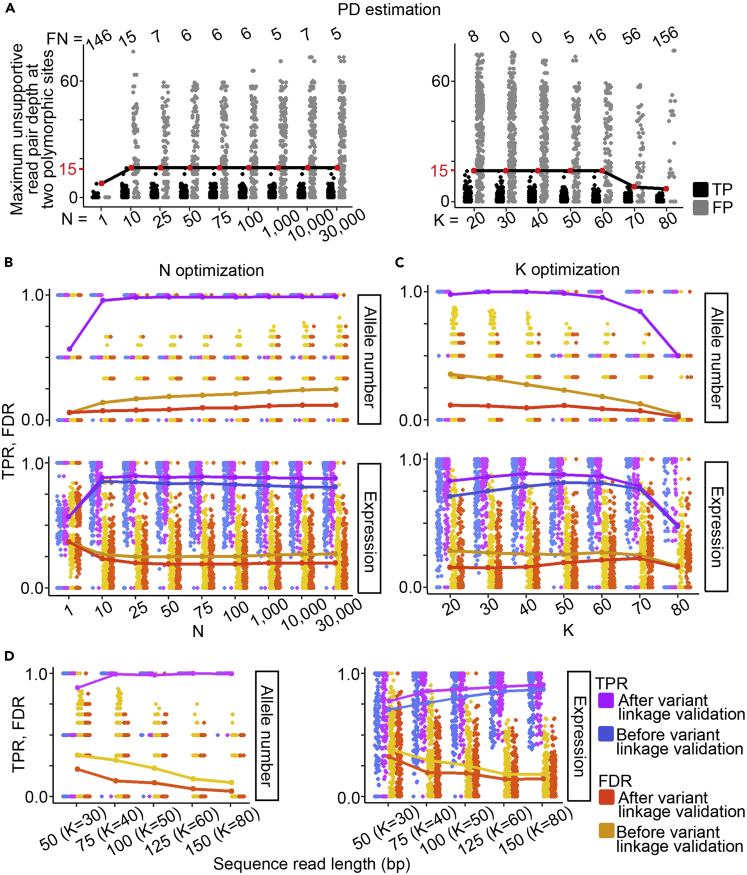
The major histocompatibility complex class I (MHC-I) genes are highly polymorphic. MHC-I genotyping is required for determining the peptide epitopes available to an individual's T-cell repertoire. Current genotyping software tools do not work for the dog, due to very limited known canine alleles. To address this, we developed a Kmer-based paired-end read (KPR) de novo assembler and genotyper, which assemble paired-end RNA-seq reads from MHC-I regions into contigs, and then genotype each contig and estimate its expression level. KPR tools outperform other popular software examined in typing new alleles. We used KPR tools to successfully genotype152 dogs from a published dataset. The study discovers 33 putative new alleles, finds dominant alleles in 4 dog breeds, and builds allele diversity and expression landscapes among the 152 dogs. Our software meets a significant need in biomedical research.

Keywords: Biocomputational method; Computational bioinformatics; Genomic analysis.


Conflict of interest statement

The authors declare no competing interests.

Figures

None
Graphical abstract
Figure 1
Figure 1
Kmer-based paired-end read (KPR) de novo assembler and genotyper conduct DLA-I genotyping using paired-end RNA-seq data (A) Our KPR assembler assembles the highly polymorphic region, the entirety of exons 2 and 3, of DLA-I alleles of an individual de novo, using paired-end RNA-seq reads (see STAR Methods). Contigs are represented by bars, while paired-end reads are represented by paired-arrows facing each other. HVR: hypervariable region. (B) Our genotyper genotypes each assembled contig with the entire exon 2 and 3 sequence. For non-DLA-64 contigs, genotyping is done after variant linkage building, validation and if needed, extension (see STAR Methods) are performed. Sequence variants are indicated by colored dots.
Figure 2
Figure 2
Contigs assembled by the KPR software are validated by Sanger sequencing (A) Sanger sequence is identical to the contig assembled with RNA-seq reads of the same dog by the KPR software. HVRs are drawn as reported previously., (B) Representative confocal images indicate that the MHC-I protein complex is expressed in the same tissue of the dog. See Table S1.
Figure 3
Figure 3
KPR running parameters are optimized for DLA-88 genotyping via simulation (A) Optimization of two-polymorphic site read pair depth (PD). A total of 180 simulated samples (see STAR Methods) were genotyped by the KPR software with each value of the assembly runs (N) or the Kmer length (K) specified by the X axis. The Y axis indicates the maximum number of read pairs that do not support any variant linkage of known alleles in a simulated sample. Red dots in black line show the optimized PD at each N or K. The numbers at the top indicate the total false negatives (FN) in 180 samples. TP: true positives. FP: false positives. (B and C) Optimization of N and K. Plotted are distributions of true positive rate (TPR) and false discovery rate (FDR) in each of the 180 simulated samples at a specified N (B) or K (C) value. The genotyping was done with N = 1,000 for B and K = 50 for C. TPR and FDR were calculated using allele numbers (top) or estimated expression levels (bottom) before and after paired-end validation. Each dot represents the TPR or FDR of a sample, while the line indicates the mean FDR or TPR of the 180 samples at each N or K value. (D) K varies with sequence read length. A total 180 simulated samples were genotyped at each read length with the specified K value. Images are presented as B and C. See Figures S1–S8, and Table S2.
Figure 4
Figure 4
The influence of allele combination (AC), sequencing error rate (E), DLA-I read amount (D) and distribution (RD) on DLA-88 genotyping is evaluated via simulation (A) AC evaluation. Genotyping results are shown for 300 samples, simulated with the 10 ACs (30 samples per AC) indicated and with E, D, and RD optimized (see STAR Methods). TPR and FDR are presented as in Figure 3. (B) E evaluation. Genotyping results are shown for 350 samples, simulated with 7 E values (50 samples per E) indicated and with AC, D, and RD optimized (see STAR Methods). The thick bar of the X axis indicates the actual E range of the RNA-seq data of the cohort. (C) D evaluation. Genotyping results are shown for 400 samples, simulated with the 8 D values (50 samples per D) indicated and with AC, E and RD optimized (see STAR Methods). The thick bar of the X axis indicates the actual D range for the RNA-seq data of the cohort. (D) RD evaluation. Genotyping results are shown for 250 samples, simulated with the 5 RD values (50 samples per RD) indicated and with all AC, E and D optimized (left), or only AC and E optimized and D=10,000 (middle) or D=3,000 (right) (see STAR Methods). See Figure S9 and Tables S2 and S3.
Figure 5
Figure 5
KPR software outperforms the HLAminer assembly tool and Seq2HLA in new allele typing (A) Genotyping with known alleles. Left heatmaps indicate TPR (red) and FDR (blue) in each of the 600 simulated samples (see STAR Methods). Columns represent simulated samples, grouped based on the gene and AC, and then ordered by TPR and FDR. Right bar plots summarize the genotyping results of all samples, with ∗ indicating a significant (p < 0.05) difference via Wilcoxon rank sum tests between the software tools compared. Homo: homozygous; Het: heterozygous; Het same: heterozygous with same type of alleles (DLA-88 or DLA-88L) only; Het Diff: with both DLA-88 and DLA-88L alleles. (B) Genotyping with new alleles. Images are presented as described in A. See Table S4.
Figure 6
Figure 6
KPR tools genotyped 152 dogs from the largest canine RNA-seq study published so far, (A and B) Genotyping results of the tumor (top) and normal (bottom) samples of the 152 dogs grouped by breeds. A dog is represented by single or paired vertical bars. The lines inside each bar separate individual alleles, with the height indicating the allele expression in reads per million (RPM) (A) or expression fractions within the animal (B). DLA-88/88L/12/64: known alleles. DLA-88/88L/12/64 group: new allele candidates with allele group assigned. DLA-88/88L/12/64 new: new allele candidates with no allele group assigned. (C) Distribution of allele cumulative expression fractions within the 146 tumor samples. Alleles with cumulative expression fractions ≥1.0 are shown. Known alleles are shown as black bars, while new alleles are as gray bars. (D) Breed-dominant alleles in the tumor samples of 4 pure breeds with each having ≥10 dogs. Top 4 alleles or alleles with cumulative expression fraction ratio reaching >50% within a breed are specified. See Figures S10–S12 and Table S5.
Figure 7
Figure 7
DLA-12 and DLA-88L alleles cluster with DLA-88 alleles (A) The clustering of 45 known alleles and 33 putative new alleles identified in the 152 dogs, based on amino acid sequence identities. Breed enrichment is represented by the fraction of dogs within a breed that carry the allele. “Allele frequency” is the cumulated allele expression fraction, while “Dog number” specifies the number of dogs having the allele, within the cohort. (B) Examples of DLA-88/DLA-88L linkages and a putative DLA-88/DLA-12 linkage indicated by allele co-occurrence identified by Fisher’s exact tests, with p values shown. The two DLA-88/DLA-88L linkages shown have been reported previously. (C) Proposed evolution of the DLA-I genes. Red lines link the likely corresponding HLA-I and DLA-I genes. Dash lines indicate the breakage of the HLA-I locus in the canine genome. “-” and “+” specify the gene orientation. See Figures S13–S15 and Table S6.

Similar articles

Cited by

References

    1. Somarelli J.A., Boddy A.M., Gardner H.L., DeWitt S.B., Tuohy J., Megquier K., Sheth M.U., Hsu S.D., Thorne J.L., London C.A., Eward W.C. Improving cancer drug discovery by studying cancer across the tree of Life. Mol. Biol. Evol. 2020;37:11–17. doi: 10.1093/molbev/msz254. - DOI - PMC - PubMed
    1. London C.A., Acquaviva J., Smith D.L., Sequeira M., Ogawa L.S., Gardner H.L., Bernabe L.F., Bear M.D., Bechtel S.A., Proia D.A. Consecutive day hsp90 inhibitor administration improves efficacy in murine models of kit-driven malignancies and canine mast cell tumors. Clin. Cancer Res. 2018;24:6396–6407. doi: 10.1158/1078-0432.CCR-18-0703. - DOI - PMC - PubMed
    1. Regan D.P., Chow L., Das S., Haines L., Palmer E., Kurihara J.N., Coy J.W., Mathias A., Thamm D.H., Gustafson D.L., Dow S.W. Losartan blocks osteosarcoma-elicited monocyte recruitment, and combined with the kinase inhibitor toceranib, exerts significant clinical benefit in canine metastatic osteosarcoma. Clin. Cancer Res. 2022;28:662–676. doi: 10.1158/1078-0432.CCR-21-2105. - DOI - PMC - PubMed
    1. Boyko A.R. The domestic dog: man's best friend in the genomic era. Genome Biol. 2011;12:216. doi: 10.1186/gb-2011-12-2-216. - DOI - PMC - PubMed
    1. Dow S. A role for dogs in advancing cancer immunotherapy research. Front. Immunol. 2019;10:2935. doi: 10.3389/fimmu.2019.02935. - DOI - PMC - PubMed