A novel method for the synthesis of core-shell nanoparticles for functional applications based on long-term confinement in a radio frequency plasma
- PMID: 36798508
- PMCID: PMC9926887
- DOI: 10.1039/d2na00806h
A novel method for the synthesis of core-shell nanoparticles for functional applications based on long-term confinement in a radio frequency plasma
Abstract
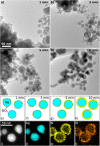
A novel combined setup of a Haberland type gas aggregation source and a secondary radio frequency discharge is used to generate, confine, and coat nanoparticles over much longer time scales than traditional in-flight treatment. The process is precisely monitored using localized surface plasmon resonance and Fourier-transform infrared spectroscopy as in situ diagnostics. They indicate that both untreated and treated particles can be confined for extended time periods (at least one hour) with minimal losses. During the entire confinement time, the particle sizes do not show considerable alterations, enabling multiple well-defined modifications of the seed nanoparticles in this synthesis approach. The approach is demonstrated by generating Ag@SiO2 nanoparticles with a well-defined surface coating. The in situ diagnostics provide insights into the growth kinetics of the applied coating and are linked to the coating properties by using ex situ transmission electron microscopy and energy dispersive X-ray spectroscopy. Surface coating is shown to occur in two phases: first, singular seeds appear on the particle surface which then grow to cover the entire particle surface over 3 to 5 minutes. Afterwards, deposition occurs via surface growth which coincides with lower deposition rates. Our setup offers full control for various treatment options, which is demonstrated by coating the nanoparticles with a SiO2 layer followed by the etching of the part of the applied coating using hydrogen. Thus, complex multi-step nanofabrication, e.g., using different monomers, as well as very large coating thicknesses is possible.
This journal is © The Royal Society of Chemistry.
Conflict of interest statement
There are no conflicts to declare.
Figures


Similar articles
-
[Preparation of molecularly imprinted polymers-functionalized silica nanoparticles for the separation and recognition of aristolochic acids].Se Pu. 2021 Oct;39(10):1137-1145. doi: 10.3724/SP.J.1123.2021.06024. Se Pu. 2021. PMID: 34505436 Free PMC article. Chinese.
-
SiO2 coating of silver nanoparticles by photoinduced chemical vapor deposition.Nanotechnology. 2009 Jul 22;20(29):295604. doi: 10.1088/0957-4484/20/29/295604. Epub 2009 Jul 1. Nanotechnology. 2009. PMID: 19567950
-
A one-step short-time synthesis of Ag@SiO2 core-shell nanoparticles.J Colloid Interface Sci. 2015 Jun 1;447:40-9. doi: 10.1016/j.jcis.2015.01.065. Epub 2015 Feb 7. J Colloid Interface Sci. 2015. PMID: 25697687
-
Effect of pH on the synthesis and properties of luminescent SiO2/calcium phosphate:Eu3+ core-shell nanoparticles.Langmuir. 2011 Dec 6;27(23):14025-32. doi: 10.1021/la2021116. Epub 2011 Oct 28. Langmuir. 2011. PMID: 21988231
-
Hollow Gold-Silver Nanoshells Coated with Ultrathin SiO2 Shells for Plasmon-Enhanced Photocatalytic Applications.Materials (Basel). 2020 Nov 4;13(21):4967. doi: 10.3390/ma13214967. Materials (Basel). 2020. PMID: 33158286 Free PMC article.
References
-
- Ghori M. Z. Adam J. Aktas O. C. Veziroglu S. Shurtleff B. B. Strunskus T. Faupel F. Polonskyi O. Hinz A. ACS Appl. Nano Mater. 2018;1:3760–3764. doi: 10.1021/acsanm.8b00853. - DOI
-
- Veziroglu S. Ghori M. Z. Obermann A. L. Röder K. Polonskyi O. Strunskus T. Faupel F. Aktas O. C. Phys. Status Solidi A. 2019;216:1–6.
-
- Veziroglu S. Ullrich M. Hussain M. Drewes J. Shondo J. Strunskus T. Adam J. Faupel F. Cenk O. Surf. Coat. Technol. 2020;389:125613. doi: 10.1016/j.surfcoat.2020.125613. - DOI
-
- Li H. Li Z. Yu Y. Ma Y. Yang W. Wang F. Yin X. Wang X. J. Phys. Chem. C. 2017;121:12071–12079. doi: 10.1021/acs.jpcc.7b03566. - DOI
LinkOut - more resources
Full Text Sources

