. 2023 Jan 31:14:1068296.
doi: 10.3389/fpls.2023.1068296. eCollection 2023.

Rice DST transcription factor negatively regulates heat tolerance through ROS-mediated stomatal movement and heat-responsive gene expression

Affiliations

Rice DST transcription factor negatively regulates heat tolerance through ROS-mediated stomatal movement and heat-responsive gene expression

Yanfei Ding et al. Front Plant Sci. .

Abstract

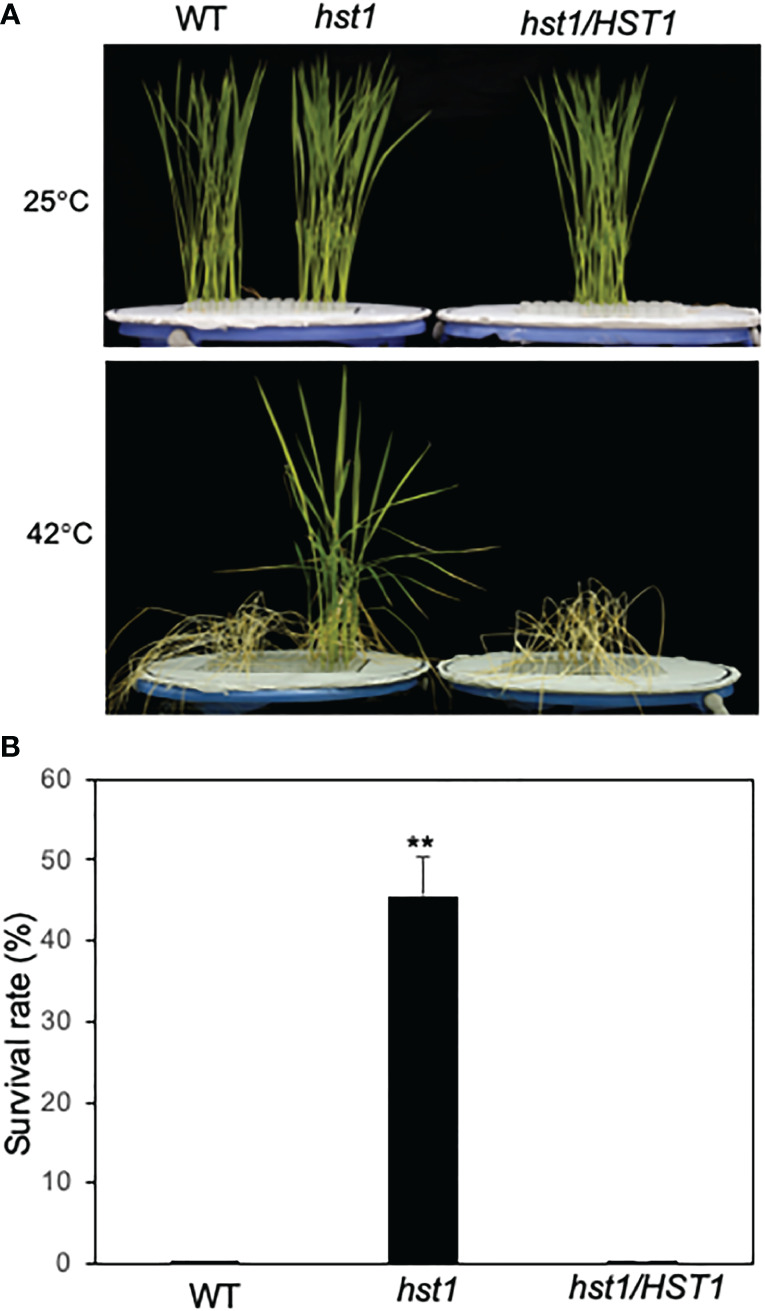
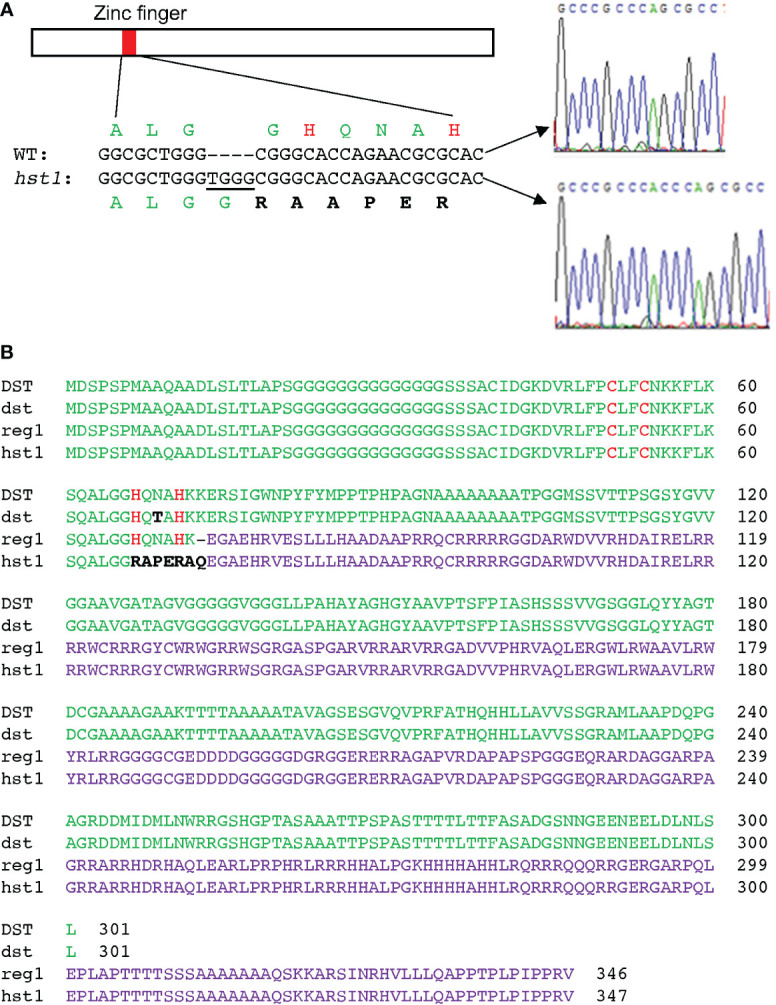
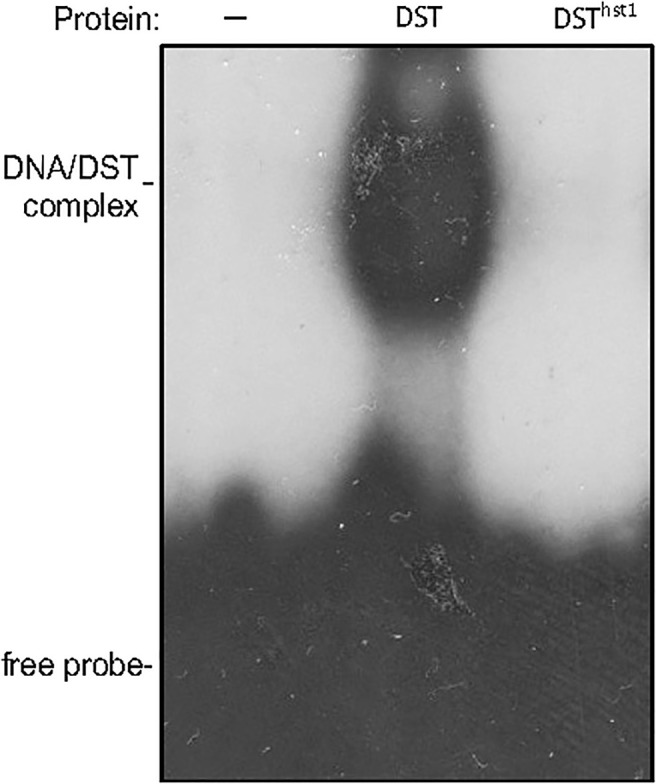
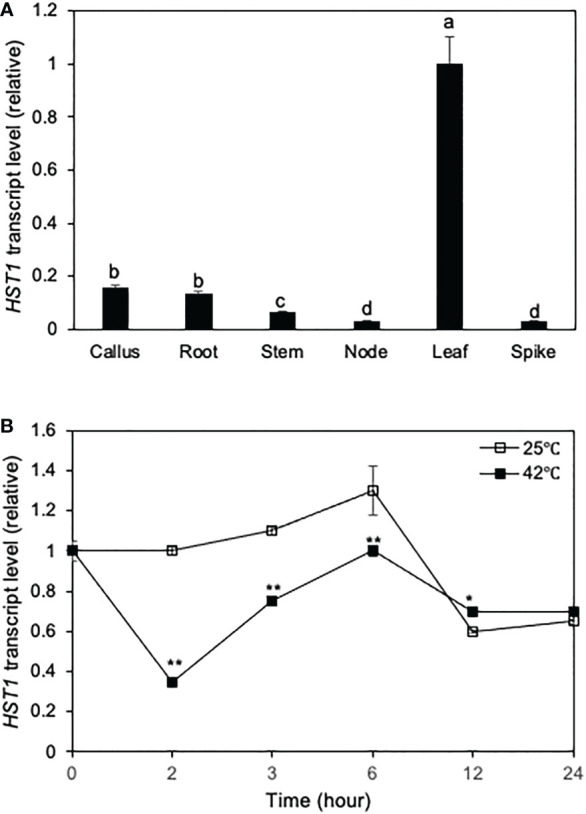
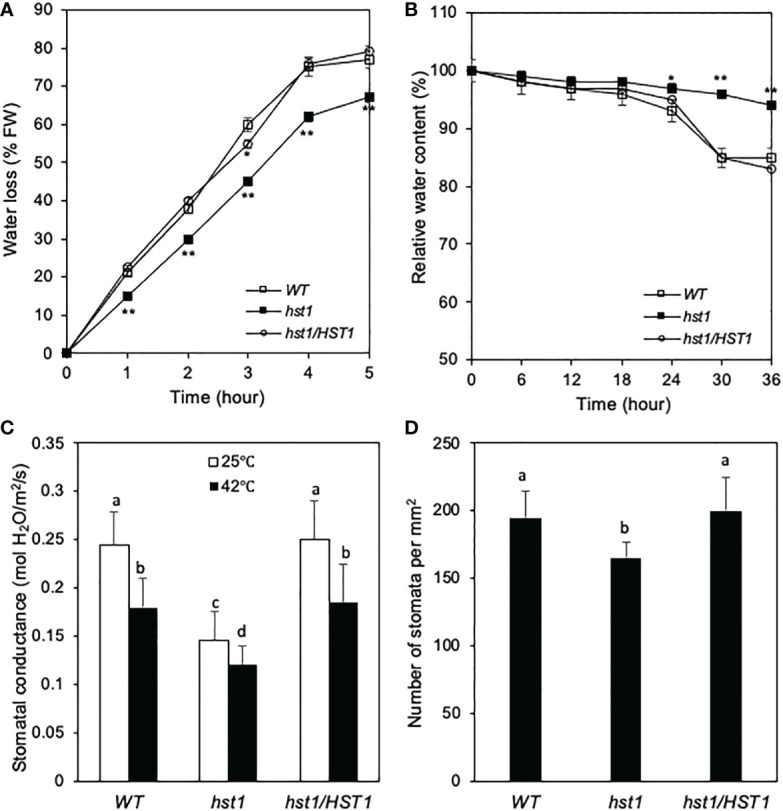
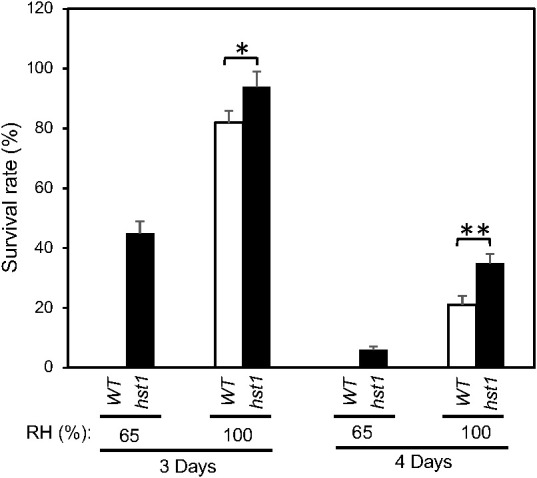
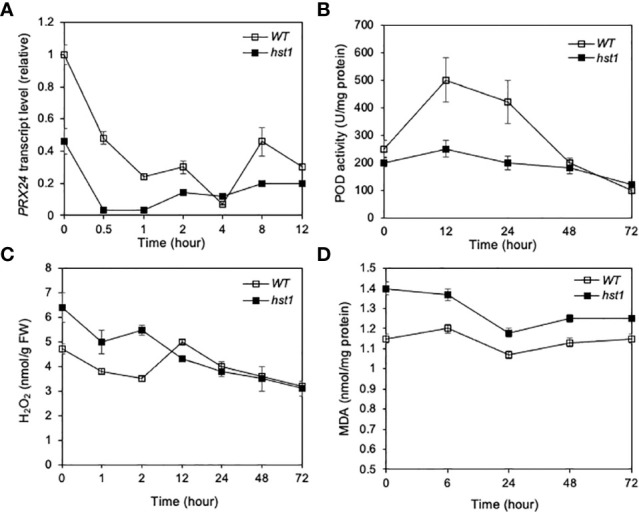
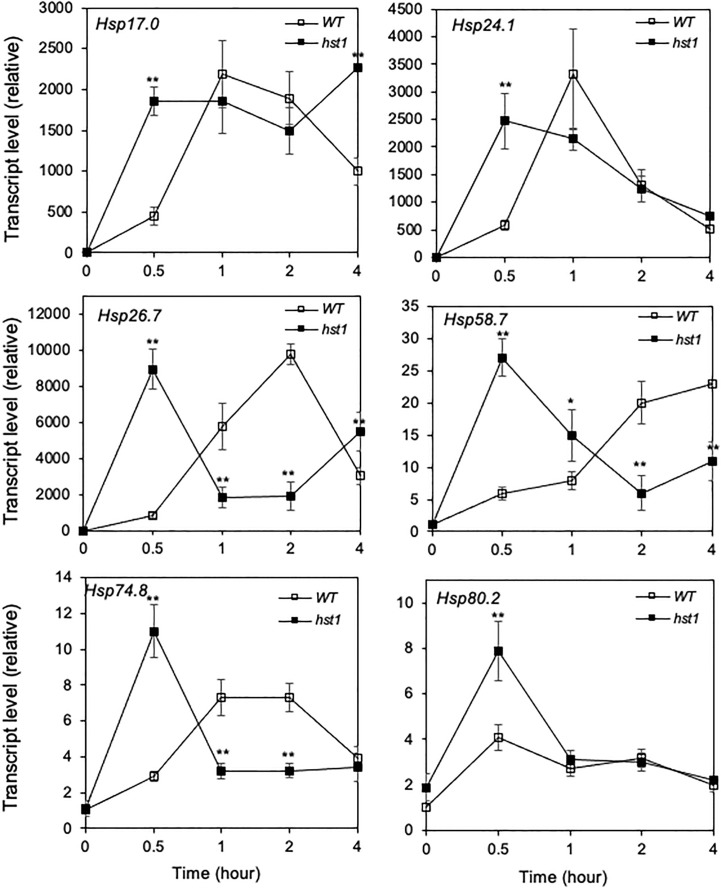
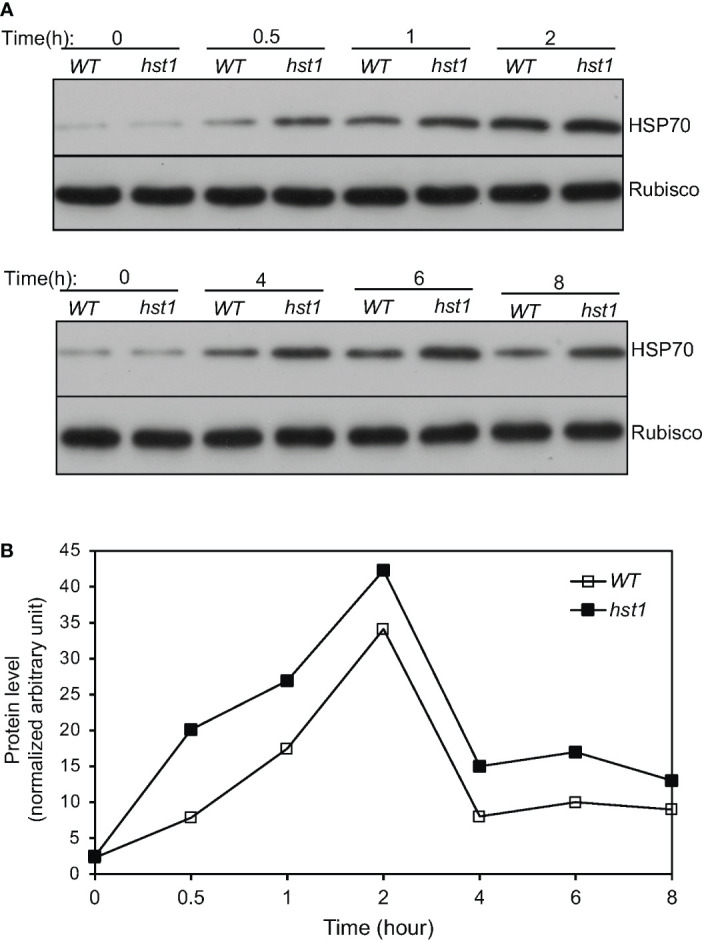
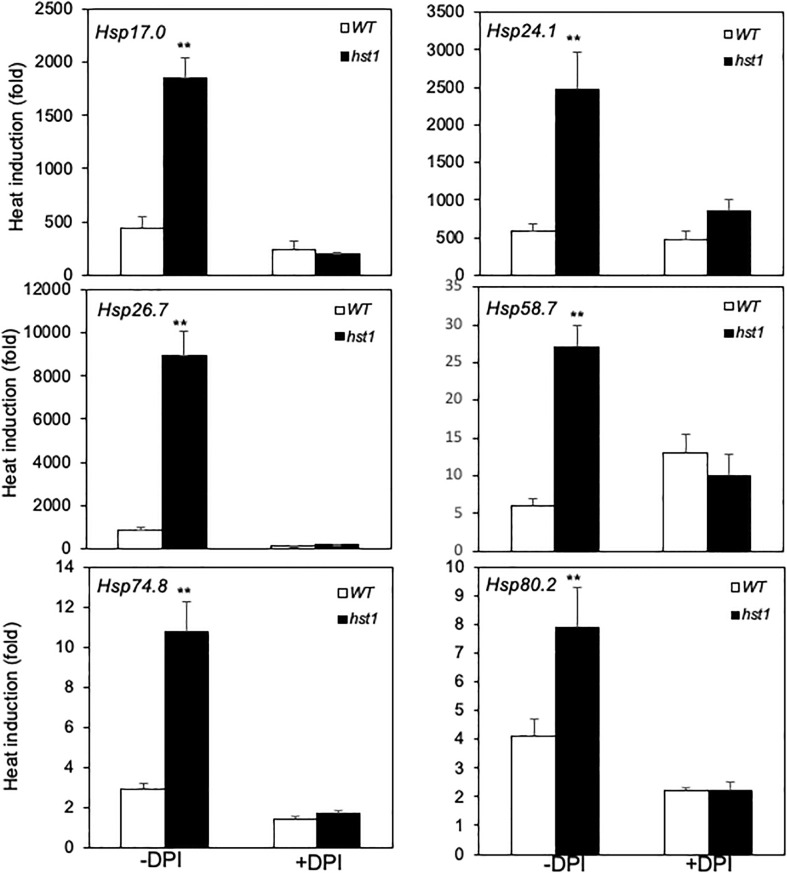
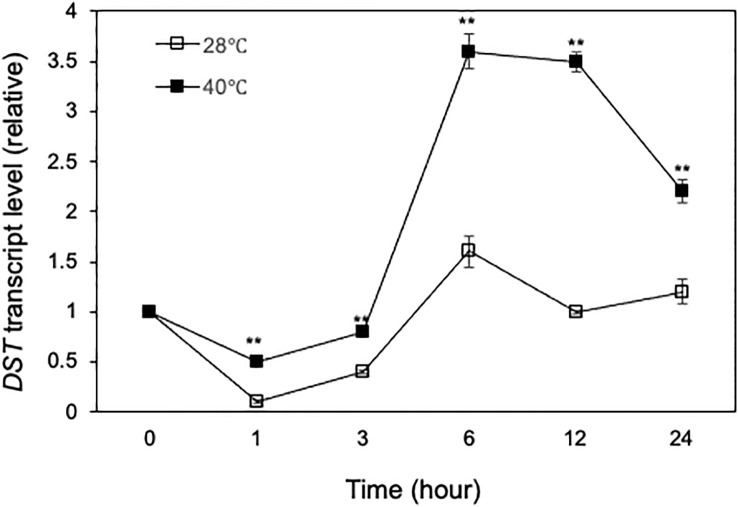
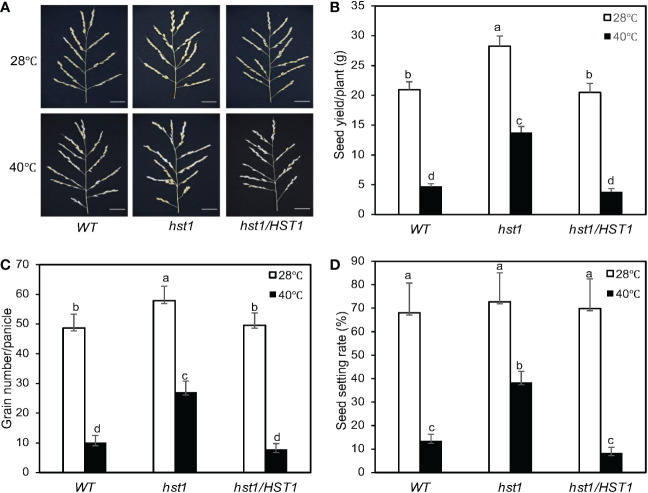
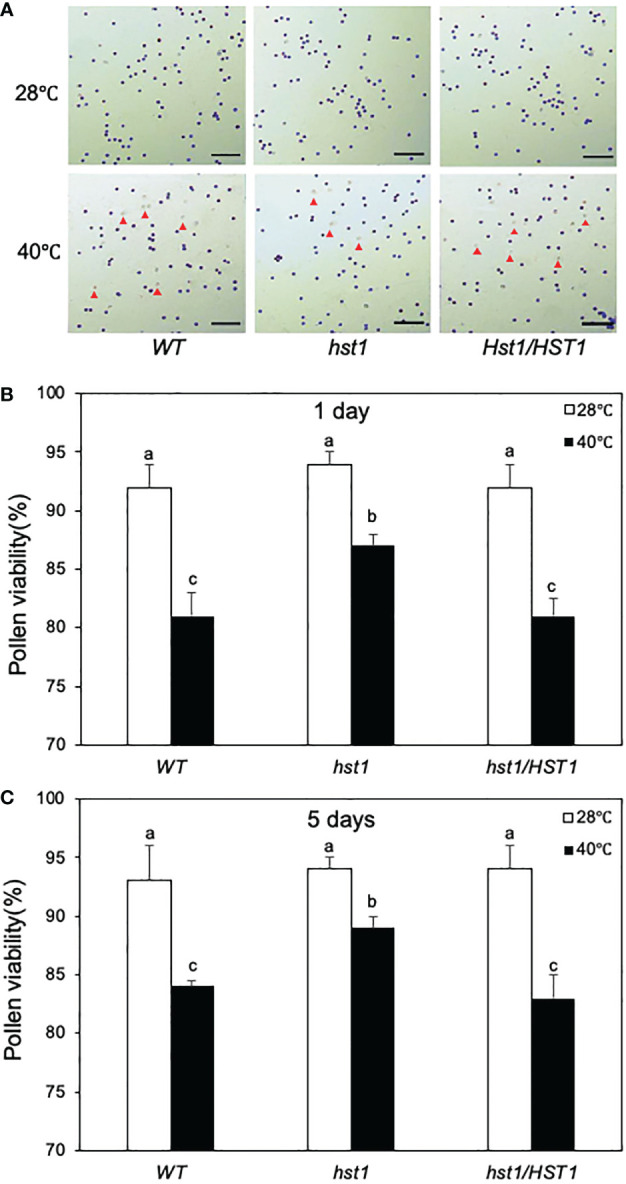
Plants are frequently subjected to a broad spectrum of abiotic stresses including drought, salinity and extreme temperatures and have evolved both common and stress-specific responses to promote fitness and survival. Understanding the components and mechanisms that underlie both common and stress-specific responses can enable development of crop plants tolerant to different stresses. Here, we report a rice heat stress-tolerant 1 (hst1) mutant with increased heat tolerance. HST1 encodes the DST transcription factor, which also regulates drought and salinity tolerance. Increased heat tolerance of hst1 was associated with suppressed expression of reactive oxygen species (ROS)-scavenging peroxidases and increased ROS levels, which reduced water loss by decreasing stomatal aperture under heat stress. In addition, increased ROS levels enhanced expression of genes encoding heat shock protein (HSPs) including HSP80, HSP74, HSP58 and small HSPs. HSPs promote stabilization of proteins and protein refolding under heat stress and accordingly mutation of HST1 also improved reproductive traits including pollen viability and seed setting under high temperature. These results broaden the negative roles of DST in abiotic stress tolerance and provide important new insights into DST-regulated tolerance to diverse abiotic stresses through both shared and stress-specific mechanisms.

Keywords: DST transcription factor; heat shock genes; plant heat tolerance; reactive oxygen species; reproductive traits under heat stress; stomatal aperture.


Conflict of interest statement

The authors declare that the research was conducted in the absence of any commercial or financial relationships that could be construed as a potential conflict of interest.

Figures

Figure 1
Figure 1
Enhanced heat tolerance of rice WT and hst1 mutant. (A) Survival of rice plants after heat treatment. Ten-day old rice seedlings of WT, hst1 mutant and hst1 mutant containing a full length HST1 genome clone (hst1/HST1) were subjected to heat treatment for 3 days at 42°C. The pictures were taken after 12 days of recovery after heat treatment. The pictures of plants grown at 25°C are also shown for comparison. (B) Plant survival rates of WT, hst1 mutant and hst1 mutant containing a full length HST1 genome clone (hst1/HST1) after heat treatment. Means and SE were calculated from survival rates determined from three experiments with about 100 seedlings per experiment for each genotype. The statistical differences in the survival rate between WT and hst1 mutant plants were tested using a Student t test (**P ≤ 0.01).
Figure 2
Figure 2
Positional cloning and gene product of the hst1 mutant gene. (A) Identification of the hst1 gene mutation. The hst1 gene contains a four-nucleotide (TGGG) insertion at the nucleotide position 194, which leads to a frameshift of the translated protein at its CCHH zinc finger motif. (B) Comparison of WT DST protein with the three isolated mutant proteins: DSTdst (dst), DSTreg1(reg1) and DSThst1(hst1). The dst protein contains a single amino acid substitution (N69T) between the two conserved H residues at the zinc finger motif. Both reg1 and hst1 proteins result from frameshift mutations that alter a majority of the DST amino acid sequence. The reg1 protein still contains the intact zinc finger motif while the hst1 protein lost the conserved histidine H residues of the zinc finger motif due to the frameshift mutations. The conserved zinc-binding cysteine (C) and H residues of the zinc finger motif are in red. The unique amino acid residues in dst and hst1 from their respective mutations are in black. The altered C-terminal amino acid sequences from reading frame shifting in reg1 and hst1 proteins are in purple.
Figure 3
Figure 3
Assays of DNA-binding activity of DST and DSThst1 proteins. Binding reactions (20 μl) contained no (-) or 0.5 μg indicated recombinant proteins, 2 ng labeled oligo DNA (GGCTATACTAACCGTGCtgctagccattagGCCCAAGTTAGT) and 5 μg polydeoxyinosinic-deoxycytidylic acid.
Figure 4
Figure 4
Tissue-specific and heat-regulated expression of DST. (A) Tissue-specific expression of DST. Total RNA was isolated from indicated tissues and transcript levels of DST were determined using qRT-PCR. Error bars indicate SE (n = 3). According to Duncan’s multiple range test (P=0.01), means of the values do not differ if they are indicated with the same letter. (B) DST gene expression in response to heat treatment. Rice seedlings (10-days old) were placed in a 25°C or 42°C growth chamber and total RNA was isolated from leaf samples collected at indicated times. Transcript levels of DST were determined using qRT-PCR. Error bars indicate SE (n = 3). The statistical differences in the transcript levels between 25°C and 42°C were tested using a Student t test (*P ≤ 0.05; **P ≤ 0.01).
Figure 5
Figure 5
Effects of the hst1 mutation on leaf stomata and water loss under heat stress. (A) Water loss of detached leaves. For each repeat, 10 fully expanded leaves of 10-day-old plants were detached from WT and the hst1 mutant plants and placed at 24°C with 40% relative humidity in a triplicate experiment (n = 3). (B) Relative water content. Relative water content of WT and hst1 mutant treated with heat (42°C) at 65% relative humidity using the fully expanded leaves of 10-day-old plants (n = 9). (C) Stomatal conductance. Seedlings were cultured in a growth chamber for 10 days, and the stomatal conductance was measured using a portable photosynthesis system (LI-6400 LI-COR, Lincoln, USA). The statistical differences in water loss or water content between WT and hst1 mutant plants including the hst1 mutant plants containing the full HST1 genome clone (hst1/HST1) were tested using a Student t test (*P ≤ 0.05; **P ≤ 0.01). (D) Stomata number. Stomatal density of middle sections of leaves from WT and hst1 mutant plants (n = 10) were determined from three random microscopic fields in each repeat. According to Duncan’s multiple range test (P=0.01), means of the values do not differ if they are indicated with the same letter. The experiment was repeated three times with similar results.
Figure 6
Figure 6
Effects of humidity on the heat tolerance of rice WT and hst1 mutant. Ten-day old WT and hst1 mutant plants were subjected to heat treatment at 42°C for 3 and 4 days under 65% and 100% relative air humidity. The survival rates were estimated after 10 days of recovery at the room temperature. Means and SE were calculated from survival rates determined from three experiments with about 50 seedlings per experiment for each genotype. The statistical differences in the maximum leaf width between WT and hst1 mutant were tested using a Student t test (*P ≤ 0.05; **P ≤ 0.01).
Figure 7
Figure 7
Effect of the hst1 mutation on expression of ROS-scavenging Prx24 target gene and levels of ROS and MDA under heat stress. (A) Expression of Prx24. Rice WT and hst1 mutant seedlings (10-day old) were placed in a 42°C growth chamber and total RNA was isolated from leaf samples collected at indicated times. Transcript levels of Prx24 were determined using qRT-PCR. Error bars indicate SE (n = 3). (B) Level of peroxidase (POD) activity. Heat treatment of rice seedlings was performed as in (c). One unit (U) POD activity is defined as the amount of enzyme which catalyzes 1 µg substrate in 20 seconds at 25°C. Means and SE were calculated from three experiments with five leaf samples per time point for each genotype. (C) Level of ROS. Heat treatment of rice seedlings was performed as in (a). Means and SE were calculated from three experiments with five leaf samples per time point for each genotype. (D) Level of MDA. Heat treatment of rice seedlings was performed as in (a). Means and SE were calculated from three experiments with five leaf samples per time point for each genotype. The statistical differences in the Prx24 transcript level, POD activity, ROS or MDA level between WT and hst1 mutant plants were tested using a Student t test (**P ≤ 0.01).
Figure 8
Figure 8
Heat-induced expression of HSP genes. WT and hst1 mutant plants (45-day-old) were placed in a 42°C growth chamber and total RNA was isolated from leaf samples collected at indicated times. Transcript levels were determined using qRT-PCR. Error bars indicate SE (n = 3). The statistical differences in the transcript level between WT and hst1 mutant were tested using a Student t test (*P ≤ 0.05; **P ≤ 0.01).
Figure 9
Figure 9
Heat-induced HSP70 accumulation in rice seedlings. (A) Ten-day old WT and hst1 mutant seedlings were placed in a 42°C growth chamber and total proteins were isolated from leaf samples collected at indicated times. The HSP70 protein levels were analyzed by western blotting using anti-HSP70 polyclonal antibodies. Rubisco large subunit proteins, detected with an anti-Rubisco antibody, were used as a loading control. (B) HSP70 protein levels at the indicated times of heat treatment were determined from the band intensities of scanned western blots using Image J software. The quantification reflected the relative amounts as a ratio of each HSP protein band to the lane’s Rubisco loading control. The HSP70 protein band intensities from different blots were normalized. The experiments were repeated twice with similar results.
Figure 10
Figure 10
Effect of DPI on early induction of HSP gene expression by heat treatment. WT and hst1 mutant plants (45-day-old) were transferred to the growth medium with (+) or without (-) 10 uM DPI. After 24-hour treatment, the plants were placed in a 42°C growth chamber and total RNA was isolated from leaf samples collected after 0.5 hour of heat treatment. Transcript levels were determined using qRT-PCR. Error bars indicate SE (n = 3). The statistical differences in heat induction of the indicated gene transcript with or without DPI treatment between WT and hst1 mutant were tested using a Student t test (**P ≤ 0.01).
Figure 11
Figure 11
Heat-regulated expression of DST. Rice plants on the first day of heading and flowering were placed in a 28°C or 40°C growth chamber and total RNA was isolated from panicle/flower samples collected at indicated times. Transcript levels of DST were determined using qRT-PCR. Error bars indicate SE (n = 3). The statistical differences in the transcript levels between 28°C and 40°C were tested using a Student t test (**P ≤ 0.01).
Figure 12
Figure 12
Enhanced reproductive performance of hst1 under heat stress. Rice plants were moved to a growth chamber one day prior to heading and subjected to a heat treatment regimen (daily 6 hours at 40°C) for 7 days with a 13h light/11h dark photoperiod as described in Materials and Methods. Control plants were grown at 28°C during the 13-hour light period. Plants were grown under normal growth conditions after treatment and their reproductive traits including panicle numbers (A), seed yield per plant (B), grain numbers per panicle (C) and seed setting rates (D) were evaluated after they reached full maturity. Means and SE were calculated from 40 plants for each genotype. According to Duncan’s multiple range test (P=0.01), means of the reproductive traits do not differ if they are indicated with the same letter. The experiment was repeated three times with similar results.
Figure 13
Figure 13
Enhanced pollen viability of hst1 under heat stress. Rice plants were moved to a growth chamber one day prior to heading and subjected to the same heat treatment regimen as in Figure 12 and described in Materials and Methods. Pollen viability was assayed with a peroxidase activity staining procedure. Viable pollens stained blue and unviable pollens stained colorless or yellowish as indicated by red markers (A). The percentages of viable pollens after 1 (B) and 5 (C) days of heat treatment were determined, Means and SE of viable pollen percentages were calculated from approximately 300 pollens from three microscope fields of view. According to Duncan’s multiple range test (P=0.05), viable pollen percentage means do not differ if they are indicated with the same letter. The experiment was repeated three times with similar results.

Similar articles

Cited by

References

    1. Amm I., Sommer T., Wolf D. H. (2014). Protein quality control and elimination of protein waste: the role of the ubiquitin-proteasome system. Biochim. Biophys. Acta 1843, 182–196. doi: 10.1016/j.bbamcr.2013.06.031 - DOI - PubMed
    1. Apel K., Hirt H. (2004). Reactive oxygen species: metabolism, oxidative stress, and signal transduction. Annu. Rev. Plant Biol. 55, 373–399. doi: 10.1146/annurev.arplant.55.031903.141701 - DOI - PubMed
    1. Arias E., Cuervo A. M. (2011). Chaperone-mediated autophagy in protein quality control. Curr. Opin. Cell Biol. 23, 184–189. doi: 10.1016/j.ceb.2010.10.009 - DOI - PMC - PubMed
    1. Arrigo A. P. (2005). [Heat shock proteins as molecular chaperones]. Medecine Sci. M/S 21, 619–625. doi: 10.1051/medsci/2005216-7619 - DOI - PubMed
    1. Ascenzi R., Gantt J. S. (1999). Molecular genetic analysis of the drought-inducible linker histone variant in arabidopsis thaliana. Plant Mol. Biol. 41, 159–169. doi: 10.1023/A:1006302330879 - DOI - PubMed

LinkOut - more resources