. 2023 Jan 31:13:1011199.
doi: 10.3389/fpls.2022.1011199. eCollection 2022.

PlantTribes2: Tools for comparative gene family analysis in plant genomics

Affiliations

PlantTribes2: Tools for comparative gene family analysis in plant genomics

Eric K Wafula et al. Front Plant Sci. .

Abstract

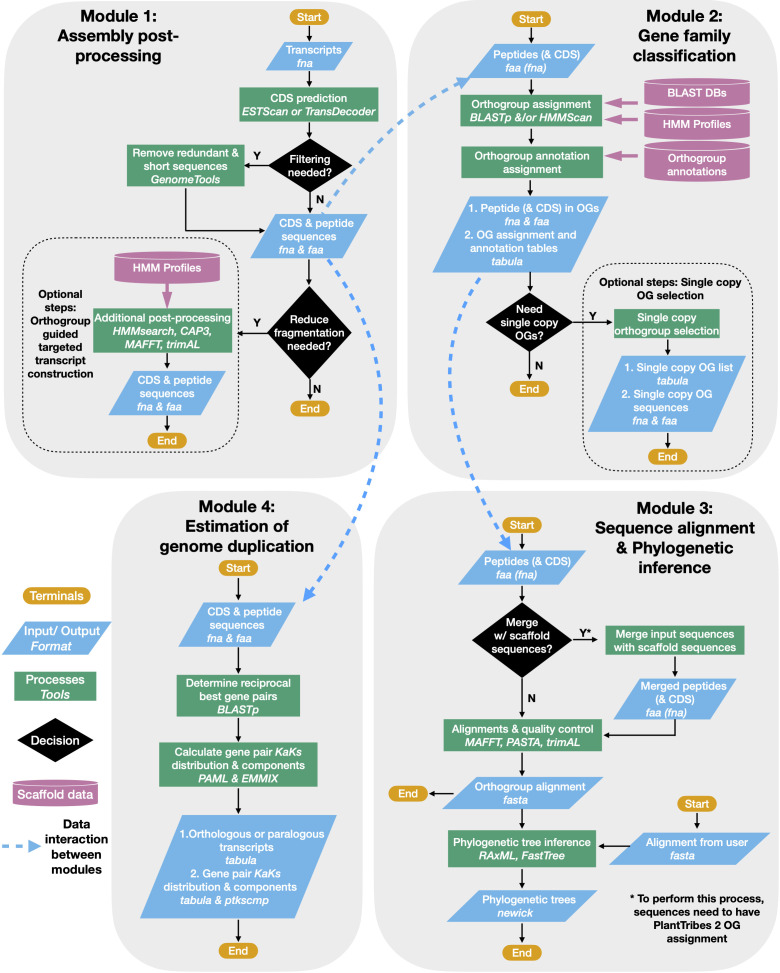
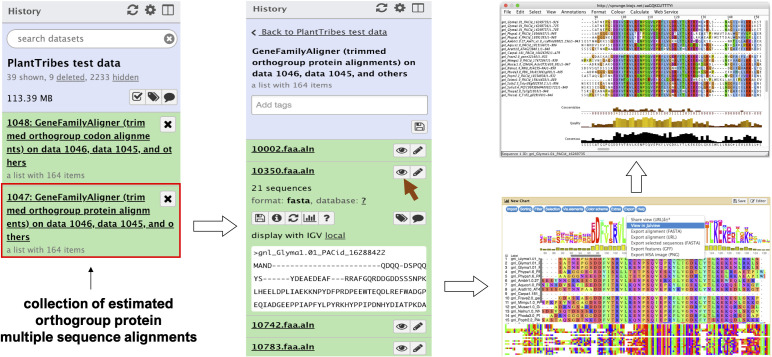
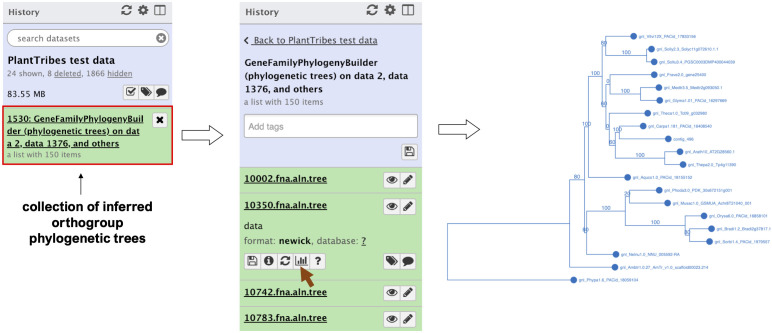
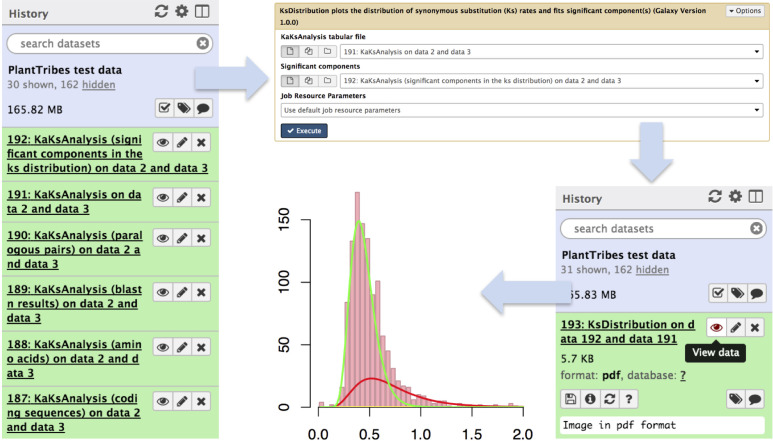
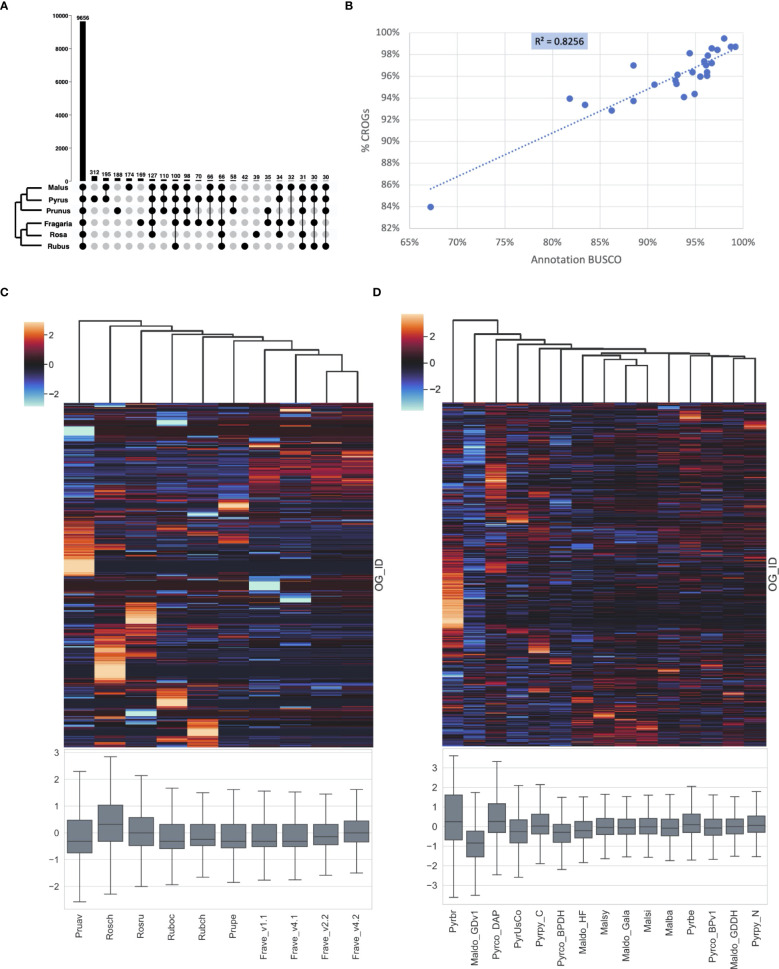
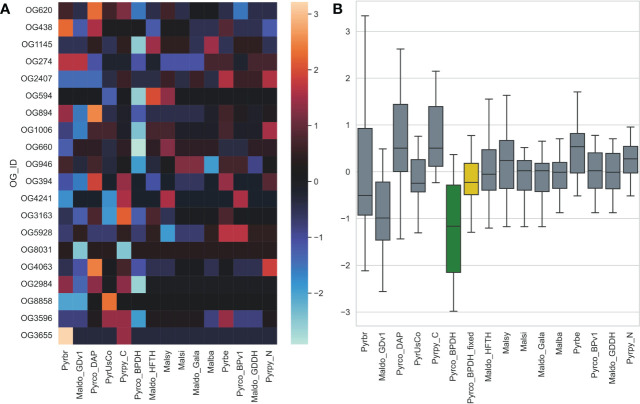
Plant genome-scale resources are being generated at an increasing rate as sequencing technologies continue to improve and raw data costs continue to fall; however, the cost of downstream analyses remains large. This has resulted in a considerable range of genome assembly and annotation qualities across plant genomes due to their varying sizes, complexity, and the technology used for the assembly and annotation. To effectively work across genomes, researchers increasingly rely on comparative genomic approaches that integrate across plant community resources and data types. Such efforts have aided the genome annotation process and yielded novel insights into the evolutionary history of genomes and gene families, including complex non-model organisms. The essential tools to achieve these insights rely on gene family analysis at a genome-scale, but they are not well integrated for rapid analysis of new data, and the learning curve can be steep. Here we present PlantTribes2, a scalable, easily accessible, highly customizable, and broadly applicable gene family analysis framework with multiple entry points including user provided data. It uses objective classifications of annotated protein sequences from existing, high-quality plant genomes for comparative and evolutionary studies. PlantTribes2 can improve transcript models and then sort them, either genome-scale annotations or individual gene coding sequences, into pre-computed orthologous gene family clusters with rich functional annotation information. Then, for gene families of interest, PlantTribes2 performs downstream analyses and customizable visualizations including, (1) multiple sequence alignment, (2) gene family phylogeny, (3) estimation of synonymous and non-synonymous substitution rates among homologous sequences, and (4) inference of large-scale duplication events. We give examples of PlantTribes2 applications in functional genomic studies of economically important plant families, namely transcriptomics in the weedy Orobanchaceae and a core orthogroup analysis (CROG) in Rosaceae. PlantTribes2 is freely available for use within the main public Galaxy instance and can be downloaded from GitHub or Bioconda. Importantly, PlantTribes2 can be readily adapted for use with genomic and transcriptomic data from any kind of organism.

Keywords: CROG analysis; applied agriculture; comparative genomics; galaxy; gene family phylogenetics; genome duplication; modular tools; multiple sequence alignment.


Conflict of interest statement

The authors declare that the research was conducted in the absence of any commercial or financial relationships that could be construed as a potential conflict of interest.

Figures

Figure 1
Figure 1
PlantTribes2 analysis workflow. A schematic diagram illustrating the PlantTribes2 modular analysis workflow. (1) A user provides transcripts for post-processing, resulting in a non-redundant set of predicted coding sequences and their corresponding translations (Module 1). (2) The post-processed transcripts (or user provided sequences) are searched against a gene family scaffold blast and/or hmm database(s), and transcripts are assigned into their putative orthogroups with corresponding metadata (Module 2). (3) Classified transcripts are integrated with their corresponding scaffold gene models to estimate orthogroup multiple sequence alignments and corresponding phylogenetic trees (Module 3). Similarly, sequence alignments and phylogeny can be constructed from user provided data. (4) Synonymous substitution rate (Ks) and nonsynonymous substitution rate (Ka) of paralogs from either the post-processed assembly or inferred from the phylogenetic trees are estimated. The Ks results are used to detect large-scale duplication events and many other evolutionary hypotheses (Module 4).
Figure 2
Figure 2
An illustration of an orthogroup multiple sequence alignment produced by the Galaxy PlantTribes2 GeneFamilyAligner tool using the test dataset. Results can be visualized in Galaxy with the MSAViewer visualization plugin and manually edited with Jalview Java Web Start.
Figure 3
Figure 3
An illustration of an orthogroup phylogenetic tree produced by the Galaxy PlantTribes2 GeneFamilyPhylogenyBuilder using the test dataset. Results can be visualized in Galaxy using either the Phylocanvas (demonstrated here) or the PHYLOViZ plugin.
Figure 4
Figure 4
An illustration of genome duplication events detected using the Galaxy PlantTribes2 KaKsAnalysis tool. The KaKs analysis tool produces a list of outputs including self blastn results (item 189), a list of paralogous pairs (item 190), Ka (non-synonymous) and Ks (synonymous) substitution rates (item 191), and the significant components in the Ks distribution (item 192). Then the distribution of estimated paralogous pair Ks values is clustered into components using a mixture of multivariate normal distributions to identify significant duplication event(s) (item 193) and is visualized using Galaxy built-in tools.
Figure 5
Figure 5
Summaries of performance evaluation of classification rates for BLAST and HMMER classifiers. Recall, precision, and F-score (Vihinen, 2012) for the two classifiers are measured on GFam (G), OrthoMCL (M), and OrthoFinder (F) clustering methods to determine how well taxa at different distances are classified into the PlantTribes2 22Gv1.1 gene family scaffold. Larger values are better. Distant: remove and sort back Physcomitrella patens, a species distantly related to all other scaffolding species; Moderately distant: remove Solanum lycopersicum and S. tuberosum, then sort back S. lycopersicum. No other Solanaceae species are present in the scaffold, but moderately distant species, i.e., other asterids, are used as scaffolding species; Confamilial: S. lycopersicum was removed and sorted back. A confamilial species, S. tuberosum, is present in the scaffold.
Figure 6
Figure 6
BUSCO completeness assessment of transcriptome assemblies to illustrate the results from targeted gene family assembly (meta-assembly) function in the PlantTribes2 AssemblyPostProcessor tool compared to Trinity approaches. Color bars indicate complete (blue), fragmented (orange), and missing (green) BUSCOs. Assemblies of parasitic plants, Phelipanche, Striga, and Triphysaria, examined include (1) developmental stage-specific assemblies (Stage, only the average of all the stages were shown in the plot), (2) assemblies combining all stage-specific raw data (Combined), and (3) meta-assembly of stage-specific assemblies and combined assembly (Meta) using AssemblyPostProcessor.
Figure 7
Figure 7
Identification of an incorrect auxin transporter gene model, MdPIN8a, in Malus domestica genome annotation version 1. Nucleotide sequence alignment of putative PIN8a and VDAC genes from 9 Rosaceae genomes were shown here. MDP0000250518 (sequence 1) gene model is a combination of two genes: The 5’ end of MDP0000250518 shares high sequence similarity with the PIN8a gene from other Rosaceae species (sequence 2 to 9), while its 3’ end shows evidence of homology to a neighboring gene, VDAC, in the investigated genomes (sequence 10 to 17). Green triangles below MDP0000250518 show the binding sites of the qRT-PCR primers used in the Song et al., 2016 research. Gray color indicates identical nucleotides compared to the consensus, while black color indicates different nucleotides. Genome abbreviations can be found in Supplemental Table 7 .
Figure 8
Figure 8
Example of a putative DWF4 gene before (red diamond) and after (yellow star) improvement. (A, B) show a section of the DWF4 gene family tree with Bartlett_DH gene models before and after improvement, respectively. (C) is the sequence alignment of the DWF4 gene coding region in Malus and Pyrus genomes. Gray color indicates identical nucleotides compared to the consensus, while colors indicate different nucleotides. Genome abbreviations can be found in Supplemental Table 7 .
Figure 9
Figure 9
CoRe OrthoGroups - Rosaceae (CROGs). (A) Upset plot showing overlapping orthogroups between six Rosaceae genera, including 9656 orthogroups shared by all six genera (designated as “CROGs – Rosaceae”). (B) High correlation between Rosaceae genome annotation BUSCOs and % CROGs captured in the genomes (p<0.01). (C) Z-score distribution of gene counts in CROGs among selected Rosaceae genomes excluding Malus and Pyrus, shown as a clustermap (upper) and a box plot (lower). Each column represents a genome and each row in the clustermap represents a CROG. (D) Z-score distribution of gene counts in CROGs among selected Malus and Pyrus genomes, shown as a clustermap (upper) and a box plot (lower). Genome abbreviations can be found in Supplemental Table 7 .
Figure 10
Figure 10
The gene count z-score of selected tree architecture gene families across Pyrus and Malus genomes. Pyrco_BPDH orthogroups have lower z-scores than most others, which is shown with a cooler color in the heatmap (A) and lower average z-score (green box in B), indicating fewer than expected gene counts. These missing genes were discovered after the targeted re-annotation process, which brought the average gene count z-score closer to 0 (yellow box in B) and comparable to other high-quality genomes. Genome abbreviations can be found in Supplemental Table 7 .

Similar articles

Cited by

References

    1. Altenhoff A. M., Levy J., Zarowiecki M., Tomiczek B., Vesztrocy A. W., Dalquen D. A., et al. . (2019). OMA standalone: Orthology inference among public and custom genomes and transcriptomes. Genome Res. 29, 1152–1163. doi: 10.1101/gr.243212.118 - DOI - PMC - PubMed
    1. Ashburner M., Ball C. A., Blake J. A., Botstein D., Butler H., Cherry J. M., et al. . (2000). Gene ontology: tool for the unification of biology. Nat. Genet. 25, 25–29. doi: 10.1038/75556 - DOI - PMC - PubMed
    1. Barrett T., Wilhite S. E., Ledoux P., Evangelista C., Kim I. F., Tomashevsky M., et al. . (2013). NCBI GEO: archive for functional genomics data sets - update. Nucleic Acids Res. 41, D991–D995. doi: 10.1093/nar/gks1193 - DOI - PMC - PubMed
    1. Bel M. V., Silvestri F., Weitz E. M., Kreft L., Botzki A., Coppens F., et al. . (2021). PLAZA 5.0: Extending the scope and power of comparative and functional genomics in plants. Nucleic Acids Res. 50, D1468–D1474. doi: 10.1093/nar/gkab1024 - DOI - PMC - PubMed
    1. Berardini T. Z., Reiser L., Li D., Mezheritsky Y., Muller R., Strait E., et al. . (2015). The arabidopsis information resource: Making and mining the “gold standard” annotated reference plant genome. Genesis 53, 474–485. doi: 10.1002/dvg.22877 - DOI - PMC - PubMed

LinkOut - more resources