

Nucleotide-Binding Oligomerization Domain (NOD)-Like Receptor Subfamily C (NLRC) as a Prognostic Biomarker for Glioblastoma Multiforme Linked to Tumor Microenvironment: A Bioinformatics, Immunohistochemistry, and Machine Learning-Based Study
- PMID: 36798872
- PMCID: PMC9926983
- DOI: 10.2147/JIR.S397305
Nucleotide-Binding Oligomerization Domain (NOD)-Like Receptor Subfamily C (NLRC) as a Prognostic Biomarker for Glioblastoma Multiforme Linked to Tumor Microenvironment: A Bioinformatics, Immunohistochemistry, and Machine Learning-Based Study
Abstract
Purpose: Glioblastoma multiforme (GBM) remains the deadliest primary brain tumor. We aimed to illuminate the role of nucleotide-binding oligomerization domain (NOD)-like receptor subfamily C (NLRC) in GBM.
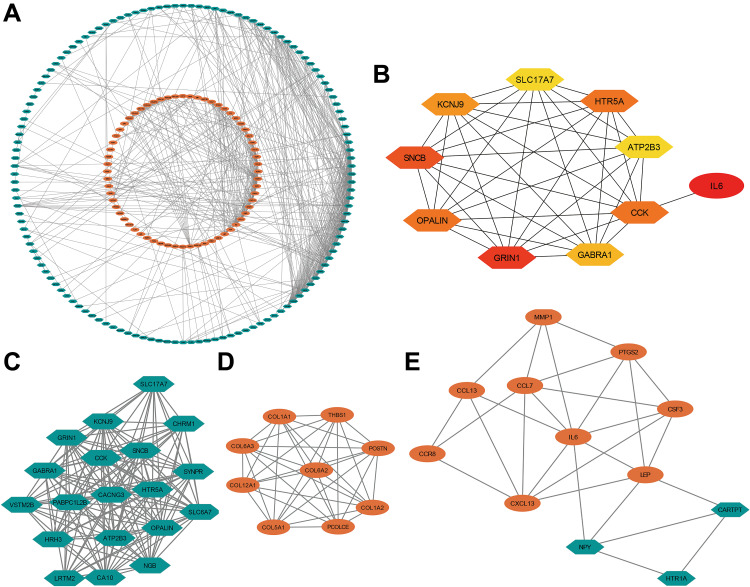
Patients and methods: Based on public database data (mainly The Cancer Genome Atlas [TCGA]), we performed bioinformatics analysis to visually evaluate the role and mechanism of NLRCs in GBM. Then, we validated our findings in a glioma tissue microarray (TMA) by immunohistochemistry (IHC), and the prognostic value of NOD1 was assessed via random forest (RF) models.
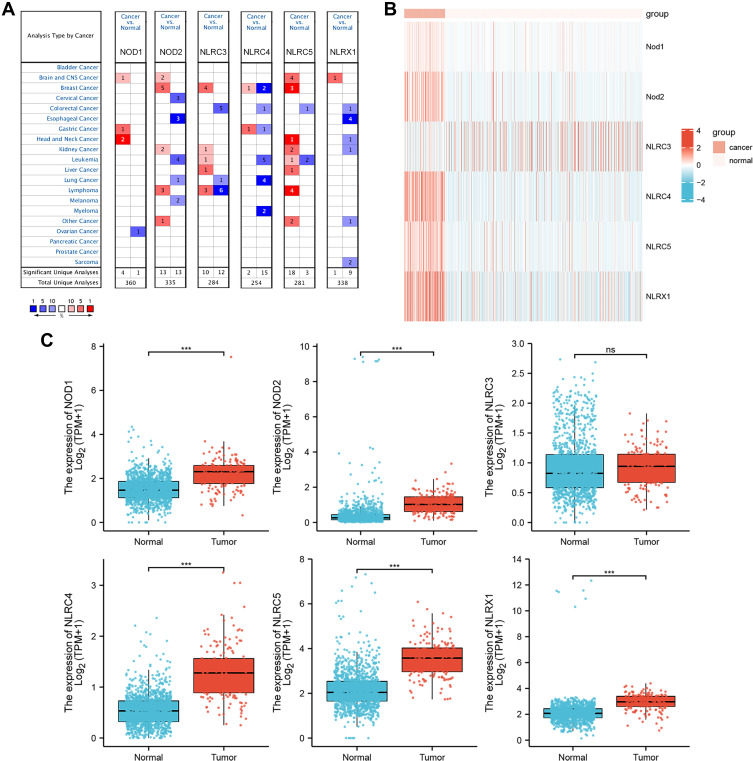
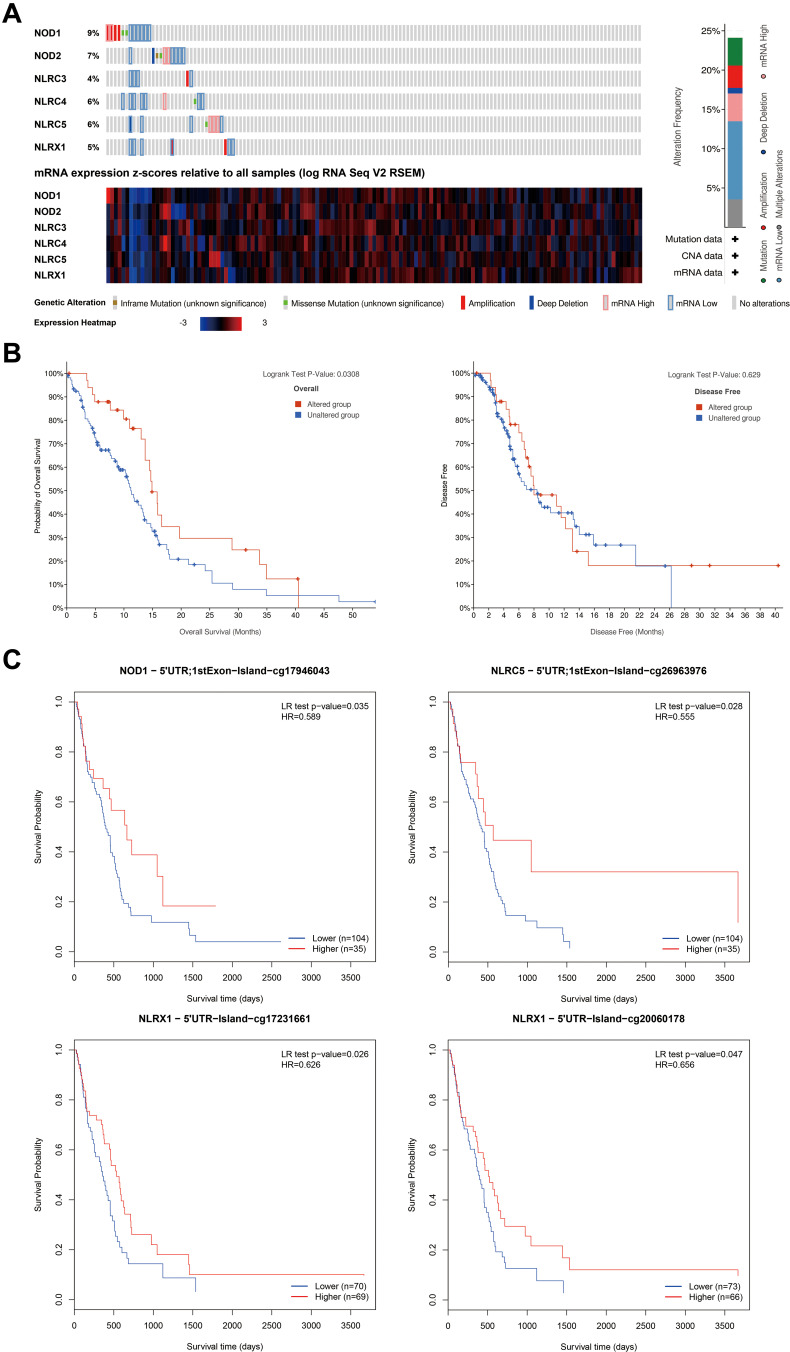
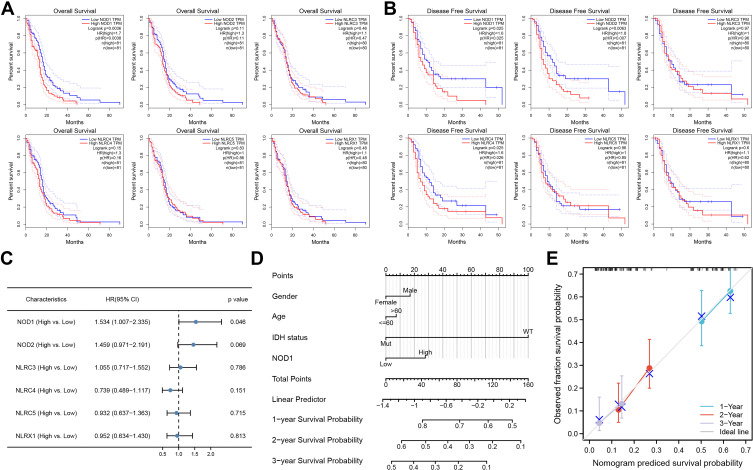
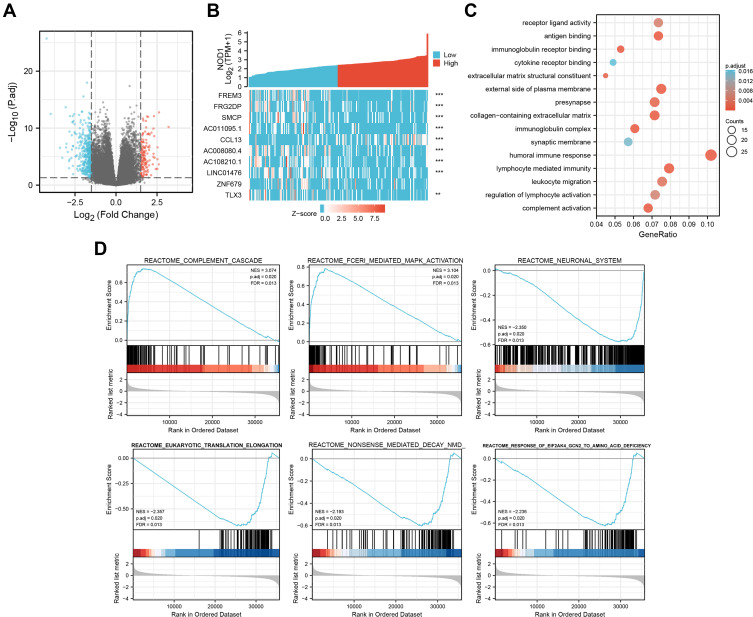
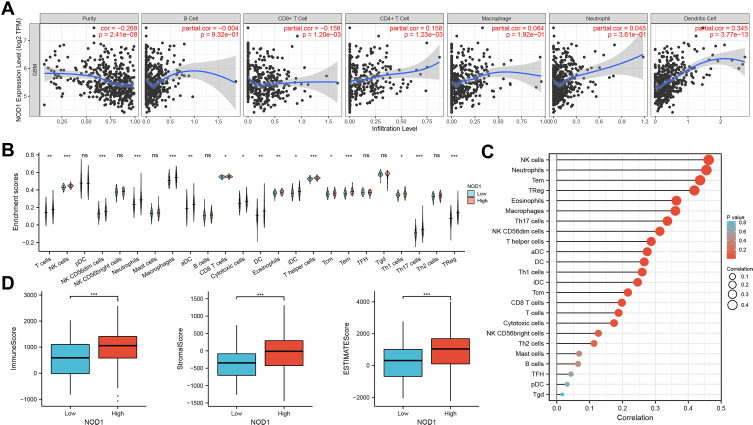
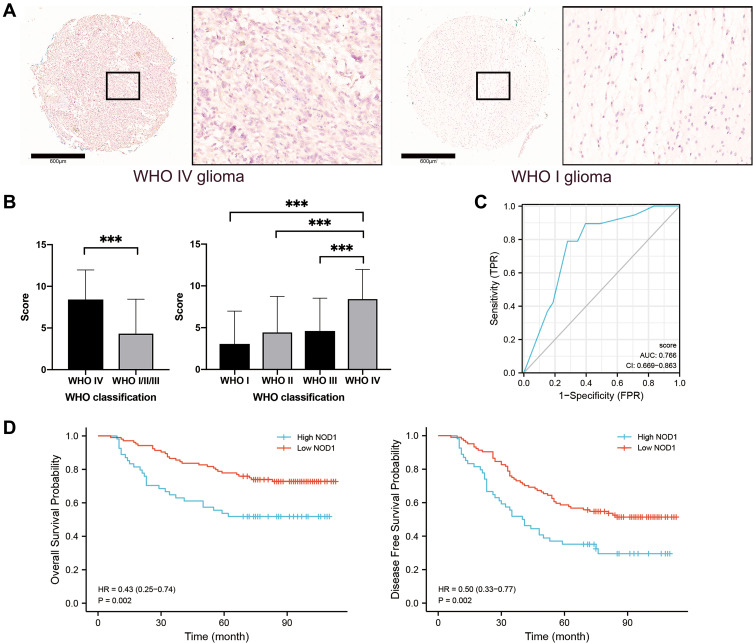
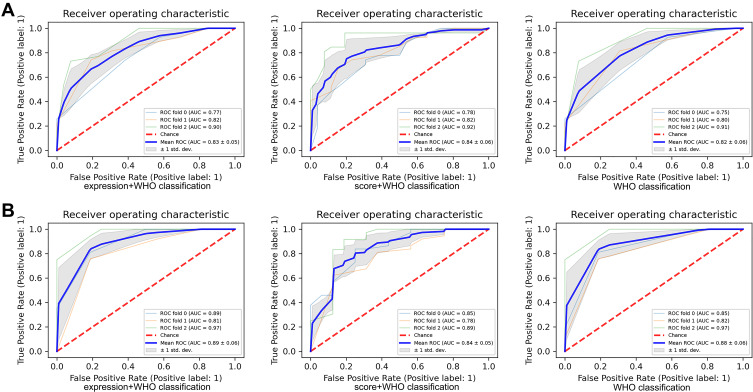
Results: In GBM tissues, the expression of NLRC members was significantly increased, which was related to the low survival rate of GBM. Additionally, Cox regression analysis revealed that the expression of NOD1 (among NLRCs) served as an independent prognostic marker. A nomogram based on multivariate analysis proved the effective predictive performance of NOD1 in GBM. Enrichment analysis showed that high expression of NOD1 could regulate extracellular structure, cell adhesion, and immune response to promote tumor progression. Then, immune infiltration analysis showed that NOD1 overexpression correlated with an enhanced immune response. Then, in a glioma TMA, the results of IHC revealed that the increase in NOD1 expression indicated high recurrence and poor prognosis of human glioma. Furthermore, the expression level of NOD1 showed good prognostic value in the TMA cohort via RF.
Conclusion: The value of NOD1 as a biomarker for GBM was demonstrated. The possible mechanisms may lie in the regulatory role of NLRC-related pathways in the tumor microenvironment.
Keywords: NLRC family; biomarker; glioblastoma multiforme; prognostic model; tissue microarray; tumor microenvironment.
© 2023 Han et al.
Conflict of interest statement
The authors report no conflicts of interest in this work.
Figures
Similar articles
-
High expression of nucleotide-binding oligomerization domain protein 1 correlates with poor prognosis and immune cell infiltration in Glioblastoma Multiforme patients.Discov Oncol. 2025 Jan 11;16(1):32. doi: 10.1007/s12672-025-01786-y. Discov Oncol. 2025. PMID: 39798050 Free PMC article.
-
GRN is a prognostic biomarker and correlated with immune infiltration in glioma: A study based on TCGA data.Front Oncol. 2023 Apr 6;13:1162983. doi: 10.3389/fonc.2023.1162983. eCollection 2023. Front Oncol. 2023. PMID: 37091137 Free PMC article.
-
Integrative Analysis of Neuregulin Family Members-Related Tumor Microenvironment for Predicting the Prognosis in Gliomas.Front Immunol. 2021 May 13;12:682415. doi: 10.3389/fimmu.2021.682415. eCollection 2021. Front Immunol. 2021. PMID: 34054873 Free PMC article.
-
Systematic identification, development, and validation of prognostic biomarkers involving the tumor-immune microenvironment for glioblastoma.J Cell Physiol. 2021 Jan;236(1):507-522. doi: 10.1002/jcp.29878. Epub 2020 Jun 22. J Cell Physiol. 2021. PMID: 32572951
-
Bioinformatics analysis of SH2D4A in glioblastoma multiforme to evaluate immune features and predict prognosis.Transl Cancer Res. 2024 Aug 31;13(8):4242-4256. doi: 10.21037/tcr-23-2000. Epub 2024 Aug 23. Transl Cancer Res. 2024. PMID: 39262462 Free PMC article.
Cited by
-
High expression of nucleotide-binding oligomerization domain protein 1 correlates with poor prognosis and immune cell infiltration in Glioblastoma Multiforme patients.Discov Oncol. 2025 Jan 11;16(1):32. doi: 10.1007/s12672-025-01786-y. Discov Oncol. 2025. PMID: 39798050 Free PMC article.
-
Artificial Intelligence-Assisted Drug and Biomarker Discovery for Glioblastoma: A Scoping Review of the Literature.Cancers (Basel). 2025 Feb 7;17(4):571. doi: 10.3390/cancers17040571. Cancers (Basel). 2025. PMID: 40002166 Free PMC article. Review.
-
Analysis of transcription profiles for the identification of master regulators as the key players in glioblastoma.Comput Struct Biotechnol J. 2024 Sep 28;23:3559-3574. doi: 10.1016/j.csbj.2024.09.022. eCollection 2024 Dec. Comput Struct Biotechnol J. 2024. PMID: 39963421 Free PMC article.
-
Advances on the therapeutic potential of cell receptor activation in glioblastoma.Mol Biol Rep. 2025 Feb 5;52(1):207. doi: 10.1007/s11033-025-10312-w. Mol Biol Rep. 2025. PMID: 39907852 Review.
-
Association of NLRC4 inflammasome targeting Caspase1 to regulate monocyte pyroptosis involved in ankylosing spondylitis pathogenesis.Clin Rheumatol. 2025 Jul 10. doi: 10.1007/s10067-025-07573-y. Online ahead of print. Clin Rheumatol. 2025. PMID: 40637912
References
-
- Batash R, Asna N, Schaffer P, Francis N, Schaffer M. Glioblastoma multiforme, diagnosis and treatment; recent literature review. Curr Med Chem. 2017;24(27):3002–3009. - PubMed
-
- Muir M, Gopakumar S, Traylor J, Lee S, Rao G. Glioblastoma multiforme: novel therapeutic targets. Expert Opin Ther Targets. 2020;24(7):605–614. - PubMed
LinkOut - more resources
Full Text Sources
