. 2023 Mar;62(3):38.
doi: 10.3892/ijo.2023.5486. Epub 2023 Feb 17.

Zinc finger protein‑like 1 is a novel neuroendocrine biomarker for prostate cancer

Affiliations

Zinc finger protein‑like 1 is a novel neuroendocrine biomarker for prostate cancer

Neshat Masud et al. Int J Oncol. 2023 Mar.

Retraction in

Abstract

Prostate‑derived calcitonin (CT) and its receptor induce tumorigenicity and increase metastatic potential of prostate cancer (PC). CT‑inducible genes in human prostate were identified by subtraction hybridization. Among these genes, zinc finger protein like 1 (ZFPL1) protein was interesting since it was abundantly expressed in malignant prostates but was almost absent in benign prostates. ZFPL1 expression was upregulated by CT and androgens, and ZFPL1 protein was secreted by prostate tumor cells through exosomal secretion. Serum levels of ZFPL1 in cancer patients were at least 4‑fold higher than those in the sera of cancer‑free individuals. Cell biology of ZFPL1 suggests its localization in Golgi bodies and exosomes, and its colocalization with chromogranin A and CD44. These results suggested that ZFPL1 is secreted by tumor cells of neuroendocrine (NE)/stem cell phenotype. The knockdown of endogenous ZFPL1 in (PC) cells led to a remarkable decrease in cell proliferation, and invasion while increasing their apoptosis. As expected, the overexpression of ZFPL1 in prostate cells had an opposite effect on these functions. The knockdown of ZFPL1 in PC cells also decreased Akt phosphorylation, suggesting the actions of ZFPL1 may be mediated through the PI3K‑Akt pathway. Moreover, the present results revealed that ZFPL1 is released by tumors cells of NE or androgen‑independent phenotype and its serum levels are significantly higher in cancer patients, suggesting that it may serve as a blood‑based non‑invasive biomarker of aggressive PC.

Keywords: calcitonin; cancer marker; neuroendocrine; prostate cancer; zinc finger protein like 1.


Conflict of interest statement

The authors declare that they have no competing interests.

Figures
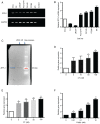
Figure 1
Figure 1
ZFPL1 gene expression in PC cells and its regulation. (A) The representative agarose gel showed the presence of amplified ZFPL1 mRNA following RT-qPCR reaction in several PC cell lines. (B). Relative ZFPL1 mRNA abundance in PC cell lines as measured by RT-qPCR. The ZFPL1 mRNA levels of PC3 cells were set at 1.0. (C) Identification of ZFPL1 protein in prostate cells by western blot analysis. The position of the protein band of ZFPL1 immunoprecipitates in left lane was consistent with the expected molecular size of ZFPL1 (34.1 kDa). The right lane showed Dextran Blue molecular size markers (Bio-Rad Laboratories, Inc.). (D) The bar graph presented the mean relative ZFPL1 mRNA abundance ± SEM (n=3) in LNCaP-C4 cells after treatment with CT (0, 5, 10, 50 and 100 nM). The control was set as 1.0. (E). The bar graph revealed the mean relative ZFPL1 mRNA abundance ± SEM (n=3) in PC3-CTR cells after treatment with increasing concentrations of CT (0, 5, 10, 50 and 100 nm). (F). The bar graph showed the dose-dependent increase in relative ZFPL1 mRNA abundance in LNCaP-C4 cells (mean ± SEM of n=3) in response to synthetic androgen R1881. *P<0.05 and **P<0.0001 (significantly different from the control, ordinary One-Way ANOVA and Tukey's multiple comparison test). ZFPL1, zinc finger protein like 1; PC, prostate cancer; RT-qPCR, reverse transcription-quantitative PCR; CT, calcitonin.
Figure 2
Figure 2
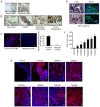
ZFPL1 expression in normal human tissues and primary PC. (A) The bar graph presented the mean ± SEM (n=6) percentage of ZFPL1 immunopositive cell populations per field (magnification, ×400) in various normal human organs. (B) Representative photomicrographs of ZFPL1-immunopositive cells in normal human organ sections showing ZFPL1-immunopositive cells along with a normal prostate, which is ZFPL1 immuno-negative. Photomicrographs of other ZFPL1-negative organs are shown in Fig. S1. (C) The bar graph represented relative ZFPL mRNA abundance in normal, BPH and PC tissues with different Gleason score. (D) Data extracted from TCGA and Oncomine portals showing upregulation of ZFPL1 gene expression in PC. *P<0.05 (significantly different from the normal prostate, ordinary One-Way ANOVA and Tukey's multiple comparison test). ZFPL1, zinc finger protein like 1; PC, prostate cancer; BPH, benign prostatic hyperplasia.
Figure 3
Figure 3
ZFPL1 expression in the primary PC. (A) The photomicrographs demonstrated the specificity of in situ hybridization. A PC section was treated with sense ZFPL1 siRNA probe (left) or antisense ZFPL1 siRNA probe (right). Only antisense probe hybridized with the PC specimen (right). (Scale bar=100 µm). (B) The photomicrographs depicted ZFPL1 mRNA expression in prostate sections of different cancer stages in comparison with non-cancer specimens (Scale bar=50 µm). (C) The representative photomicrographs revealed the presence of ZFPL1-immunopostive cells (red) in a PC prostate section and its matched normal tissue (Scale bar=50 µm). Nuclear stain is DAPI (74). The adjacent bar graph presents the mean percentage (n=6) of ZFPL1 immunopositive cells per field (magnification, ×400) in PC vs. matched normal prostate tissue. *P<0.0001 (paired t-test). (D) The photomicrographs on the left showed H&E staining of human PC tissue sample, while those on the right show ZFPL1 (green) and nuclear DAPI (74) (Scale bar=50 µm). White arrows point to the cancerous areas in all photomicrographs. (E) The representative photomicrographs revealed ZFPL1-immunopsitive cells (Red) and nuclear DAPI (74) in different samples of a US Biomax PC tissue microarray (Scale bar=50 µm). (F) The bar graph presented the quantitated data of a PC tissue microarray. The mean ± SEM (n=6) IHC index of each specimen in the microarray was calculated and plotted against the stage of PC. The mean IHC index of each cancer group except T1N0MO was significantly different from control. *P<0.005 (One Way ANOVA and Tukey's multiple comparison test). ZFPL1, zinc finger protein like 1; PC, prostate cancer; IHC, immunohistochemistry.
Figure 4
Figure 4
Co-localization of ZFPL1 with CgA and CD44. (A) The representative photomicrographs in upper panels showed colocalization of ZFPL1 (green) and CgA (red) in PC3-CTR cells, and the lower panels presented the same in primary PC specimens (Scale bar=50 µm). (B) The representative photomicrographs in upper panels showed colocalization of ZFPL1 (green) and CD44 in PC3-CTR cells, and the lower panels revealed the same in primary PC specimens (Scale bar=50 µm). ZFPL1, zinc finger protein like 1; CgA, chromogranin A; PC, prostate cancer.
Figure 5
Figure 5
Subcellular localization of ZFPL1 in exosomes of PC cells. (A) Representative photomicrographs showed the colocalization of ZFPL1 (green) and exosome CD81 (red) in PC3-CTR and LNCaP PC cells (Scale bar=25 µm). (B) Representative photomicrographs revealed the colocalization of ZFPL1 (green) and exosome/scretosome maker CD63 (red) (Scale bar=25 µm). Cell borders were traced to show the location of exosomes with respect to a cell. Inset showed the magnified image (magnification, ×1,000) of the location pointed by the arrow. (C) Representative photomicrographs showed the colocalization of ZFPL1 (green) and Golgi body marker GM130 (red) (Scale bar=25 µm). (D) Representative immunoblot revealed the co-precipitation of CD81 with ZFPL1 in the exosomal isolates of PC3-CTR and LNCaP-C4 PC cells. β-actin is the loading control. ZFPL1, zinc finger protein like 1; PC, prostate cancer.
Figure 6
Figure 6
Modulation of ZFPL1 expression in PC3-CTR and LNCaP-C4 prostate cancer cells. (A) The immunoblots showed the comparative efficacy of three siRNAs against ZFPL1 to suppress ZFPL1 protein levels in PC3-CTR and LNCaP-C4 cells by western blot analysis. β-actin was used as a housekeeping control. (B) An immunoblot demonstrated that the transfection of ZFPL1 expression plasmid in PC3-CTR and LNCaP-C4 cells led to an increase in ZFPL1 protein levels in both cell lines. β-actin was used as a housekeeping control. ZFPL1, zinc finger protein like 1; si-, small interfering; ov, overexpression. *P<0.05.
Figure 7
Figure 7
ZFPL1 and PC cell proliferation and apoptosis. (A) The bar graph showed the effect of ±10 nM CT on proliferation of PC-3CTR cells that received either non-sense siRNA or ZFPL1 siRNA. The data are presented as the mean OD595 ± SEM (n=4)., *P<0.05 and ***P<0.0001 vs. the control receiving non-sense siRNA (unpaired t-test); ^^^P<0.0001 vs. +CT receiving non-sense siRNA (unpaired t-test). (B) The representative photomicrographs demonstrated the effect of either non-sense (control) or ZFPL1 siRNA (1, 2 or 3) ± CT on cleaved caspase 3 expression in PC3-CTR and LNCaP-C4 cells. The micrographs in the upper panel showed nuclear cleaved caspase 3 staining in untreated or CT-treated PC3-CTR cells, which received either non-sense siRNA or ZFPL1 siRNA. The LNCaP-C4 cells in the lower panels received the same treatment. Blue color of DAPI stain showed the nucleus (Scale bar=100 µm). (C) The bar graphs presented the pooled data of four separate experiments of performed with LNCaP-C4 and PC3-CTR cell lines. The graph presented the number of cleaved caspase 3-postive cells per field (magnification, ×400) against ± CT treatment. Each cell line was transfected with either non-sense siRNA (C), ZFPL1 siRNA, ZFPL siRNA2 or ZFPL1 siRNA3. *P<0.05, **P<0.001 significantly different from +CT of its own group. ^P<0.05 significantly different from the corresponding non-sense siRNA control (One way ANOVA and Tukey's multiple comparison test). (D) The representative photomicrographs in first four pairs of micrographs showed the expression of cleaved caspase 3 (green) in PC3-CTR and LNCaP-C4 cells expressing carrier plasmid. The cells also received either vehicle, DEX (10 µM), CT (10 nM) or DEX + CT. DAPI stain was shown in Blue (Scale bar=100 µm). The next four pairs of representative photomicrographs revealed the expression of cleaved caspase 3 in PC3-CTR and LNCaP-C4 cells overexpressing ZFPL1 (Scale bar=100 µm). The cells were treated as aforementioned (Scale bar=100 µm). (E) The bar graphs presented the pooled data of four separate experiments. The mean number ± SEM of cleaved caspase 3-labeled cells per field (magnification, ×400) were plotted against the treatment + CT ± DEX. *P<0.05, vs. DEX + CT; xP<0.001 vs. ZFPL1-overexpression (One way ANOVA and Tukey's multiple comparison test); ^Significantly different from C (p<0.05 ordinary one-way ANOV A and Tukey's multiple comparison test). (F) Representative photomicrographs show localization of cleaved caspase-3 staining in nuclei of LNCaP-C4 cells (Scale bar=25 µm). ZFPL1, zinc finger protein like 1; PC, prostate cancer; CT, calcitonin; si-, small interfering; DEX, dexamethasone; ov, overexpression.
Figure 8
Figure 8
Effect of ZFPL1 knockdown/overexpression on invasion of PC cells. (A) The representative photomicrographs showed the effect of ±10 nM CT on invasiveness of PC3-CTR cells receiving either non-sense siRNA or ZFPL1 siRNA (1, 2 or 3) (Scale bar=50 µm). (B) The bar graphs revealed the pooled data of four separate invasion assays presented as the mean ± SEM number of invading cells per field (magnification, ×400) with PC3-CTR and LNCaP-C4 cells receiving either non-sense siRNA, siRNA1, siRNA2 or siRNA 3. *P<0.05, **P<0.001 and ***P<0.0001 (-CT vs. +CT in each group); ^P<0.01 (non-sense siRNA vs. ZFPL1 siRNA; ^^P<0.001 (non-sense siRNA vs. ZFPL1 siRNA), One way ANOVA and Tukey's multiple comparison test). (C) The representative photomicrographs of the upper panel revealed the effect of ±10 nM CT on invasiveness of LNCaP-C4 and PC3-CTR cells expressing either carrier pCMV5-XL4 plasmid or the plasmid with ZFPL1 expression plasmid (Scale bar=50 µm). (D) The bar graphs showed pooled data (mean ± SEM) of four separate invasion assays with PC3-CTR and LNCaP-C4 cells, respectively. *P<0.05, **P<0.001 and ***P<0.0001 (-CT vs. +CT); ^P<0.05 (CT vs. OV + CT; One way ANOVA and Tukey's multiple comparison tests). (E) Representative photomicrographs of wound healing assays for cell migration of PC3-CTR cells transfected with ZDPL1 siRNA3 (siRNA-Row 2) or ZFPL1 expression vector (OVER-Row 4) and treated with ± CT (10 nM). (F) The bar graphs demonstrated pooled data (mean ± SEM) of number of migratory cells migrated in a wound (magnification, ×100) in four separate wound healing assays. *P<0.05 (C vs. treated for each group, i.e. either siRNA or overexp). ^P<0.05 (overexp vs. overexp + CT), One Way ANOVA and Tukey's multiple comparison test. ZFPL1, zinc finger protein like 1; PC, prostate cancer; CT, calcitonin; si-, small interfering; ov, overexpression.
Figure 9
Figure 9
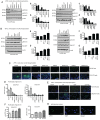
Effect of ZFPL1 knockdown on Akt phosphorylation. (A) The representative immunoblot on the left showed the effect of ±10 nM CT on p-Akt473 and p-Akt308 proteins in PC3-CTR cells receiving either non-sense (control) siRNA or ZFPL1 siRNA1, ZFPL siRNA2 or ZFPL1 siRNA3. Total Akt was used as a control protein. β-actin was used as the loading control. A1 and A2 are the normalized bar graphs (pAkt/total Akt) of densitometric quantitation of immunoblots on the left. A representative immunoblot on the right showed the effect of ±10 nM CT on p-Akt473 and p-Akt308 proteins in LNCaP-C4 cells receiving either non-sense (control) siRNA or ZFPL1 siRNA1, ZFPL siRNA2 or ZFPL1 siRNA3. Akt was used as a control protein. β-actin provided the loading control. 9A3 and 9A4 are the normalized bar graphs (p-Akt/total Akt) of densitometric quantitation of immunoblots on the right. *P<0.05 vs. control and ^P<0.05 vs. siRNA + CT. One Way ANOVA and Tukey's multiple comparison test. (B) A representative immunoblot on the left showed the effect of ± 10 nM CT on p-Akt473 and p-Akt308 proteins in PC3-CTR cells transfected with either carrier plasmid or ZFPL1 expression plasmid, respectively. Akt was used as a control protein. B1 and B2 are the normalized densitometric bar graphs (p-Akt/total Akt) of immunoblots on the left. β-actin was used as the loading control. *P<0.05 vs. control. One Way ANOVA and Tukey's multiple comparison test. A representative immunoblot on the right showed the effect of ±10 nM CT on pAkt473 and pAkt308 proteins in LNCaP-C4 cells transfected with either carrier plasmid or ZFPL1 expression plasmid respectively. Akt was used as a control protein. β-actin was used as the loading control. 9B3 and 9B4 are the normalized densitometric bar graphs (p-Akt/total Akt) of immunoblots on the right. *P<0.05 (Significantly different from the control. One Way ANOVA and Tukey's multiple comparison test. (C) ZFPL1 and Akt phosphorylation by ICC: The representative photomicrographs showing the effect of ±10 nM CT on pAkt staining (red) in LNCaP-C4 and PC3-CTR cells receiving either non-sense or ZFPL1 siRNA (1, 2 or 3). Blue color is of DAPI (Scale bar=50 µm). (D) The pooled data of four separate experiments of with PC3-CTR and LNCaP-C4 cells receiving non-sense or ZFPL1 siRNAs. The data is presented as the mean ± SEM number of p-Akt-immuno positive cells per field (magnification, ×100) of PC3-CTR and LNCaP cells receiving either non-sense siRNA (control) or ZFPL1 siRNAs 1, 2 or 3 in that order. *P<0.05 (control vs CT in each group, One way ANOVA and Tukey's multiple comparison test); ^p<0.05, siRNA treatment significantly different from vehicle control (One Way ANOVA and Tukey's multiple comparison test). (E) The representative photomicrograph showed the effect of ±10 nM CT on p-Akt-immunopositive cells per field (magnification, ×400; green) in PC3-CTR cells expressing either carrier plasmid or ZFPL-overexpression plasmid (Scale bar=50 µm). (F) The pooled data of four separate experiments of with PC3-CTR and LNCaP-C4 cells expressing either carrier plasmid (C) or ZFPL1 overexpression plasmid (OV). The data is presented as the mean p-Akt ICC Index per field ± SEM (magnification, ×100). *P<0.05 (+ CT vs. OV + CT) and ^P<0.05 (C vs. OV); One way ANOVA and Tukey's Multiple comparison test. (G) Representative photomicrographs at higher magnification (×1,000) showed the nuclear localization of pAKT (green). Nuclear DAPI is blue (Scale bar=25 µm). ZFPL1, zinc finger protein like 1; p-, phosphorylated; si-, small interfering; CT, calcitonin; ICC, immunocytochemistry; ov, overexpression.
Figure 10
Figure 10
Comparative profiles of ZFPL1 and PSA levels in human serum samples. The left scattergram presented serum ZFPL1 levels (ng/ml) in samples obtained from normal and prostate cancer patients while the right scattergram showed serum PSA levels (ng/ml) in the same cohort. The data was analyzed by unpaired t-test (normal vs. cancer). ZFPL1, zinc finger protein like 1; PSA, prostate-specific antigen.

References

    1. Zhai Z, Zheng Y, Li N, Deng Y, Zhou L, Tian T, Yang S, Hao Q, Song D, Wu Y, et al. Incidence and disease burden of prostate cancer from 1990 to 2017: Results from the Global Burden of Disease Study 2017. Cancer. 2020;126:1969–1978. doi: 10.1002/cncr.32733. - DOI - PubMed
    1. Giona S. The Epidemiology of Prostate Cancer. Prostate Cancer Exon Publications; Australia: 2021. pp. 1–16. - PubMed
    1. Liu Y, Hegde P, Zhang F, Hampton G, Jia S. Prostate cancer-a biomarker perspective. Front Endocrinol (Lausanne) 2012;3:72. doi: 10.3389/fendo.2012.00072. - DOI - PMC - PubMed
    1. Christensen E, Evans KR, Menard C, Pintilie M, Bristow RG. Practical approaches to proteomic biomarkers within prostate cancer radiotherapy trials. Cancer Metastasis Rev. 2008;27:375–385. doi: 10.1007/s10555-008-9139-6. - DOI - PubMed
    1. Schroder FH, Hugosson J, Carlsson S, Tammela T, Määttänen L, Auvinen A, Kwiatkowski M, Recker F, Roobol MJ. Screening for prostate cancer decreases the risk of developing metastatic disease: Findings from the European Randomized study of screening for prostate cancer (ERSPC) Eur Urol. 2012;62:745–752. doi: 10.1016/j.eururo.2012.05.068. - DOI - PubMed

Publication types