. 2023 Jan-Dec;15(1):2178800.
doi: 10.1080/19490976.2023.2178800.

Limosilactobacillus reuteri normalizes blood-brain barrier dysfunction and neurodevelopment deficits associated with prenatal exposure to lipopolysaccharide

Affiliations

Limosilactobacillus reuteri normalizes blood-brain barrier dysfunction and neurodevelopment deficits associated with prenatal exposure to lipopolysaccharide

Jing Lu et al. Gut Microbes. 2023 Jan-Dec.

Abstract

Maternal immune activation (MIA) derived from late gestational infection such as seen in chorioamnionitis poses a significantly increased risk for neurodevelopmental deficits in the offspring. Manipulating early microbiota through maternal probiotic supplementation has been shown to be an effective means to improve outcomes; however, the mechanisms remain unclear. In this study, we demonstrated that MIA modeled by exposing pregnant dams to lipopolysaccharide (LPS) induced an underdevelopment of the blood vessels, an increase in permeability and astrogliosis of the blood-brain barrier (BBB) at prewean age. The BBB developmental and functional deficits early in life impaired spatial learning later in life. Maternal Limosilactobacillus reuteri (L. reuteri) supplementation starting at birth rescued the BBB underdevelopment and dysfunction-associated cognitive function. Maternal L. reuteri-mediated alterations in β-diversity of the microbial community and metabolic responses in the offspring provide mechanisms and potential targets for promoting BBB integrity and long-term neurodevelopmental outcomes.

Keywords: Maternal inflammation; blood–brain barrier; lipopolysaccharide; probiotics.


Conflict of interest statement

No potential conflict of interest was reported by the author(s).

Figures
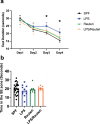
Figure 1.
Figure 1.
Maternal L. reuteri supplementation during lactation rescued spatial learning deficit induced by maternal LPS exposure. (a) Significant difference during training at 12 weeks was found among SPF (n = 26), LPS (n = 11), L. reuteri (n = 8) and LPS/L. reuteri (n = 7) groups. SPF, L. reuteri and LPS/L. reuteri mice had significantly higher learning curve slopes than LPS by repeated measurement ANOVA. At training days 3 and 4, LPS mice took significantly more time to locate the escape platform than the mice of the other three treatment groups. Asterisks indicate significant differences of p-value at least <0.05. (b) Time in the platform quadrant during the probe trial was not different among the four treatment groups.
Figure 2.
Figure 2.
L. reuteri supplementation starting at birth reversed gestational LPS-induced vascular development deficits and hyperpermeability of the BBB in the offspring. Treatment did not affect (a) body weights or (b) total brain volume. (c) Maternal LPS significantly decreased the brain vascular volume compared to the saline control group and L. reuteri supplementation during lactation significantly minimized the LPS-induced vascular volume deficit (n = 5,8,7,6, respectively). Bars with ⊓ denote significant difference between experimental groups (****p < .0001, one-way ANOVA). (d) Baseline T1 values (seconds) were not different among the treatment groups. (e) Maternal LPS significantly increased the BBB permeability compared to the saline control offspring group and L. reuteri supplementation during lactation significantly minimized the LPS-induced BBB hyperpermeability. Quantification of permeability was derived from baseline T1 and post contrast (gd) T1 values. Permeability is presented as ΔT1 (baseline T1-post contrast T1)/vessel volume. Bars with ⊓ denote significant difference between experimental groups (****p < .0001, one-way ANOVA). (f) Representative T2W and T1 images of brains. Panels represent treatment groups (A) SPF, (B) LPS, (C) L. reuteri, and (D) LPS/L. reuteri. 1st row (gray) -Three middle slices of T2W brain images; 2nd row – measured mouse brain T1 maps before contrast agent injection; 3rd row – measured mouse brain T1 maps 25 minutes after contrast agent injection. The color bar underneath the maps shows scales (value) of the T1 map. (g) Representative images of mouse brain blood vessels (red color) obtained from the TOF datasets superimposed over T2W images (gray). Panels represent treatment groups (A) SPF, (B) LPS, (C) L. reuteri, and (D) LPS/L. reuteri. For visual inspection, Maximum Intensity Projection (MIP) image shown in the right column was generated from TOF datasets. The MIP connects the high intensity dots of the blood vessels in three dimensions.
Figure 3.
Figure 3.
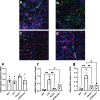
Astrogliosis in 2-week-old offspring induced by maternal LPS was reduced by maternal L. reuteri supplementation. Representative images of fluorescence microscopy of claudin-5 (location of the brain capillaries, red), GFAP astrocyte (green), and DAPI (nuclei, blue). Seven to ten sections per mouse of three mice were inspected in each group. Stronger than control SPF GFAP staining (a) was observed around the blood vessel and in the brain with maternal LPS insult (b). Maternal supplemented of L. reuteri (c) without or (d) with maternal LPS had GFAP levels similar to the control group. Based on quantification of astrocyte activation using ImageJ (NIH), (e) Overall expression of claudin-5 was not affected by treatment. (f) GFAP expression in the vicinity of the blood vessel and (g) GFAP expression in the brain were expressed as GFAP integral density (IntDen) levels over claudin-5 levels. Bars with ⊓ denote significant difference between experimental groups (all n = 3, at least p < .05).
Figure 4.
Figure 4.
Relative abundance of bacterial communities among the treatment groups. (a) Relative abundance at phylum level of 2 (top) and 12 (bottom) weeks old fecal samples. (b) Relative abundance at family level of 2 (top) and 12 (bottom) weeks old fecal samples (all n = 5).
Figure 5.
Figure 5.
α-diversity and Bray-Curtis principal component analysis of fecal microbiota. α-diversity metrics of (a) observed, chao1, and Shannon diversity of 2- and 12-week-old mouse fecal samples calculated using R package. No significant difference was found among the treatment groups in any of the metrics. Principal component analysis (PCoA) scores are plotted based on the relative abundance of fecal microbiota at the genus level of (b) 2- and (c) 12-week-old mouse fecal samples. The percentage of variation explained by the principal component is indicated on the axis. A. SPF B. LPS C. Reuteri D. LPS/Reuteri. Significant separation in the gut microbiome composition (β-diversity) was observed among different treatment groups (all n = 5) by PERMANOVA (p = .001).
Figure 6.
Figure 6.
Principal component analysis and heatmap of serum and brain metabolite profiles at 2 weeks of age. Principal component analysis (PCoA) scores are plotted based on the normalized peak area of (a) serum and (b) brain metabolites of 2-week-old mice. A Hierarchical clustering was applied to arrange the metabolites based on the similarity of the abundance among samples. For 2-week-old samples, (c) 77 significantly different serum features and (d) 88 significantly different brain features were plotted (One-way ANOVA test with Benjamini–Hochberg method-adjusted p value <.05, all n = 3).
Figure 7.
Figure 7.
Principal component analysis and heatmap of serum and brain metabolite profiles at 12 weeks of age. Principal component analysis (PCoA) scores are plotted based on the normalized peak area of (a) serum and (b) brain metabolites of 12-week-old mice. For 12-week-old samples, top 100 features by ANOVA were plotted for (c) serum and (d) brain samples with * indicating a significant difference among the four treatment groups (One-way ANOVA test with Benjamini–Hochberg method-adjusted p value <.05, all n = 4).
Figure 8.
Figure 8.
Significantly different metabolic features between the serum and brain pool. Features were presented using their putatively identified names. (a) Venn diagram showing the significantly different metabolic features between the serum and brain pool. The number at the intersection represents the number of significantly different metabolites shared by serum and brain, while the number out of the intersection represents the number of unique metabolites in each pool. (b) Of the shared metabolites in both pools, 1-palmitoyl-phosphatidylcholine in the brain of the LPS group was significantly less than that of the SPF group (p = .0016). 1-palmitoyl-phosphatidylcholine levels in both Reuteri and LPS/Reuteri groups were significantly higher than that of the LPS group (p = .048 and p < .0001, respectively). (c) In the unique brain pool, both Lyso PC (20:5) and palmitoylcarnitine in the brain of LPS group were significantly less than that of the SPF group (p = .0003 and p = .0197, respectively). These two metabolite levels in both Reuteri and LPS/Reuteri groups were significantly higher than that of the LPS groups (for Lyso PC (20:5), p = .045 and p = .0009, respectively; for palmitoylcarnitine, p = .0079 and p = .0009, respectively). (d) In the unique serum pool, 1-(1Z-Hexadecenyl)-sn-glycero-3-phosphocholine level in the LPS group was significantly less (p = .016) and PC(P-18:0/22:6) (p = .039) level was significantly higher than that of the SPF group. These two metabolite levels in both the Reuteri and LPS/Reuteri groups were similar to that of the SPF group. All data were analyzed by one-way ANOVA with Tukey’s post hoc test, all n = 3. Unique features using their putatively identified names that crossed the BBB of the offspring upon maternal LPS challenge were identified in (e) Venn diagram, revealing that there were two features that uniquely crossed the BBB under the influence of LPS. (f) The levels of 8-HETE and (c) 2-arachidonoyl-lysophosphatidylcholine were not different among the four treatment groups (one-way ANOVA). Unique features that crossed the BBB of the offspring upon maternal L. reuteri exposure during lactation were identified in (g) Venn diagram, revealing that there were 14 unique features that crossed the BBB under the influence of L. reuteri.

References

    1. Han VX, Patel S, Jones HF, Nielsen TC, Mohammad SS, Hofer MJ, Gold W, Brilot F, Lain SJ, Nassar N, et al. Maternal acute and chronic inflammation in pregnancy is associated with common neurodevelopmental disorders: a systematic review. Transl Psychiatry. 2021;11(71). doi:10.1038/s41398-021-01198-w - DOI - PMC - PubMed
    1. Furman D, Campisi J, Verdin E, Carrera-Bastos P, Targ S, Franceschi C, Ferrucci L, Gilroy DW, Fasano A, Miller GW, et al. Chronic inflammation in the etiology of disease across the life span. Nat Med. 2019;25(1822–1832). doi:10.1038/s41591-019-0675-0 - DOI - PMC - PubMed
    1. Ginsberg Y, Khatib N, Weiner Z, Beloosesky R.. Maternal inflammation, fetal brain implications and suggested neuroprotection: a summary of 10 years of research in animal models. Rambam Maimonides Med J. 2017;8. doi:10.5041/RMMJ.10305. - DOI - PMC - PubMed
    1. Meyer U, Feldon J, Schedlowski M, Yee BK.. Immunological stress at the maternal-foetal interface: a link between neurodevelopment and adult psychopathology. Brain Behav Immun. 2006;20(378–388). doi:10.1016/j.bbi.2005.11.003. - DOI - PubMed
    1. Burd I, Bentz AI, Chai J, Gonzalez J, Monnerie H, Le Roux PD, Cohen AS, Yudkoff M, Elovitz MA. Inflammation-induced preterm birth alters neuronal morphology in the mouse fetal brain. J Neurosci Res. 2010;88(1872–1881). doi:10.1002/jnr.22368. - DOI - PMC - PubMed

Publication types

Substances

LinkOut - more resources