. 2023 Feb 24;8(80):eadd1823.
doi: 10.1126/sciimmunol.add1823. Epub 2023 Feb 17.

IL-21R signal reprogramming cooperates with CD40 and BCR signals to select and differentiate germinal center B cells

Affiliations

IL-21R signal reprogramming cooperates with CD40 and BCR signals to select and differentiate germinal center B cells

Wei Luo et al. Sci Immunol. .

Abstract

Both B cell receptor (BCR) and CD40 signaling are rewired in germinal center (GC) B cells (GCBCs) to synergistically induce c-MYC and phosphorylated S6 ribosomal protein (p-S6), markers of positive selection. How interleukin-21 (IL-21), a key T follicular helper (TFH)-derived cytokine, affects GCBCs is unclear. Like BCR and CD40 signals, IL-21 receptor (IL-21R) plus CD40 signals also synergize to induce c-MYC and p-S6 in GCBCs. However, IL-21R plus CD40 stimulation differentially affects GCBC fate compared with BCR plus CD40 ligation-engaging unique molecular mechanisms-as revealed by bulk RNA sequencing (RNA-seq), single-cell RNA-seq, and flow cytometry of GCBCs in vitro and in vivo. Whereas both signal pairs induced BLIMP1 in some GCBCs, only the IL-21R/CD40 combination induced IRF4hi/CD138+ cells, indicative of plasma cell differentiation, along with CCR6+/CD38+ memory B cell precursors. These findings reveal a second positive selection pathway in GCBCs, document rewired IL-21R signaling in GCBCs, and link specific TFH- and Ag-derived signals to GCBC differentiation.


Conflict of interest statement

Competing Interests: Mark Shlomchik is a co-founder and CSO of the small biotech company BlueSphere Bio. The other authors declare that they have no competing interests.

Figures

Figure 1:
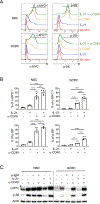
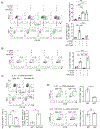
Figure 1:. IL-21R and CD40 signals synergize to induce c-MYC and p-S6 in GCBC
(A-B) Purified splenic B cells from d14 NP-CGG immunized B1-8i mice were stimulated with 2.5μg/mL ⍺-CD40 tetramer and/or 10ng/mL IL-21 for 2h. (A) Histogram of p-S6 and c-MYC in GCBC or NBC (gated as in Figure S1A). (B) Frequency (bars show mean ± SEM) of c-MYChi (n=5) and p-S6+ (n=3) cells among GCBC and NBC pooled from 4–5 mice for each experiment after the indicated stimulations. *P≤0.05, **P≤0.01, ***P≤0.001, ****P≤0.0001. (C) Splenic GCBC from d14 NP-CGG immunized NBC from MEG or B1-8i mice were isolated and stimulated for 2h as described in (A-B). Cell lysates were analyzed by immunoblotting. Four independent experiments were performed with similar results (one with MEG mice and three with B1-8i mice). Cells were pooled from 2–13 mice in each experiment. Shown are data for MEG mice. Representative data for B1-8i mice are shown in Figure S1B.
Figure 2:
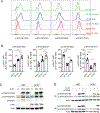
Figure 2:. IL-21R signaling is reprogrammed in GCBC
(A-B) Splenocytes from NP-CGG immunized B1-8i CD45.2 and naive B1-8i CD45.1 mice were combined and stimulated with 20 ng/ml IL-21 for 30 min. p-STATs were detected by antibodies and analyzed by flow cytometry, gating on NBC and GCBC, separated by DZ and LZ (Figure S1). (A) Representative histograms for p-STATs and (B) Tabulated data (mean ± SEM) of six mice from two experiments. *P≤0.05, **P≤0.01, ***P≤0.001, ****P≤0.0001 (C-D) Splenic GCBC from d14 NP-CGG immunized B1-8i mice and splenic NBC from naive B1-8i mice were isolated and stimulated for 15m and 30m with 10ng/ml IL-21 (C), or stimulated for 2h and 4h with 2.5μg/ml ⍺-CD40 tetramer and/or 10ng/ml IL-21 (D). Cell lysates were analyzed by immunoblotting. Data represent one of two independent experiments with cells pooled from 2–5 mice in each experiment.
Figure 3:
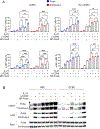
Figure 3:. Synergy among IL-21R, CD40 and BCR signals
(A) Bead-purified splenic B cells from d14 NP-CGG immunized B1-8i mice were stimulated as described in Figure 3A–B. The induction of p-S6 and c-MYC in GCBC and Non-GCBC was analyzed by flow cytometry as in Figure 1 and tabulated (mean ± SEM). Figure S3D shows representative flow cytometry results. Data represent three independent experiments with cells pooled from 4–5 mice in each experiment. *P≤0.05, **P≤0.01, ***P≤0.001, ****P≤0.0001 (B) Isolated splenic GCBC from day 14 NP-CGG immunized B1-8i mice and isolated splenic NBC from naïve B1-8i or B1-8i Jκ KO mice were stimulated for 2h as indicated, then analyzed by immunoblotting. Blots represent one of three independent experiments with similar results. GCBC were pooled from 10–13 mice, and NBC were pooled from 2–5 mice.
Figure 4:
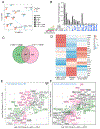
Figure 4:. RNA-seq analysis of short term GCBC stimulation responses
Purified GCBC from day 14 NP-CGG immunized MEG mice were stimulated with 20μg/ml ⍺-IgM, 10ng/ml IL-21, 2.5μg/ml ⍺-CD40 (prepared as tetramer) alone or in combination (IL-21 + α-CD40 or α-IgM + α-CD40) for 2h and 4h and then analyzed by RNA sequencing. (A) PCA plot showing transcriptional differences (average over all replicates) between different stimuli. Stimuli and time points are shown in different shapes and colors, respectively. Arrows on the PCA plot demonstrate the greater difference between combined stimuli at 4h than 2h and also the unique trajectories for combined stimuli. (B) UpSet plot showing shared and unique significantly induced genes (FDR < 0.01, Log2 Fold Change >1.5) among the indicated stimuli in comparison to no stimulation in GCBC at 4h. Total genes induced by individual stimuli are shown by the bars at left. (C) Venn diagram showing unique and common genes significantly differentially induced (FDR < 0.01, log2 Fold Change > 1.5) upon 4h of combined stimuli of ⍺-IgM + ⍺-CD40 and IL-21 + ⍺-CD40 compared to unstimulated GCBC. (D) Heatmap showing z-scored fold enrichment of top significantly enriched TF ChEA terms (from enrichR) of shared and uniquely induced genes (from panel C) (see Methods for details). Enrichment was calculated based on Fisher’s Exact Test (with all expressed genes as background) followed by Storey’s Q-value FDR correction. (E and F) Scatter plots showing log2 fold change expression values of selected top differentially expressed genes encoding transcription factors (TF) (R2 0.676, p-value < 2.2e-16) (E) and surface or secreted proteins (R2 0.656, p-value < 2.2e-16) (F) upon combined stimuli of ⍺-IgM + ⍺-CD40 (x-axis) and IL-21 + ⍺-CD40 (y-axis) for 4h in comparison to no stimulation. Genes that are significantly differentially expressed in comparison to controls (FDR < 0.01) are shown in black dots and non-significant genes are in gray. Genes significantly differentially expressed across both combined stimuli (⍺-IgM + ⍺-CD40 and IL-21 + ⍺-CD40) are annotated in black text, while those differentially expressed upon ⍺-IgM + ⍺-CD40 only are in green and those differentially induced by IL-21 + ⍺-CD40 only are in pink. Genes whose expression is significantly different between the stimulus conditions are boxed in gray.
Figure 5:
Figure 5:. Different ligand combinations result in unique differentiation outcomes in GCBC
Bead-purified GCBC from d14 NP-CGG immunized B1-8i mice were stimulated as indicated for 48h and analyzed by flow cytometry (gating in Figure S5B). (A) PC precursor differentiation was assessed first by gating on BLIMP1 upregulation and BCL6 downregulation (top row), followed by CD138 and IRF4 expression. (B) MBC precursor differentiation was detected as cells expressing both CD38 and CCR6 (pre-gated on live single B220+ CD138- IRF4- GCBC). (C) Comparison of IgM+ and IgMneg switched GCBC propensities for PC differentiation after IL-21 + ⍺-CD40 stimulation. (D) Comparison of IgM+ and IgG1+ GCBC for MBC precursor differentiation by IL-21 + ⍺-CD40 stimulation and IL-21 + ⍺-CD40 + NP-Ficoll stimulation. Data represent 3–5 independent experiments with purified GCBC pooled from 7–10 mice in each experiment. Bar graphs show tabulated data for all experiments (mean ± SEM). (*P≤0.05, **P≤0.01, ***P≤0.001, ****P≤0.0001)
Figure 6:
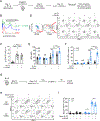
Figure 6:. In vivo both IL-21 and α-CD40 are necessary for maximal upregulation of IRF4 in GCBC.
(A-F) Purified B1-8i splenocytes were transferred into IL-21R KO Rag2KO recipients (all C57BL/6), immunized with NP-CGG, and 10 days post immunization were treated with PBS, 5µg recombinant murine IL-21, and/or 50µg α-CD40, and analyzed either 30 minutes (pSTAT3) or 4 hours (BCL6/IRF4) after treatment (gated as in Figure S1A). (A) Schematic of experiment design. (B) Histogram of p-STAT3(Y705) in GCBC 30 minutes after IL-21/α-CD40 treatment. (C) Frequency of pSTAT3(Y705)+ cells among GCBC pooled from 2 experiments with 3–4 mice per group, 2 tailed t-test. (D-F) Expression of BCL6 and IRF4 on LZ and DZ GCBC was assessed at 4 hours post treatment. Comparison of frequencies of gMFI of IRF4 (E) and BCL6lo IRF4hi cells (F) among DZ (black) or LZ (blue) GCBC, pooled from 2 experiments each with 3–5 mice per group, 2 tailed t-test comparing LZ vs DZ, one tailed t-test comparing treatment groups. (G-I) B1-8i BALB/c mice immunized with NP-CGG were treated with 100µg IL-21 blocking antibody at day 13.5, then at day 14 mice were treated with 50µg α-CD40, and BCL6 and IRF4 expression were assessed 4 hours later. Data are pooled from two experiments each with 4–8 mice per group. (G) Schematic of experiment design. (H) BCL6 and IRF4 expression on LZ and DZ GCBC 4 hours post α-CD40 injection. (I) Comparison of the frequency of BCL6lo IRF4hi among DZ (black) or LZ (blue) GCBC, one tailed t-test between treatment groups. (I) All bars show mean ± SD, *P≤0.05, **P≤0.01, ***P≤0.001, ****P≤0.0001. See Figure S1E for detailed gating strategy.
Figure 7:
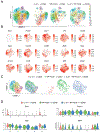
Figure 7:. Single cell RNA-seq analysis of stimulated GCBC cultures
GCBC isolated from d14 NP-CGG immunized B1-8i mice were stimulated with the indicated combinations of stimuli for 48h. Cells were then analyzed by single cell RNA sequencing. (A) Projection of cell transcriptomes from all cells on a UMAP plot, showing 14 distinct clusters as derived by Seurat (see Figure S8A). Cells that derive from each stimulus group are depicted separately to the right. (B) UMAP plot showing log2-normalized expression of selected genes relevant to GC biology, with scale bars for each plot. (C) From left to right: UMAP plot, showing five distinct Seurat sub clusters of cluster 8 from Figure 7A (see Figure S8B for strategy), color-coded overlay according to stimuli and then split view of cells based on stimuli. (D) Violin plots depicting the expression of markers for plasmablast differentiation: Sdc1, Xbp1, Prdm1 and Irf4 across cluster 8 sub clusters (0–4), grouped by stimulus.

Similar articles

Cited by

References

    1. Shlomchik MJ, Weisel F, Germinal center selection and the development of memory B and plasma cells. Immunol Rev 247, 52–63 (2012). - PubMed
    1. Mesin L, Ersching J, Victora GD, Germinal Center B Cell Dynamics. Immunity 45, 471–482 (2016). - PMC - PubMed
    1. Lau AW, Brink R, Selection in the germinal center. Curr Opin Immunol 63, 29–34 (2020). - PubMed
    1. Anderson SM et al., Taking advantage: high-affinity B cells in the germinal center have lower death rates, but similar rates of division, compared to low-affinity cells. J Immunol 183, 7314–7325 (2009). - PMC - PubMed
    1. Mayer CT et al., The microanatomic segregation of selection by apoptosis in the germinal center. Science 358, (2017). - PMC - PubMed

Publication types

MeSH terms